Wetlands are the largest land-cover class in the supplied 2025 Lanier County data at 35.81%. Forest follows at 22.46%, agriculture at 21.69%, grassland at 8.42%, and developed land at 7.14%. This Lanier County Georgia Land Cover Map is especially useful for seeing how a broad wetland network, farm patches, and wooded areas surround a small built center near Lakeland.
The article includes current land cover, forest and farmland, fractional impervious surface, and a 1985–2025 endpoint comparison. Four WebP images can be compared with the text, and the four original 2480 × 1754 JPG maps are available together in one ZIP. The set works well for county profiles, environmental lessons, presentations, and broad screening when the map scale and classification limits are kept in mind.
Table of Contents
Banks Lake gives the western wetland concentration a clear local reference
The U.S. Fish & Wildlife Service describes Banks Lake National Wildlife Refuge, just west of Lakeland, as a shallow blackwater lake with cypress swamp, freshwater marsh, uplands, and open water. It places the refuge inside the Grand Bay–Banks Lake ecosystem, which the agency identifies as Georgia’s second-largest freshwater wetland system. That local context is unusually important for this county because the 2025 map is dominated by teal wetland cover.
The broadest teal area lies in the western and southwestern portion of the county. Additional wetland bands run through the center and continue northward in branching shapes. The pattern is not confined to one isolated lake-shaped patch. Wetlands repeatedly border forest, farmland, and grassland, creating a landscape in which wet and drier surfaces change over relatively short distances.
The 2025 overview shows wetlands first, then a near tie between forest and agriculture
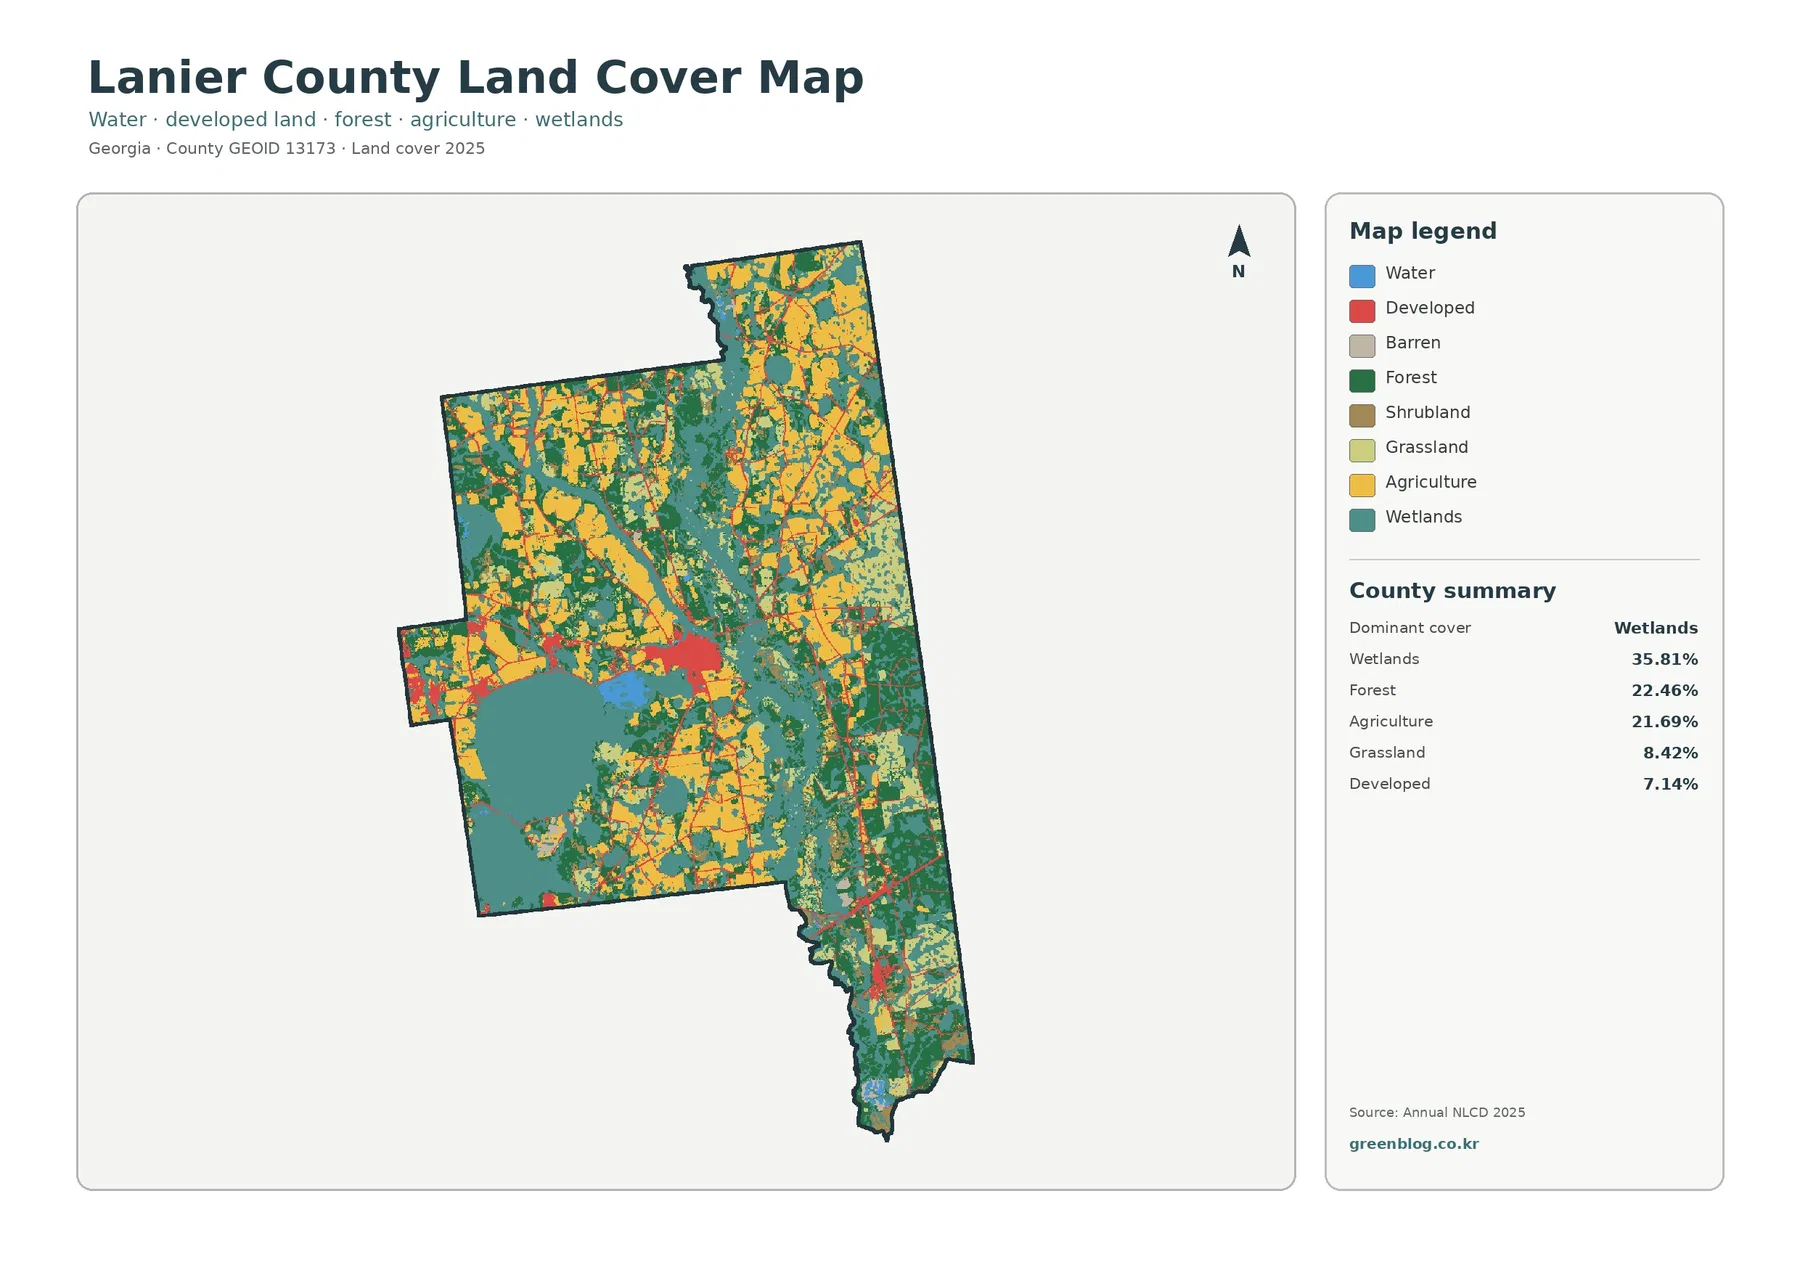
Wetlands account for 35.81%, while forest and agriculture are much closer to one another at 22.46% and 21.69%. Forest is strongest along the eastern side and southeast, with additional wooded blocks around the central wetland system. Agriculture is more fragmented. Yellow fields are frequent in the north and northeast and recur through central and southern rural areas.
Grassland contributes 8.42%, exceeding the 7.14% developed share. Light green patches often sit beside agriculture or between wetland and forest blocks. Shrubland represents 3.38% in the vegetation-focused summary. Those smaller open classes matter because they prevent the county from dividing neatly into only three categories of wetland, forest, and farmland.
Open water is only 0.71%. That small figure does not conflict with the wetland-dominant map. Open water represents exposed water surfaces, whereas wetlands may include saturated ground and water-influenced vegetation. Banks Lake itself also includes cypress and marsh habitat, so a water-related landscape can contain far more wetland-class pixels than blue open-water pixels.
Forest and farmland divide the drier ground in different ways
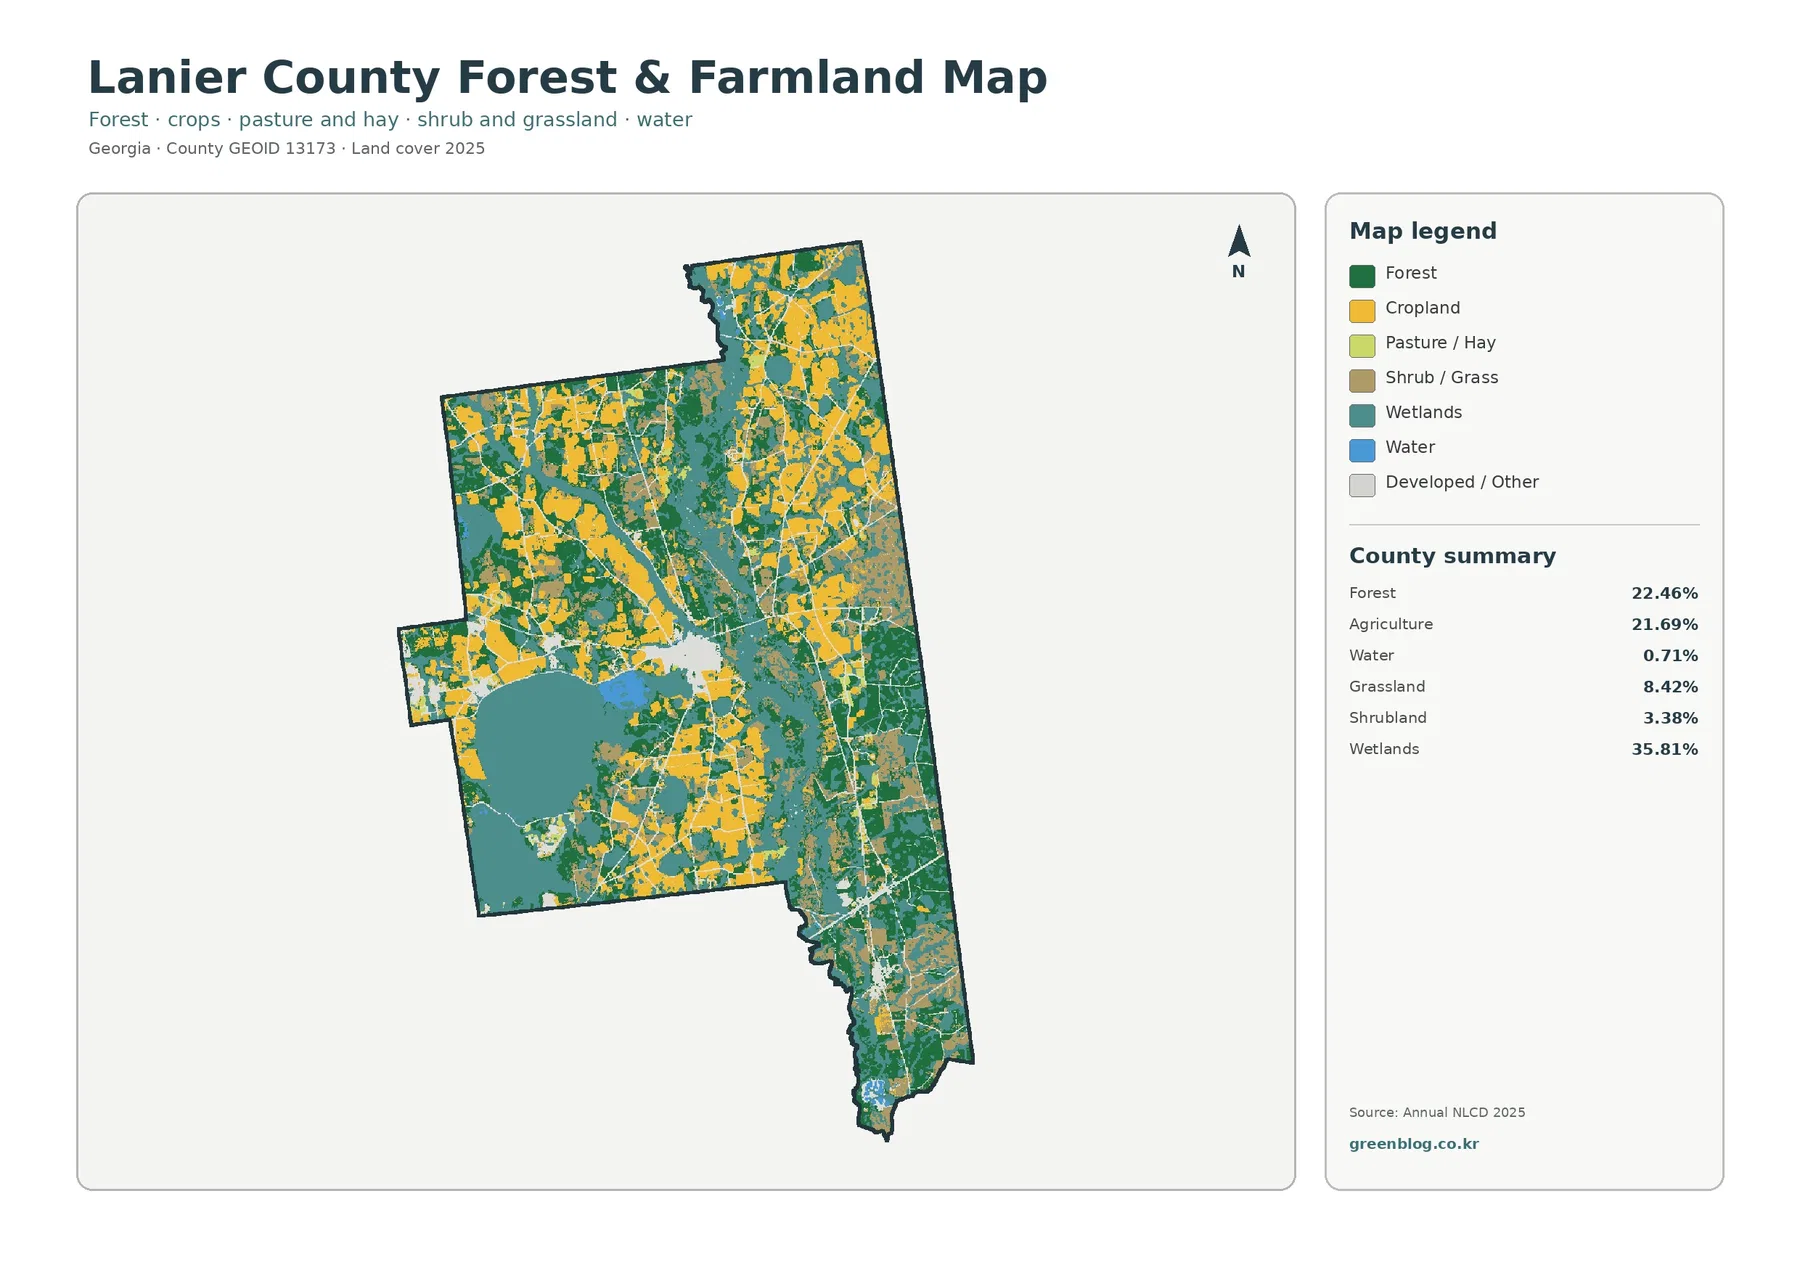
Once the developed color is muted, the contrast between wooded blocks and agricultural openings becomes easier to follow. Forest forms larger, more connected green areas along the east and southeast and around portions of the central wetland network. Agriculture is broken into many yellow patches, especially across the north and northeast, with additional fields south of the central built area.
The two percentages differ by less than one point, but their shapes are not interchangeable. Forest often forms irregular continuous blocks and narrow connections around wetlands. Agricultural areas tend to appear as sharper-edged openings and clusters separated by trees, grass, wet ground, or development. That spatial contrast is more informative than simply saying the county has similar amounts of forest and agriculture.
Lanier County’s UGA Extension office provides local agriculture and natural-resource information, including soil and water testing and resources for field crops, fruits and vegetables, livestock, and other production topics. Those programs confirm that agriculture is an active part of the county context, but the yellow map class does not identify a crop species, farm operator, or field boundary.
A compact Lakeland-area hard-surface center stands out inside a mostly low-impervious county
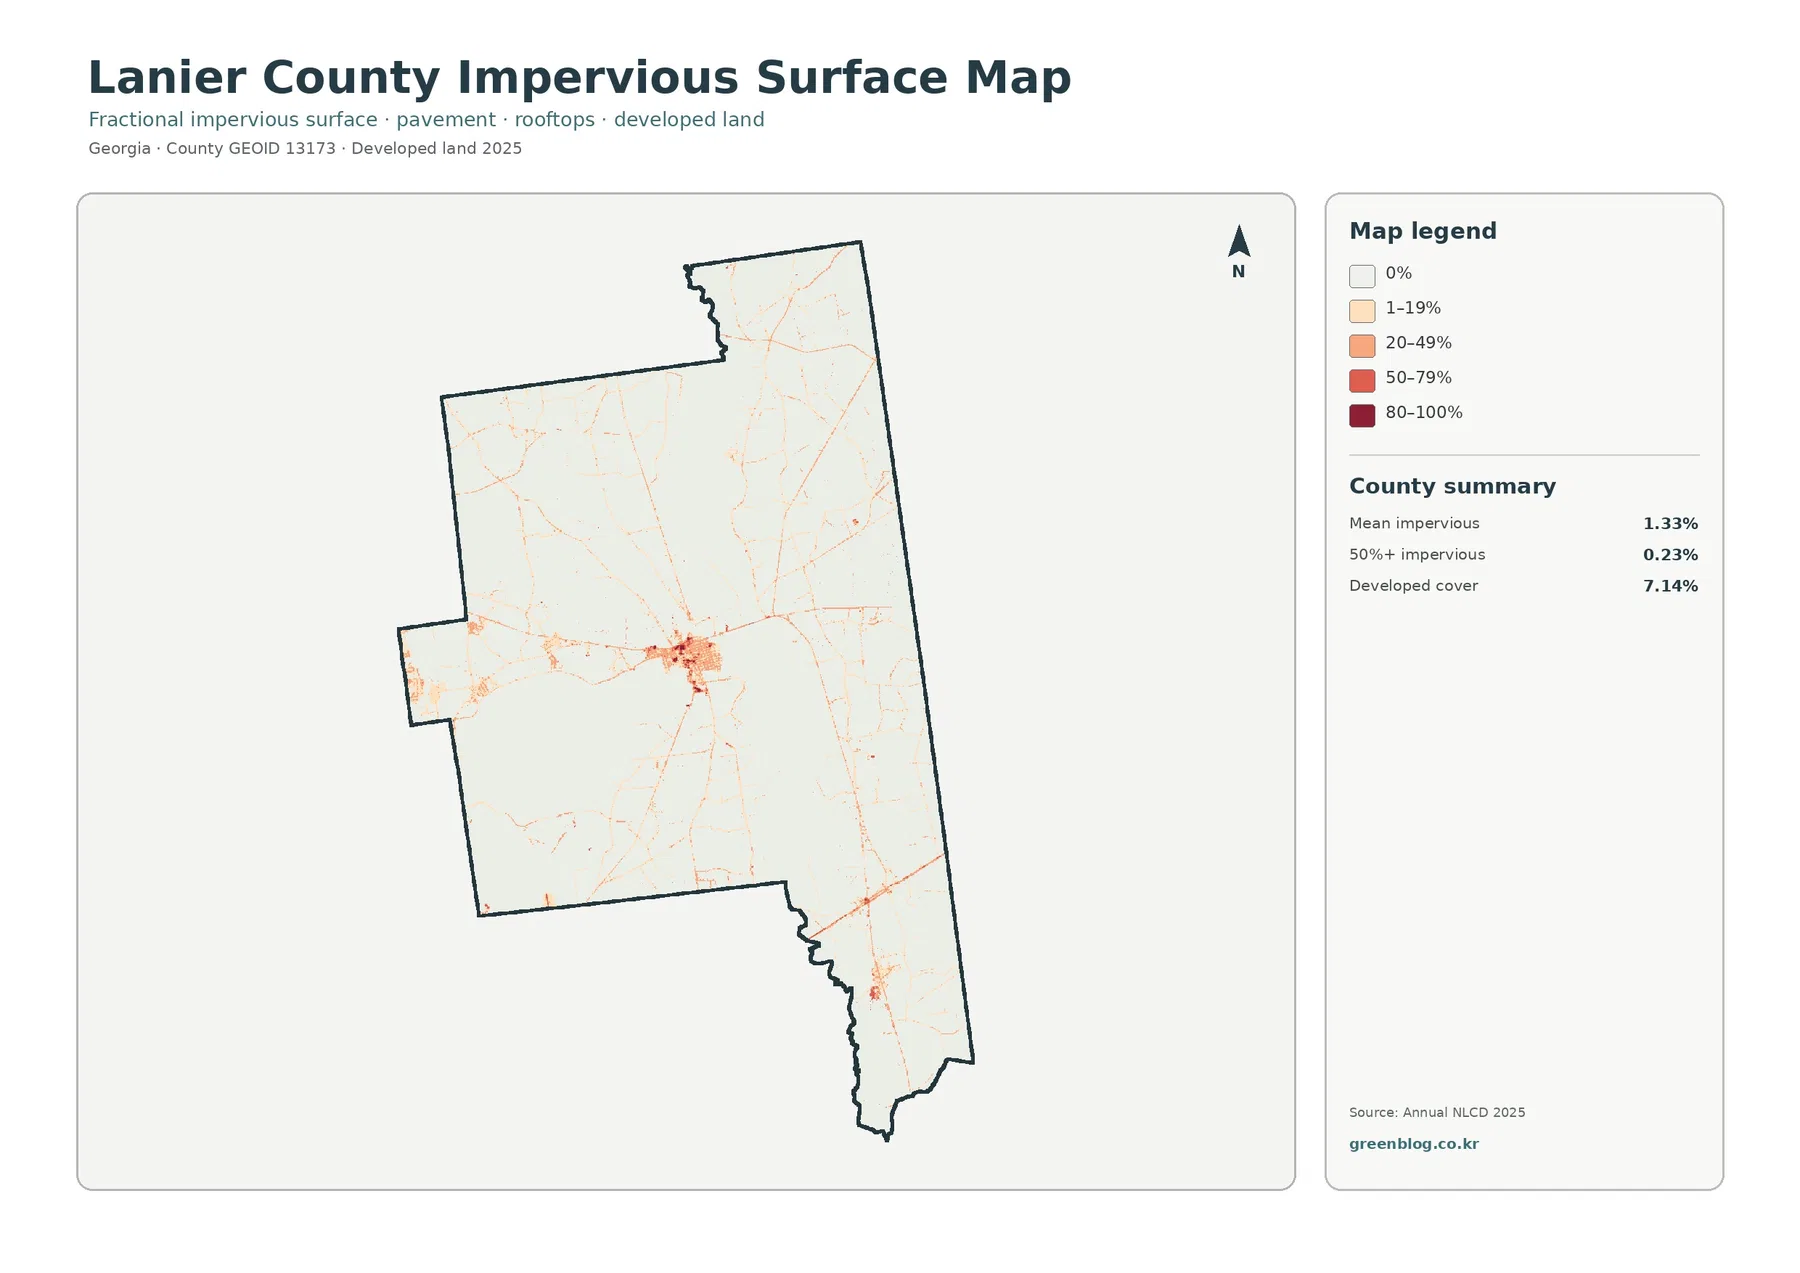
The impervious map strips away most vegetation colors and makes the county’s built center immediately visible. A dense cluster of orange and red cells sits near the middle of the county. FWS places Banks Lake just west of Lakeland, and UGA Extension’s county office is in Lakeland, giving the central concentration a useful place reference. The map itself does not show city limits, so the cluster should be described as Lakeland-area development rather than a precise municipal outline.
Mean impervious cover is 1.33%, and only 0.23% of the county is mapped at 50% impervious surface or higher. Both values are far below the 7.14% developed share. Developed land can include yards, trees, grass, and bare soil around roads and buildings. Fractional impervious cover isolates roofs, pavement, parking areas, and comparable hard materials.
The 1985–2025 comparison contains far more forest-loss classification than developed conversion
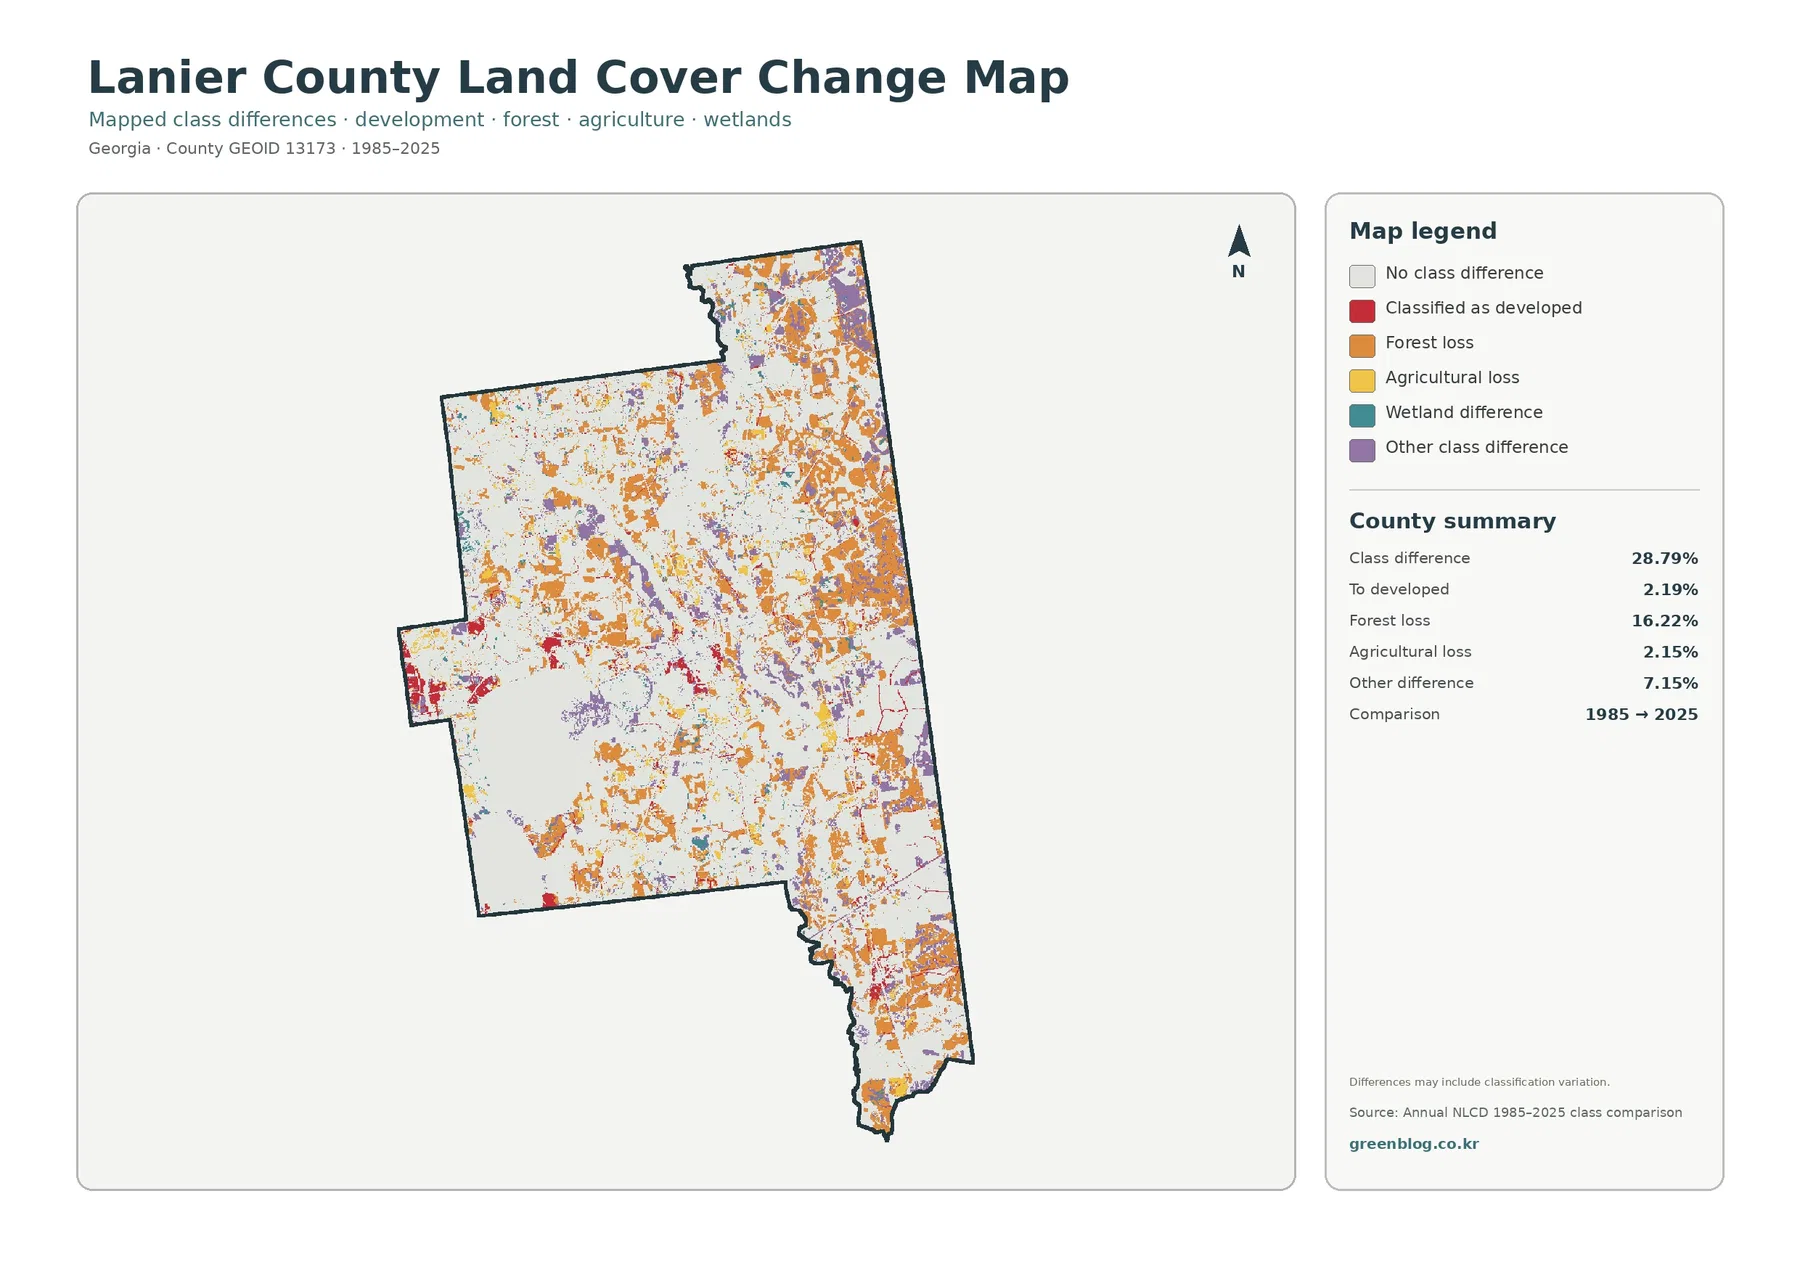
The total class difference between 1985 and 2025 is 28.79%. This is the share of cells assigned different classes at the two endpoints, not the share of Lanier County that was damaged or permanently transformed. The map warns that classification variation may be included, which matters when imagery conditions, seasonal appearance, mixed pixels, or classification methods differ.
The printed summary lists 16.22% forest loss, 2.19% classified to developed, 2.15% agricultural loss, and 7.15% other difference. Orange forest-loss cells are widespread across the north, east, southeast, and parts of the center. Red developed-change cells are most noticeable around the present central built area and in a few western locations, but they occupy a much smaller share than the orange category.
“Forest loss” is also an endpoint classification label, not an explanation of cause. A cell that was forest at the earlier endpoint received another class in 2025. The map alone cannot distinguish timber harvest, agriculture, development, storms, vegetation change, or classification error. Intermediate imagery and local records are needed before assigning a reason to a particular orange cluster.
Thirty-meter land-cover cells are not parcel or wetland-jurisdiction boundaries
Annual NLCD is a raster product based on Landsat imagery at 30-meter resolution. Each square cell receives a predominant land-cover class even when trees, grass, water, pavement, and a small building share the same space. Narrow streams, small ponds, thin forest strips, scattered houses, and wetland edges may therefore look wider, narrower, or less continuous than they are on the ground.
Land cover does not establish zoning, ownership, parcel boundaries, development rights, or legal wetland status. A teal wetland cell is not automatically a regulated wetland, and a yellow agricultural cell is not a farm-property line. Surveys, permitting, flood insurance, wetland jurisdiction, and property decisions require the authoritative datasets and field work appropriate to those purposes.
Four original JPG maps are included in the download
The ZIP contains one 2480 × 1754 JPG for each view discussed above: 2025 land cover, forest and farmland, impervious surface and developed land, and the 1985–2025 land-cover comparison. The package does not identify these files as meeting an A3 high-resolution reference, so a proof print is advisable before producing a large poster.
Frequently Asked Questions
Is all of the 35.81% wetland cover part of Banks Lake National Wildlife Refuge?
No. Banks Lake and the surrounding Grand Bay–Banks Lake wetland system provide important context for the county’s wetland-heavy pattern, but the supplied map does not draw the refuge boundary. The 35.81% figure is a countywide land-cover statistic, not a measurement of refuge acreage.
Why is developed land 7.14% while mean impervious cover is only 1.33%?
Developed classes can include grass, trees, yards, bare soil, and other permeable surfaces around buildings and roads. Fractional impervious cover isolates rooftops, pavement, parking areas, and similar hard materials, so its countywide average is much lower than the broader developed-land share.
Does 28.79% class difference mean that much land was damaged between 1985 and 2025?
No. It is the percentage of cells assigned different classes at the two endpoints. The summary separately lists 16.22% forest loss, 2.19% classified to developed, 2.15% agricultural loss, and 7.15% other difference. The map also warns that classification variation may be included, so timing and cause require additional evidence.
Sources and Reference Data
- MRLC Annual NLCD Data – official access point for annual land-cover, change, and related products
- USGS Annual NLCD Land Cover Classification – definitions for forest, agriculture, wetlands, developed land, and related classes
- U.S. Fish & Wildlife Service – Banks Lake National Wildlife Refuge – official local context for Banks Lake and the Grand Bay–Banks Lake wetland ecosystem
- UGA Extension – Lanier County Agriculture & Natural Resources – local agriculture, soil, water, and natural-resource information
- U.S. Census Bureau TIGER/Line Shapefiles – authoritative county, place, and transportation layers for comparison
Map File Information
The ZIP contains four original JPG maps for comparing Lanier County's 35.81% wetland cover, forest and agriculture, Lakeland-area development, impervious surfaces, and 1985–2025 class differences.
- Included Files: Use only the versions confirmed in the article and supplied images
- File Type: Use the confirmed download contents
- Intended Use: Printing, education, presentations, and map-based projects
Related Maps
- Appling County Georgia Land Cover Map
- Atkinson County Georgia Land Cover Map
- Bacon County Georgia Land Cover Map
Green Map creates custom-edited map images using open geographic data sources such as geoBoundaries, Natural Earth, OpenStreetMap, and government open data.
These maps are edited visual materials, not raw data files, and are provided for education, documents, presentations, and graphic reference.