World Bank indicator SE.SEC.ENRR measures the gross enrollment ratio in secondary education. The latest non-empty dataset covers 208 countries and economies with observation years ranging from 1986 to 2025. Across those latest observations, the unweighted mean is 85.15%, the median 91.28%, the first quartile 70.54%, and the third quartile 102.70%.
Gross enrollment is not the same as net enrollment. The numerator includes every student enrolled in secondary education regardless of age, while the denominator is the population of the official age group corresponding to secondary education. Late entry, early entry and grade repetition can therefore push the ratio above 100%.
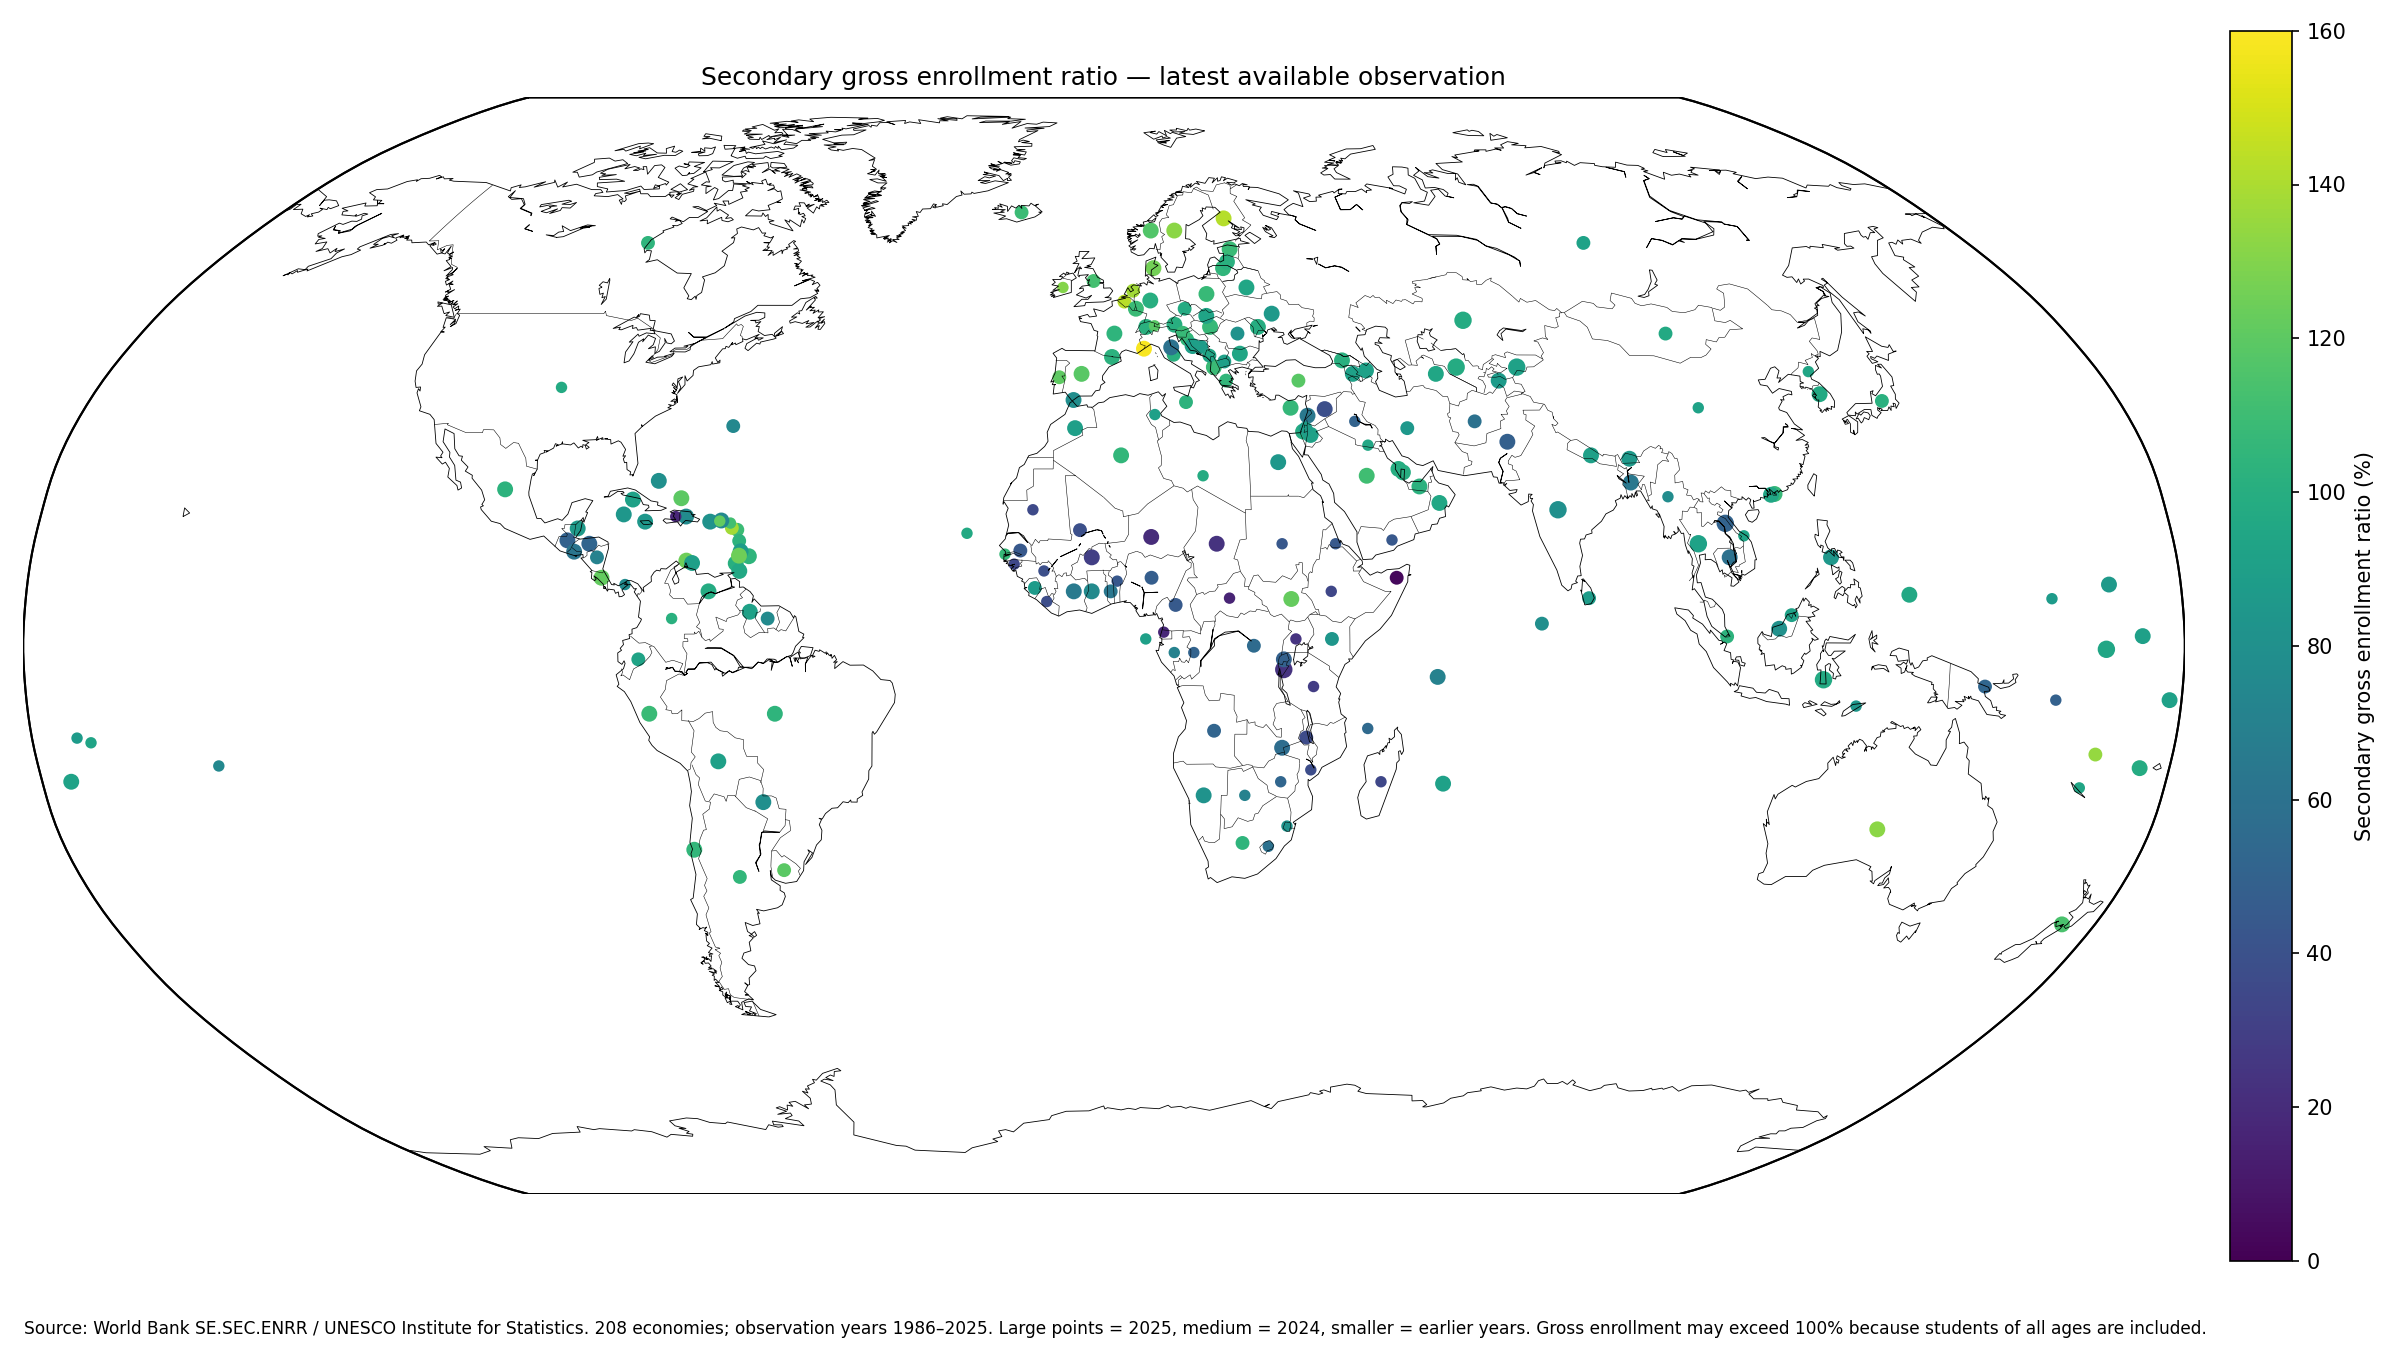
Table of Contents
Gross enrollment compares all enrolled students with the official secondary-school-age population
The World Bank metadata glossary defines the gross enrollment ratio as total enrollment in the education level, regardless of age, divided by the population of the age group that officially corresponds to that level and multiplied by 100.
Secondary programs are mapped to UNESCO’s International Standard Classification of Education to improve cross-country comparability. The denominator uses population estimates for the official secondary-school-age group, while the numerator counts enrollment in the corresponding education level.
Values above 100% are possible and are not automatically errors
The World Bank Data Help Desk explains that gross enrollment can exceed 100% because over-age and under-age students are included. Late entry, early entry and repetition can make total enrollment larger than the population in the official age group.
In this dataset, 64 of the 208 latest observations exceed 100%. In the synchronized 2024 subset, 37 of 101 values exceed 100%. A ratio of 120% should therefore not be interpreted as 120% of children attending school; it reflects the relationship between all enrolled students and the official-age population.
Gross and net enrollment answer different questions
A net enrollment rate restricts the numerator to students who are themselves within the official age group. Gross enrollment includes everyone enrolled at the level, so it provides a broader measure of participation and system capacity while also capturing age mismatch.
For questions about the share of official-age adolescents who are enrolled, net enrollment is more direct. For questions about total enrollment pressure and the presence of over-age or under-age pupils, the gross ratio provides additional information.
The latest-observation median is 91.28%
The median across 208 latest observations is 91.28%. The middle half lies between 70.54% and 102.70%. The mean of 85.15% is below the median because a group of very low enrollment ratios stretches the lower tail.
31 observations are below 50%, 19 are from 50% to under 70%, 44 from 70% to under 90%, 50 from 90% to under 100%, 48 from 100% to under 120%, and 16 are at least 120%.
| Latest secondary gross enrollment ratio | Economies | Share of 208 |
|---|---|---|
| Below 50% | 31 | 14.9% |
| 50% to under 70% | 19 | 9.1% |
| 70% to under 90% | 44 | 21.2% |
| 90% to under 100% | 50 | 24.0% |
| 100% to under 120% | 48 | 23.1% |
| 120% or more | 16 | 7.7% |
Monaco has the highest latest observation at 158.55%
Monaco records 158.55%, followed by Belgium 142.96%, Finland 142.40%, the Netherlands 137.51%, St. Kitts and Nevis 137.51%, and Vanuatu 134.67%.
The observation years are not identical: Monaco and Finland are from 2024, while Belgium and the Netherlands are from 2023. The complete latest-value ranking maximizes geographic coverage rather than providing a single-year league table.
| True latest-observation rank | Country or economy | Observation year | Secondary gross enrollment |
|---|---|---|---|
| 1 | Monaco | 2024 | 158.55% |
| 2 | Belgium | 2023 | 142.96% |
| 3 | Finland | 2024 | 142.40% |
| 4 | Netherlands | 2023 | 137.51% |
| 5 | St. Kitts and Nevis | 2023 | 137.51% |
| 6 | Vanuatu | 2023 | 134.67% |
| 7 | Sweden | 2024 | 131.96% |
| 8 | Australia | 2024 | 131.93% |
| 9 | Ireland | 2022 | 130.60% |
| 10 | Denmark | 2024 | 125.63% |
| 11 | St. Vincent and the Grenadines | 2024 | 124.87% |
| 12 | Aruba | 2024 | 124.38% |
| 13 | South Sudan | 2024 | 122.12% |
| 14 | Costa Rica | 2024 | 121.81% |
| 15 | Virgin Islands (U.S.) | 1997 | 121.69% |
The synchronized 2024 subset contains 101 economies
The 2024 subset contains 101 economies, with an unweighted mean of 91.73%, a median of 94.65%, a first quartile of 84.46%, and a third quartile of 104.37%.
Within 2024, Monaco records 158.55%, Finland 142.40%, Sweden 131.96%, Australia 131.93%, and Denmark 125.63%. This subset is more useful when the goal is a same-year comparison.
| 2024 rank | Country or economy | Secondary gross enrollment |
|---|---|---|
| 1 | Monaco | 158.55% |
| 2 | Finland | 142.40% |
| 3 | Sweden | 131.96% |
| 4 | Australia | 131.93% |
| 5 | Denmark | 125.63% |
| 6 | St. Vincent and the Grenadines | 124.87% |
| 7 | Aruba | 124.38% |
| 8 | South Sudan | 122.12% |
| 9 | Costa Rica | 121.81% |
| 10 | Turks and Caicos Islands | 119.73% |
| 11 | Spain | 118.54% |
| 12 | Norway | 116.25% |
| 13 | New Zealand | 114.23% |
| 14 | Saudi Arabia | 110.66% |
| 15 | Luxembourg | 108.58% |
More than one third of the 2024 subset exceeds 100%
In 2024, 7 observations are below 50%, 8 from 50% to under 70%, 23 from 70% to under 90%, 26 from 90% to under 100%, 28 from 100% to under 120%, and 9 are at least 120%.
The frequency of ratios above 100% reinforces the need to distinguish gross enrollment from net enrollment. High values can combine broad participation with substantial over-age or under-age enrollment.
Niger and Chad have the lowest 2024 observations
Niger records 19.87%, Chad 23.49%, Burkina Faso 29.99%, the Syrian Arab Republic 38.74%, and Pakistan 48.28%.
A low gross enrollment ratio means total secondary enrollment is small relative to the official secondary-school-age population. Access, affordability, dropout, labor-market participation, conflict and regional inequality can all matter, but the ratio alone does not establish which cause dominates.
| Low-end 2024 order | Country or economy | Secondary gross enrollment |
|---|---|---|
| 1 | Niger | 19.87% |
| 2 | Chad | 23.49% |
| 3 | Burkina Faso | 29.99% |
| 4 | Syrian Arab Republic | 38.74% |
| 5 | Pakistan | 48.28% |
| 6 | Rwanda | 48.79% |
| 7 | Guatemala | 49.58% |
| 8 | Honduras | 51.76% |
| 9 | Zambia | 56.79% |
| 10 | Cambodia | 58.79% |
| 11 | San Marino | 60.37% |
| 12 | El Salvador | 62.14% |
| 13 | Lebanon | 63.79% |
| 14 | Bangladesh | 64.30% |
| 15 | Cote d’Ivoire | 65.31% |
Many European economies have gross ratios around or above 100%
Finland records 142.40%, Sweden 131.96%, Denmark 125.63%, Spain 118.54%, Norway 116.25%, Luxembourg 108.58%, Albania 108.36%, France 103.79%, Austria 100.62%, and Germany 100.24% in their latest observations.
Belgium and the Netherlands, with 2023 observations, are even higher at 142.96% and 137.51%. These values describe enrollment relative to the official-age population, not a percentage of individual students who are somehow enrolled more than once.
| European examples | Observation year | Secondary gross enrollment |
|---|---|---|
| Belgium | 2023 | 142.96% |
| Finland | 2024 | 142.40% |
| Netherlands | 2023 | 137.51% |
| Sweden | 2024 | 131.96% |
| Denmark | 2024 | 125.63% |
| Portugal | 2023 | 120.35% |
| Spain | 2024 | 118.54% |
| Norway | 2024 | 116.25% |
| Luxembourg | 2024 | 108.58% |
| Albania | 2024 | 108.36% |
| France | 2024 | 103.79% |
| Italy | 2023 | 100.68% |
| Austria | 2024 | 100.62% |
| Germany | 2024 | 100.24% |
| Bulgaria | 2024 | 94.78% |
Sub-Saharan African observations range from the 20s to above 120%
South Sudan records 122.12% in 2024, while Niger is 19.87%, Chad 23.49%, and Burkina Faso 29.99%. Ghana is 75.72%, Zambia 56.79%, Rwanda 48.79%, and Kenya’s latest observation is 84.31% from 2023.
The large spread shows why a single regional number can be misleading. School access, age structure, progression patterns and the timing of the latest available observation can differ substantially across countries.
| Sub-Saharan Africa examples | Observation year | Secondary gross enrollment |
|---|---|---|
| South Sudan | 2024 | 122.12% |
| Kenya | 2023 | 84.31% |
| Ghana | 2024 | 75.72% |
| Cote d’Ivoire | 2024 | 65.31% |
| Zambia | 2024 | 56.79% |
| Rwanda | 2024 | 48.79% |
| Nigeria | 2023 | 46.89% |
| Senegal | 2023 | 44.07% |
| Mali | 2023 | 38.94% |
| Malawi | 2023 | 36.64% |
| Burkina Faso | 2024 | 29.99% |
| Chad | 2024 | 23.49% |
| Niger | 2024 | 19.87% |
Only nine latest observations are from 2025
The 2025 subset contains only nine economies, with a mean of 80.50% and a median of 92.09%. Uzbekistan records 98.12%, Kazakhstan 97.62%, Indonesia 97.17%, Naoero 94.53%, Thailand 92.09%, the Kyrgyz Republic 91.73%, India 79.59%, Lao PDR 50.54%, and Burundi 23.13%.
A source period extending to 2025 therefore does not mean all 208 economies have 2025 data. Most recent observations are concentrated in 2024 and 2023.
| Asian examples | Observation year | Secondary gross enrollment |
|---|---|---|
| Japan | 2023 | 101.54% |
| Uzbekistan | 2025 | 98.12% |
| Kazakhstan | 2025 | 97.62% |
| Indonesia | 2025 | 97.17% |
| Thailand | 2025 | 92.09% |
| Kyrgyz Republic | 2025 | 91.73% |
| Philippines | 2024 | 85.29% |
| Malaysia | 2024 | 80.28% |
| India | 2025 | 79.59% |
| Bangladesh | 2024 | 64.30% |
| Cambodia | 2024 | 58.79% |
| Lao PDR | 2025 | 50.54% |
| Pakistan | 2024 | 48.28% |
Latin American observations also span from below 50% to above 120%
Aruba records 124.38%, Costa Rica 121.81%, Uruguay 119.11%, Chile 105.61%, Argentina 105.57%, Brazil 104.14%, and Mexico 103.09%, while Guatemala is 49.58%, Honduras 51.76%, and El Salvador 62.14%.
The gross enrollment ratio should not be turned into a quality ranking. It does not measure learning achievement, attendance, instructional quality or whether enrolled students complete secondary education.
| Latin American examples | Observation year | Secondary gross enrollment |
|---|---|---|
| Aruba | 2024 | 124.38% |
| Costa Rica | 2024 | 121.81% |
| Uruguay | 2023 | 119.11% |
| Chile | 2024 | 105.61% |
| Argentina | 2023 | 105.57% |
| Brazil | 2024 | 104.14% |
| Mexico | 2024 | 103.09% |
| El Salvador | 2024 | 62.14% |
| Honduras | 2024 | 51.76% |
| Guatemala | 2024 | 49.58% |
Pacific economies show both high ratios and old observations
Australia records 131.93%, Vanuatu 134.67%, New Zealand 114.23%, Fiji 98.09%, Naoero 94.53%, Tonga 92.43%, and Kiribati 90.28%. The Solomon Islands latest observation is only 49.05% and dates to 2012.
That old observation is a clear example of why recency must remain visible in a latest-value map. Point size on the visual distinguishes recent and older data rather than implying every country is measured at the same date.
| Pacific examples | Observation year | Secondary gross enrollment |
|---|---|---|
| Vanuatu | 2023 | 134.67% |
| Australia | 2024 | 131.93% |
| New Zealand | 2024 | 114.23% |
| Fiji | 2024 | 98.09% |
| Naoero | 2025 | 94.53% |
| Tonga | 2024 | 92.43% |
| Kiribati | 2024 | 90.28% |
| Solomon Islands | 2012 | 49.05% |
Enrollment is not the same as attendance or completion
World Bank metadata notes that enrollment indicators are based on annual school surveys and do not necessarily reflect actual attendance or dropout during the year. A student can be formally registered but attend irregularly or leave school later.
Attendance indicators, completion rates and out-of-school rates answer different questions. They should be used alongside gross enrollment when the goal is to understand participation and progression in more detail.
Program duration and age reporting can affect international comparisons
The duration of secondary education and official school ages differ across national systems. UNESCO uses ISCED to improve comparability, but structural differences remain.
Age can also be estimated or misreported in settings where birth registration is incomplete. Because the denominator is the official-age population, population estimates and age definitions matter even though the numerator itself includes students of all ages.
Mixed observation years are the main limitation of the latest-value map
Of the 208 latest observations, 101 are from 2024, 50 from 2023, and 9 from 2025. A total of 160 observations are from 2023 or later, while 48 are from 2022 or earlier. The oldest latest observation dates to 1986.
The most-recent-non-empty approach expands geographic coverage but does not synchronize time. The article therefore separates the full 208-economy latest distribution from the 101-economy 2024 comparison.
| Latest observation year | Economies |
|---|---|
| 2025 | 9 |
| 2024 | 101 |
| 2023 | 50 |
| 2022 | 8 |
| 2021 | 5 |
| 2020 | 3 |
| 2019 | 2 |
| 2018 | 1 |
| 2017 | 5 |
| 2016 | 4 |
| 2015 | 3 |
| 2014 | 2 |
| 2013 | 1 |
| 2012 | 3 |
| 2007 | 2 |
| 2006 | 2 |
| 2005 | 2 |
| 1997 | 2 |
| 1993 | 1 |
| 1992 | 1 |
| 1986 | 1 |
The simple country mean is not a pupil-weighted global gross enrollment ratio
The 85.15% overall mean and the 91.73% 2024 mean give every economy equal weight. A country with tens of millions of secondary-age children and a small territory each contribute one percentage.
A true global gross enrollment ratio requires weighting enrollment and the official-age population across countries or using an official aggregate. The simple means here are descriptive summaries of country-level ratios.
Source and calculation notes
The source is World Bank World Development Indicators series SE.SEC.ENRR, based on UNESCO Institute for Statistics data. The analysis uses 208 latest non-empty observations for distribution statistics and rankings and separately summarizes the 101 observations from 2024.
All 208 country codes are matched to geographic centroids for the map, producing a 100% match. Missing economies are not zero-filled, and point sizes distinguish 2025, 2024, 2023 and older observations.
Frequently Asked Questions
Can the secondary gross enrollment ratio exceed 100%?
Yes. Gross enrollment includes students of all ages, so early entry, late entry and grade repetition can make total enrollment larger than the population of the official age group.
What is the difference between gross and net secondary enrollment?
Gross enrollment includes all enrolled students regardless of age, while net enrollment restricts the numerator to students who belong to the official secondary-school-age group.
Are all 208 observations from 2025?
No. Only nine are from 2025; 101 are from 2024, 50 from 2023, and the remaining latest observations are older.
Related Articles
Green Map creates custom-edited map images using open geographic data sources such as geoBoundaries, Natural Earth, OpenStreetMap, and government open data. These maps are edited visual materials, not raw data files, and are provided for education, documents, presentations, and graphic reference.