Advanced education does not guarantee the same labor-market outcome for women and men in every country. World Bank observations for 2023 show substantial variation in unemployment among people with advanced education, both across countries and between sexes. This comparison matches countries and economies where the female and male indicators are both available for the same year, leaving 100 paired observations for the gender-gap analysis.
The measure needs to be read carefully. It is not the share of all unemployed people who have university-level education, and it is not unemployment as a share of the total adult population. Each indicator uses the relevant labor force with advanced education as its denominator. That makes the female and male series conceptually comparable, while still requiring caution because labor-force participation, age structure, fields of study, and the size of the highly educated population differ across countries.
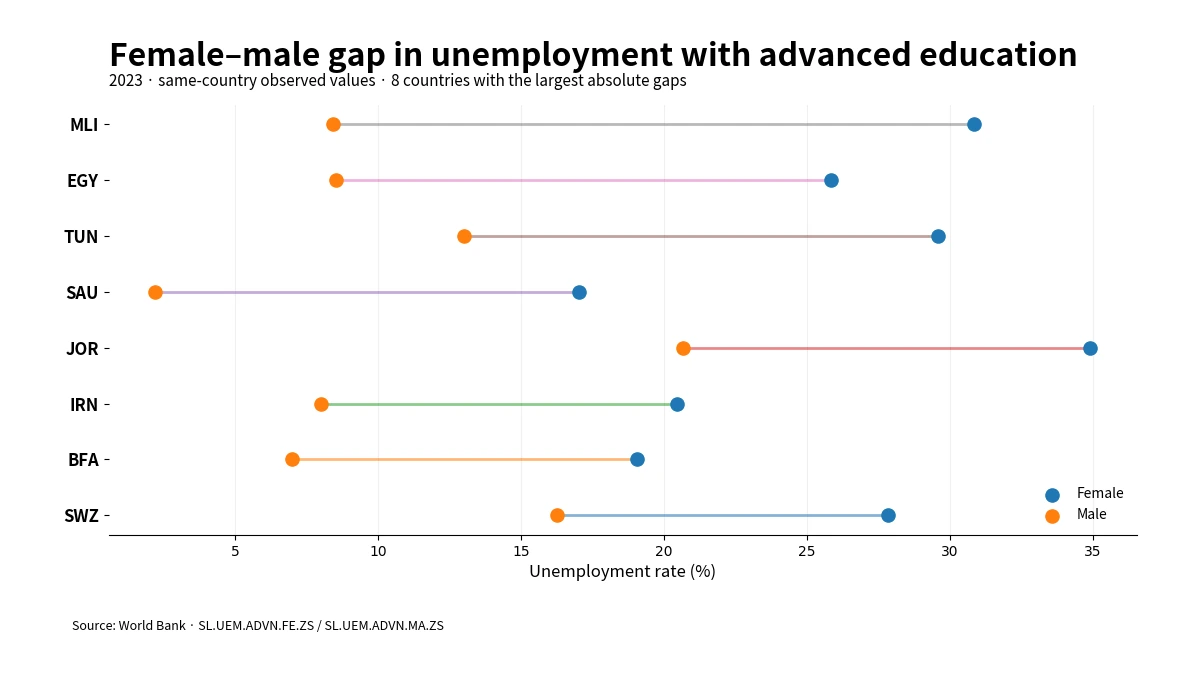
Table of Contents
What the two World Bank indicators measure
The female series has the official World Bank code SL.UEM.ADVN.FE.ZS. Its official indicator name is “Unemployment with advanced education, female (% of female labor force with advanced education).” In practical terms, it measures the percentage of women in the labor force who have advanced education and are unemployed. The male series is SL.UEM.ADVN.MA.ZS, officially named “Unemployment with advanced education, male (% of male labor force with advanced education).” It applies the same concept to men.
Under the World Bank description, advanced education includes short-cycle tertiary education, a bachelor’s degree or equivalent level, a master’s degree or equivalent level, and a doctoral degree or equivalent level under the International Standard Classification of Education 2011. Both series are percentages. A value of 10% therefore means that roughly 10 out of every 100 people in that sex-specific labor-force subgroup with advanced education are unemployed under the statistical definition used for the indicator.
For this article, 2023 is used as the common comparison year. Missing observations remain missing; they are not converted to zero or estimated. The female dataset contains values for 101 reporting countries and economies, while the male dataset contains 102. Exactly 100 have both values in 2023, and only those matched observations are used when a female-minus-male gap is calculated.
Female unemployment was higher in 74 of 100 matched observations
Among the 100 matched countries and economies, the female advanced-education unemployment rate was higher than the male rate in 74 cases. The male rate was higher in 26 cases, with no exact ties in the reported values. The simple cross-country mean was 7.46% for women and 4.83% for men, a mean difference of 2.64 percentage points. Medians were 4.48% and 3.65%, respectively.
Those averages do not imply that every country has a large difference. The mean absolute gender gap was 2.96 percentage points. A total of 18 matched observations had an absolute gap of at least 5 percentage points, while 48 had a gap below 1 percentage point. In other words, the distribution combines a number of large disparities with many countries where female and male rates sit fairly close together.
The country-level correlation between the female and male rates is approximately 0.86. That is a strong positive relationship: countries with relatively high unemployment among highly educated women also tend to report relatively high unemployment among highly educated men. However, a strong correlation in levels does not remove the gender gap. Both series can move together across countries while the distance between them remains large in specific cases.
Where the female rate was highest
Jordan recorded the highest female value in the matched 2023 dataset at 34.92%. Mali followed at 30.86%, Tunisia at 29.58%, Eswatini at 27.84%, and Egypt at 25.85%. These percentages refer only to women in the labor force with advanced education. They should not be read as unemployment rates for all women or as the percentage of the entire female population without work.
| Country/economy | Female (%) | Male (%) | Female minus male (pp) |
|---|---|---|---|
| Jordan | 34.92 | 20.65 | +14.27 |
| Mali | 30.86 | 8.41 | +22.45 |
| Tunisia | 29.58 | 13.00 | +16.58 |
| Eswatini | 27.84 | 16.27 | +11.58 |
| Egypt, Arab Rep. | 25.85 | 8.53 | +17.32 |
| Senegal | 23.14 | 15.08 | +8.06 |
| India | 20.59 | 10.84 | +9.76 |
| Iran, Islamic Rep. | 20.45 | 7.98 | +12.47 |
The table also shows why the level of unemployment and the gender gap should be treated as separate questions. Jordan has a high male rate as well, at 20.65%. Mali, in contrast, combines a female rate of 30.86% with a male rate of 8.41%, producing a much wider 22.45-point difference. Ranking countries only by the female rate would therefore miss an important part of the comparison.
The male rate was higher in a minority of countries
Although the female rate was higher in most matched observations, 26 countries and economies showed the opposite pattern. Georgia had the largest male-over-female difference: 12.30% for men versus 8.30% for women, a 4.00-point gap. Zimbabwe reported 7.08% for men and 4.80% for women, while Iceland reported 3.42% and 1.43%. Moldova also had a male rate 1.50 percentage points above the female rate.
These reverse-gap cases are important because they prevent a one-directional interpretation of the dataset. Industry mix, the timing of labor-market entry, public and private hiring, age composition, and other institutional or economic conditions may be relevant in individual countries, but this two-series dataset cannot isolate those mechanisms. It documents the size and direction of the difference in 2023; it does not establish why the difference exists.
Countries with the largest female-minus-male gaps
Mali had the largest positive gap, with the female rate 22.45 percentage points above the male rate. Egypt followed at 17.32 points, Tunisia at 16.58, Saudi Arabia at 14.83, and Jordan at 14.27. These are differences in percentage points, not relative percentage changes.
| Country/economy | Female (%) | Male (%) | Gap (pp) |
|---|---|---|---|
| Mali | 30.86 | 8.41 | +22.45 |
| Egypt, Arab Rep. | 25.85 | 8.53 | +17.32 |
| Tunisia | 29.58 | 13.00 | +16.58 |
| Saudi Arabia | 17.02 | 2.19 | +14.83 |
| Jordan | 34.92 | 20.65 | +14.27 |
| Iran, Islamic Rep. | 20.45 | 7.98 | +12.47 |
| Burkina Faso | 19.04 | 6.98 | +12.06 |
| Eswatini | 27.84 | 16.27 | +11.58 |
The percentage-point distinction matters. If the female rate is 30% and the male rate is 10%, the arithmetic difference is 20 percentage points. Saying that the female rate is “20% higher” would describe a different calculation and understate the relative difference. Country comparisons are clearer when the original rates are shown alongside a percentage-point gap.
What the comparison can and cannot tell us
These indicators are useful for identifying where unemployment among highly educated workers is elevated and where female and male outcomes diverge. They can serve as a screening measure for further labor-market analysis, particularly when combined with employment rates, labor-force participation, youth unemployment, education attainment, earnings, or occupation data. A country with high rates for both sexes raises a different analytical question from a country where the overall level is moderate but the gender gap is unusually wide.
The figures do not show that advanced education causes unemployment, nor do they measure the return to a degree. They also do not separate bachelor’s, master’s, doctoral, or short-cycle tertiary graduates, and they do not control for age, field of study, work experience, location, job-search duration, or informal employment. Because unemployment rates use the labor force as the denominator, people outside the labor force are not represented in the rate. Differences in labor-force participation can therefore coexist with similar unemployment rates, or vice versa.
The comparison is also a one-year snapshot. Business cycles, changes in graduate cohorts, migration, public-sector recruitment, and other shifts can change the observed rate from one year to the next. A trend analysis would require consistent observations across several years rather than a single common year. International comparisons should also be read with the normal caveats that accompany harmonized labor statistics and differences in national data systems.
Coverage, missing data, and a practical reading guide
The 2023 female series contains 101 non-missing country/economy observations, and the male series contains 102. The matched comparison uses 100. A country with only one sex-specific value is not used for the gap calculation, and source-missing observations are never treated as zero. The World Bank geography list also includes separately reported economies and territories, so these counts should not be interpreted as a count of sovereign states.
- SL.UEM.ADVN.FE.ZS: unemployment among the female labor force with advanced education, expressed as a percentage of that female subgroup.
- SL.UEM.ADVN.MA.ZS: unemployment among the male labor force with advanced education, expressed as a percentage of that male subgroup.
- Comparison year: 2023.
- Unit: percent for each rate; percentage points for female-minus-male gaps.
- Source: World Bank, World Development Indicators official country/economy observations.
A useful way to read the data is to look at three pieces together: the female rate, the male rate, and the gap. High values for both sexes may point to broad difficulty matching advanced skills to available jobs, whereas a large gap with only one elevated rate suggests a more sex-specific pattern that deserves separate investigation. The dataset itself does not determine the explanation, but it provides a consistent statistical starting point for asking those next questions.
Frequently Asked Questions
What do SL.UEM.ADVN.FE.ZS and SL.UEM.ADVN.MA.ZS measure?
They measure unemployment as a percentage of the female and male labor force with advanced education, respectively. Both are official World Bank indicators expressed in percent.
Was unemployment among people with advanced education higher for women or men in 2023?
Among the 100 countries and economies with both values, the female rate was higher in 74 and the male rate was higher in 26. The result describes the matched observations rather than every country in the world.
Does a large gender gap show why unemployment differs?
No. The indicators show the size and direction of the gap, but they do not isolate causes such as field of study, age, industry structure, labor-force participation, or hiring conditions.
Related Articles
Green Map creates custom-edited map images using open geographic data sources such as geoBoundaries, Natural Earth, OpenStreetMap, and government open data. These maps are edited visual materials, not raw data files, and are provided for education, documents, presentations, and graphic reference.