In 2024, the World Bank series for agricultural raw materials exports reports values for 130 countries and economies out of a 217-economy country frame. The median is only 0.86% of merchandise exports, while the mean is 2.31%. That gap is a first clue that the distribution is strongly skewed. Benin stands at 52.85%, far above Uruguay at 14.11%, Côte d’Ivoire at 13.60%, Kenya at 12.94%, and Latvia at 10.97%. One economy has a reported value of exactly 0%, which must be distinguished from a missing observation.
The indicator, TX.VAL.AGRI.ZS.UN, does not measure all agricultural exports. Its official definition is based on selected raw-material categories in SITC Revision 3 Section 2, with exclusions for oil-seeds and oleaginous fruits, certain fertilizers and minerals, and metalliferous ores and scrap. It therefore describes the share of merchandise-export value accounted for by a specific group of raw materials linked to agriculture and forestry, rather than the value of food exports, farm output, or the entire agricultural sector.
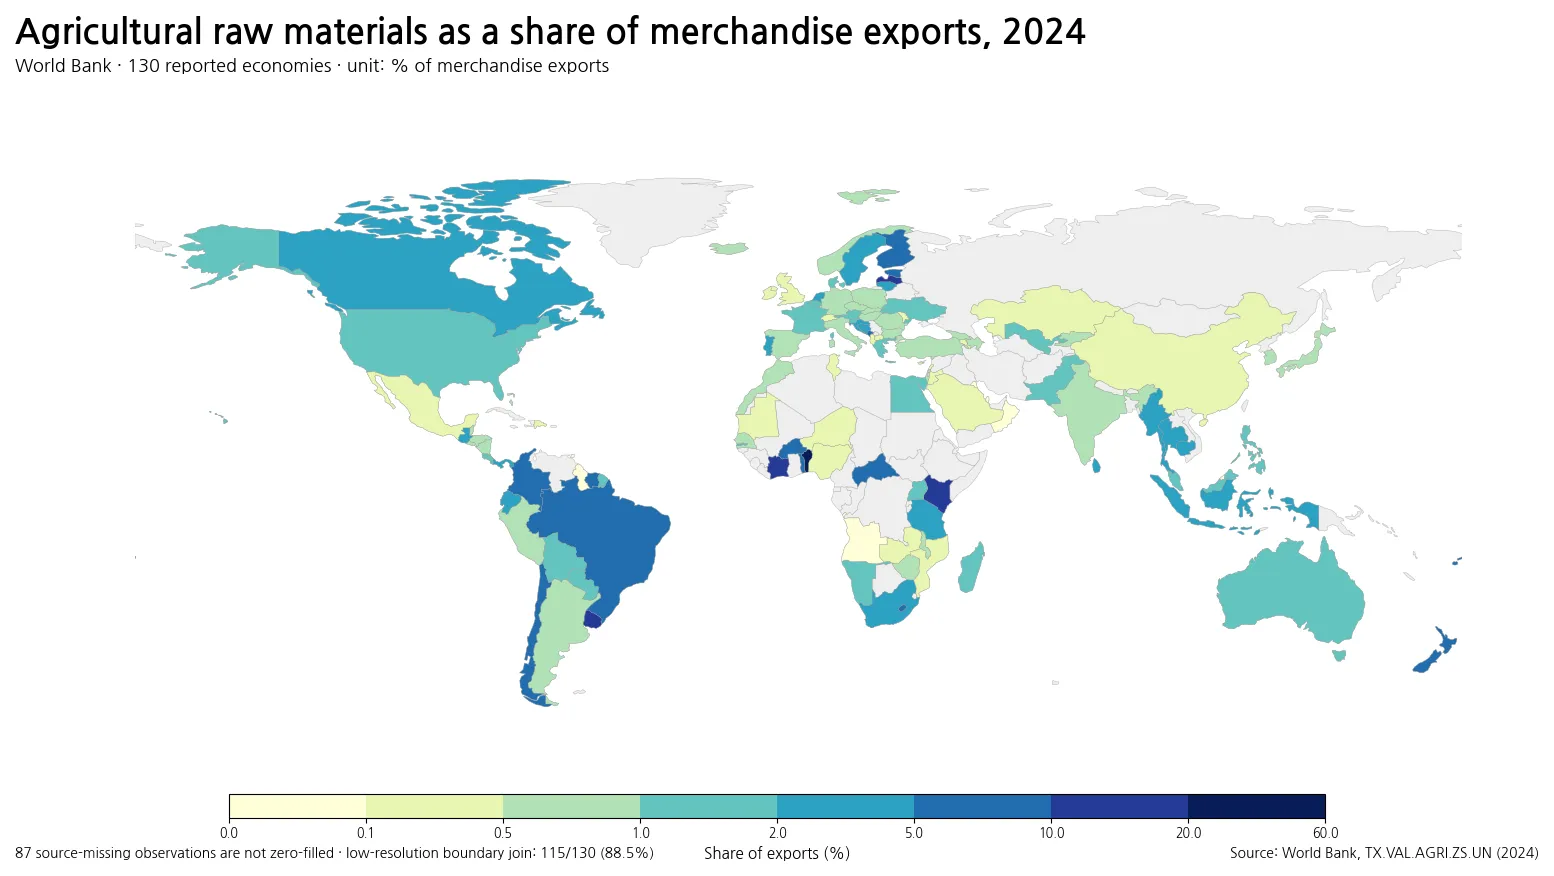
Table of Contents
Most reported economies are below 2%
The middle of the distribution is low. The first quartile is 0.40%, the median 0.86%, and the third quartile 2.37%. Half of the reported economies therefore lie between roughly 0.40% and 2.37%. Even the 90th percentile is only 5.37%. A reader who focuses only on the handful of double-digit observations would get a distorted picture of the typical export structure.
A simple banding makes the concentration clearer. Thirteen reported economies are below 0.1%, 28 fall from 0.1% to under 0.5%, and 33 are from 0.5% to under 1%. Another 21 are between 1% and 2%, 17 between 2% and 5%, and 13 between 5% and 10%. Only five reach 10% or more. In other words, more than half of the available observations are below 1%.
Benin is an extreme outlier, not a typical high value
Benin’s 52.85% is nearly 39 percentage points above Uruguay, the second-highest observation. Côte d’Ivoire, Kenya, and Latvia are also in double digits, but they are much closer to one another than any of them is to Benin. Because one value is so large, the mean of 2.31% sits well above the median of 0.86%. For understanding a typical reporting economy, the median is therefore more informative than the arithmetic average.
The ratio alone does not explain why Benin is so high. Both the numerator and denominator matter: agricultural raw-material exports can rise, but the share can still fall if other merchandise exports rise faster. The share can also increase when other exports shrink even if agricultural raw-material exports do not grow. Product-level export values and changes in total merchandise exports are needed before attributing the result to any particular crop, forestry product, policy, or market event.
| Country or economy | Agricultural raw-material export share |
|---|---|
| Benin | 52.85% |
| Uruguay | 14.11% |
| Cote d’Ivoire | 13.60% |
| Kenya | 12.94% |
| Latvia | 10.97% |
| New Zealand | 9.69% |
| Finland | 7.11% |
| Estonia | 6.55% |
| Montenegro | 6.38% |
| Burkina Faso | 6.03% |
West Africa contains both the highest value and very low shares
The West African pattern is highly uneven. Benin records 52.85% and Côte d’Ivoire 13.60%, while Burkina Faso is at 6.03% and Togo at 5.07%. The Gambia is at 1.07%, Senegal at 0.84%, Nigeria at 0.35%, and Niger at 0.25%. Geography alone clearly does not produce a common ratio. Neighboring economies can have export baskets that allocate very different shares to the raw-material categories covered by this indicator.
That contrast also cautions against treating the series as a broad measure of agricultural strength. A country may export substantial food, processed products, or other farm-related goods that fall outside the defined raw-material group. It may also have large mineral, fuel, or manufactured exports that expand the denominator. The map is best read as a picture of merchandise-export composition, not as a ranking of agricultural productivity.
South America shows a wide gap between Uruguay and its neighbors
Uruguay leads South America at 14.11%. Brazil follows at 5.65%, Chile at 5.34%, Colombia at 5.09%, and Ecuador at 3.88%. Paraguay is at 1.80%, Bolivia at 1.03%, Peru at 0.63%, and Argentina at 0.57%. This is a useful example of why a regional average can conceal large national differences in the structure of exports.
The more than 13-point gap between Uruguay and Argentina should not be converted into a judgment about which country has a larger or more competitive agricultural sector. The series covers a specific subset of raw materials and uses total merchandise exports as the denominator. Food, meat, grains, and processed agricultural products may be classified elsewhere. Absolute export values could also produce a completely different ordering.
Northern Europe and the Baltic area also produce relatively high shares
Latvia reaches 10.97%, Finland 7.11%, Estonia 6.55%, and Sweden 3.62%. The Netherlands is at 2.79%, Denmark 1.66%, Austria 1.41%, Belgium 1.21%, and France 1.02%. Germany is lower at 0.71%, Italy 0.65%, the United Kingdom 0.49%, Ireland 0.26%, and Switzerland 0.10%. These values demonstrate considerable variation even within a highly integrated trading region.
Differences in forestry products, textile raw materials, and other commodity categories may be relevant to individual countries, but this one-year ratio cannot identify a causal explanation on its own. Detailed SITC product lines are needed to see which commodities dominate the numerator. The indicator is a useful screening measure for where raw materials occupy a larger place in the export basket, not a substitute for a product-level trade profile.
New Zealand and parts of Southeast Asia are above the global median
New Zealand records 9.69%. In Southeast Asia, Thailand is at 4.00%, Indonesia 3.81%, Myanmar 3.29%, Cambodia 2.60%, Malaysia 1.25%, the Philippines 1.09%, and Singapore 0.36%. Australia is at 1.75%, India at 0.90%, Japan at 0.58%, and China at 0.34%. The range across Asia-Pacific is therefore broad, and no single regional pattern dominates.
New Zealand is another reminder that this series is not equivalent to the share of all agricultural and food exports. Processed food and other primary products may sit outside the specific SITC raw-material definition. A country can have a large agricultural export sector while posting a modest value here, or a high raw-material share without having the largest agricultural export value in dollars.
A reported 0% and a missing value are different data states
Antigua and Barbuda has a reported value of 0.00% in 2024. That is an actual numerical observation in the source. By contrast, 87 economies have no 2024 value and are preserved as missing. Replacing those missing observations with zeros would falsely claim that the relevant raw materials accounted for none of their merchandise exports.
The mean, median, quartiles, rankings, and distribution counts are therefore calculated only from the 130 reported observations. Missing areas remain unfilled on the map. The comparison is broad, but it is not a complete ranking of every economy in the world for 2024, and regional impressions should be interpreted with the available coverage in mind.
Numerical coverage is slightly wider than map coverage
The table contains 130 reported values, while the simplified Natural Earth boundary can be joined directly to 115 of them (88.5%). France and Norway require an ISO-code correction in the low-resolution boundary. Several small island and city economies—including Hong Kong, Macao, Singapore, Maldives, Bahrain, Malta, Bermuda, Barbados, Mauritius, Seychelles, Samoa, Grenada, Cayman Islands, French Polynesia, and Antigua and Barbuda—lack a practical independent polygon at this resolution.
Those observations remain in every numerical calculation even when the map cannot display them as a separate colored polygon. Likewise, an uncolored area does not necessarily represent a measured value of zero. A map is valuable for spatial context, but exact country values and data availability are best checked in the accompanying table or source data.
A high share does not identify the largest exporter in dollars
Because the indicator is a percentage, it answers a composition question: how much of each economy’s merchandise-export basket belongs to the defined agricultural raw-material group? It does not answer which economy exports the largest dollar amount of those materials. A very large exporter with a diversified export basket can have a lower percentage than a small economy whose exports are concentrated in a few raw materials.
Services are also outside the denominator. An economy with a major services-export sector may have a merchandise-export structure that represents only part of its total external sales. Comparisons of the overall export economy require broader balance-of-payments data, while this indicator is most useful for comparing the composition of merchandise trade.
The official product exclusions matter
The World Bank definition draws on SITC Revision 3 Section 2, “crude materials, inedible, except fuels,” but excludes Division 22 for oil-seeds and oleaginous fruits, Division 27 for certain crude fertilizers and minerals, and Division 28 for metalliferous ores and scrap. That makes the series narrower than everyday uses of terms such as agricultural commodities, primary products, or farm exports.
Merchandise exports themselves are defined around goods whose economic ownership changes between a resident and a non-resident, with specific exclusions or separate treatment for merchanting, non-monetary gold, and parts of travel, construction, and government goods and services. When comparing this indicator with another database, classification and denominator definitions should be checked before assuming the percentages are directly interchangeable.
The 2024 map is a snapshot, not a long-term trend
A single year is useful for cross-country comparison but cannot show whether a high or low share is persistent. Weather, harvest conditions, commodity prices, exchange rates, transport disruptions, and changes in other export sectors can all shift the numerator or denominator from one year to the next. A multi-year series is needed to distinguish a structural pattern from a temporary movement.
The clearest 2024 result is the skewness of the distribution. The median is below 1%, yet one economy exceeds 50% and four others are in double digits. Reading the map together with the quartiles and top values helps prevent the extreme observations from being mistaken for the norm.
Source and interpretation
The source is the World Bank’s World Development Indicators series TX.VAL.AGRI.ZS.UN, “Agricultural raw materials exports (% of merchandise exports).” The comparison uses 2024 country and economy observations, excluding regional and income-group aggregates. Source-missing values remain missing rather than being imputed.
The appropriate interpretation is straightforward: the percentage of each reporting economy’s merchandise-export value represented by the defined agricultural raw-material categories in 2024. It is not the agricultural sector’s share of GDP, the share of all food exports, farm production, or the absolute value of raw-material exports.
Frequently Asked Questions
Is the agricultural raw-material share the same as the share of all agricultural exports?
No. The World Bank indicator uses a specific SITC Rev.3 raw-material group with several exclusions. Food products and many other agricultural exports are outside this definition.
Do the 87 missing 2024 observations mean a 0% share?
No. They are source-missing observations. A missing value is different from the economy that actually reports 0%.
Does the highest percentage identify the largest exporter of agricultural raw materials?
Not necessarily. The indicator divides raw-material export value by each economy’s own merchandise exports. Absolute export values can produce a different ranking.
Related Articles
Green Map creates custom-edited map images using open geographic data sources such as geoBoundaries, Natural Earth, OpenStreetMap, and government open data. These maps are edited visual materials, not raw data files, and are provided for education, documents, presentations, and graphic reference.