Nuclear fuel prices in the U.S. electric power sector were reported for 28 states in 2024. In EIA State Energy Data System Table F29, Minnesota had the highest price at $0.85 per million Btu, followed by Missouri at $0.73, Louisiana at $0.69, and Kansas at $0.63. Georgia had the lowest reported positive price at $0.26/MMBtu. The median of the 28 reported state prices was $0.55 and the simple mean was about $0.573.
The other 23 jurisdictions should not be ranked at zero. EIA’s official Table F29 displays a dash for their nuclear fuel price and defines the dash as no consumption. These jurisdictions have no nuclear electric-power consumption in the table for 2024, so the zero entries in the state series are status placeholders rather than $0 market prices.
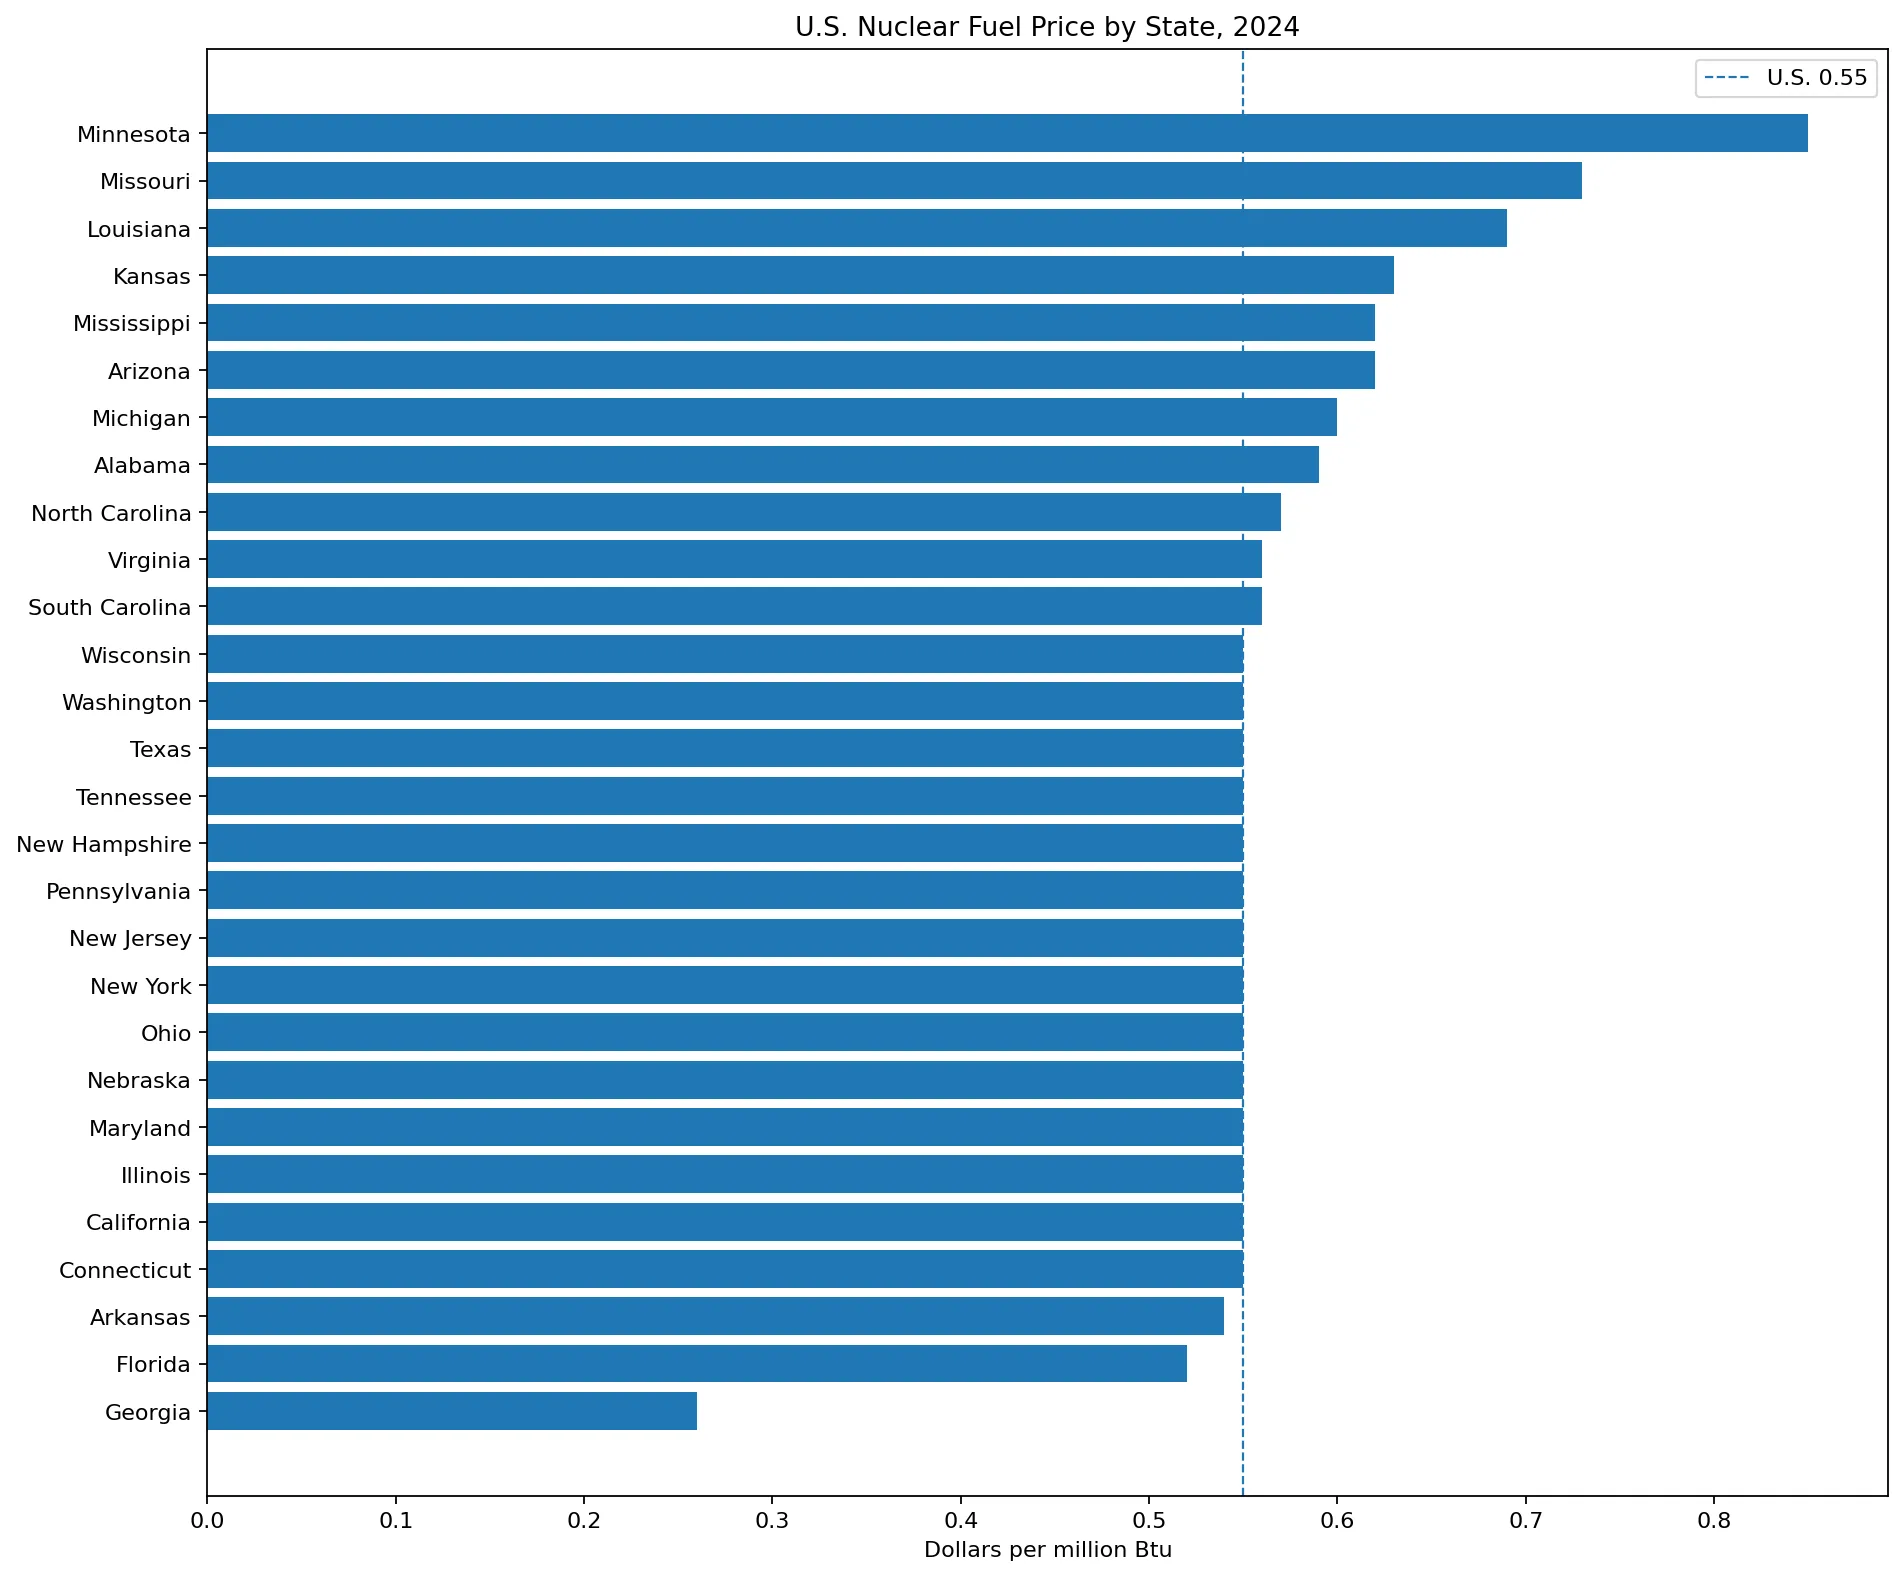
Table of Contents
What the nuclear fuel price measures
SEDS defines the series as nuclear fuel price in the electric power sector and expresses it in dollars per million Btu. The price links nuclear-fuel expenditures to the energy content attributed to nuclear electric-power consumption, allowing nuclear fuel to be placed in the same state energy price framework as coal, natural gas, petroleum, and other energy sources.
This is not the uranium spot price. The fuel cost faced by a nuclear power plant reflects a fuel cycle and procurement structure that extends beyond the market price of uranium feed material. Uranium purchase contracts, conversion, enrichment, fuel fabrication, and the timing of long-term supply arrangements can all affect the cost embedded in reactor fuel. A value such as $0.55/MMBtu therefore should not be converted into a uranium price per pound.
The series is also not a retail electricity price. Nuclear fuel is one input to power generation. Plant construction and financing, operations and maintenance, transmission, distribution, taxes, and retail rate design are separate cost elements. A state with a lower nuclear fuel price does not necessarily have lower electricity prices.
Minnesota has the highest reported price
Minnesota records $0.85/MMBtu, the highest of the 28 reported state values. Missouri follows at $0.73, Louisiana at $0.69, Kansas at $0.63, and Arizona and Mississippi at $0.62. Michigan is at $0.60, Alabama at $0.59, and North Carolina at $0.57.
Minnesota is $0.30 above the U.S. nuclear fuel price of $0.55 and about 3.27 times Georgia’s $0.26 value. The ratio looks large because the denominator is small, but the absolute difference remains less than one dollar per million Btu. Nuclear fuel prices occupy a much lower $/MMBtu range than many fossil-fuel prices, so ratios should be interpreted alongside absolute differences.
EIA states that for 2009 forward it estimates state nuclear fuel prices from plant-level fuel cost information. For states with one nuclear power plant, EIA uses the average fuel cost of reactors of the same vintage. The figures therefore represent a state-level SEDS estimation framework rather than a direct reading of a single commodity market.
Fourteen states are exactly at $0.55/MMBtu
California, Connecticut, Illinois, Maryland, Nebraska, New Hampshire, New Jersey, New York, Ohio, Pennsylvania, Tennessee, Texas, Washington, and Wisconsin are all reported at $0.55/MMBtu. That is half of the 28 states with a numerical price, and it is also the median. EIA’s U.S. value in Table F29 is $0.55/MMBtu as well.
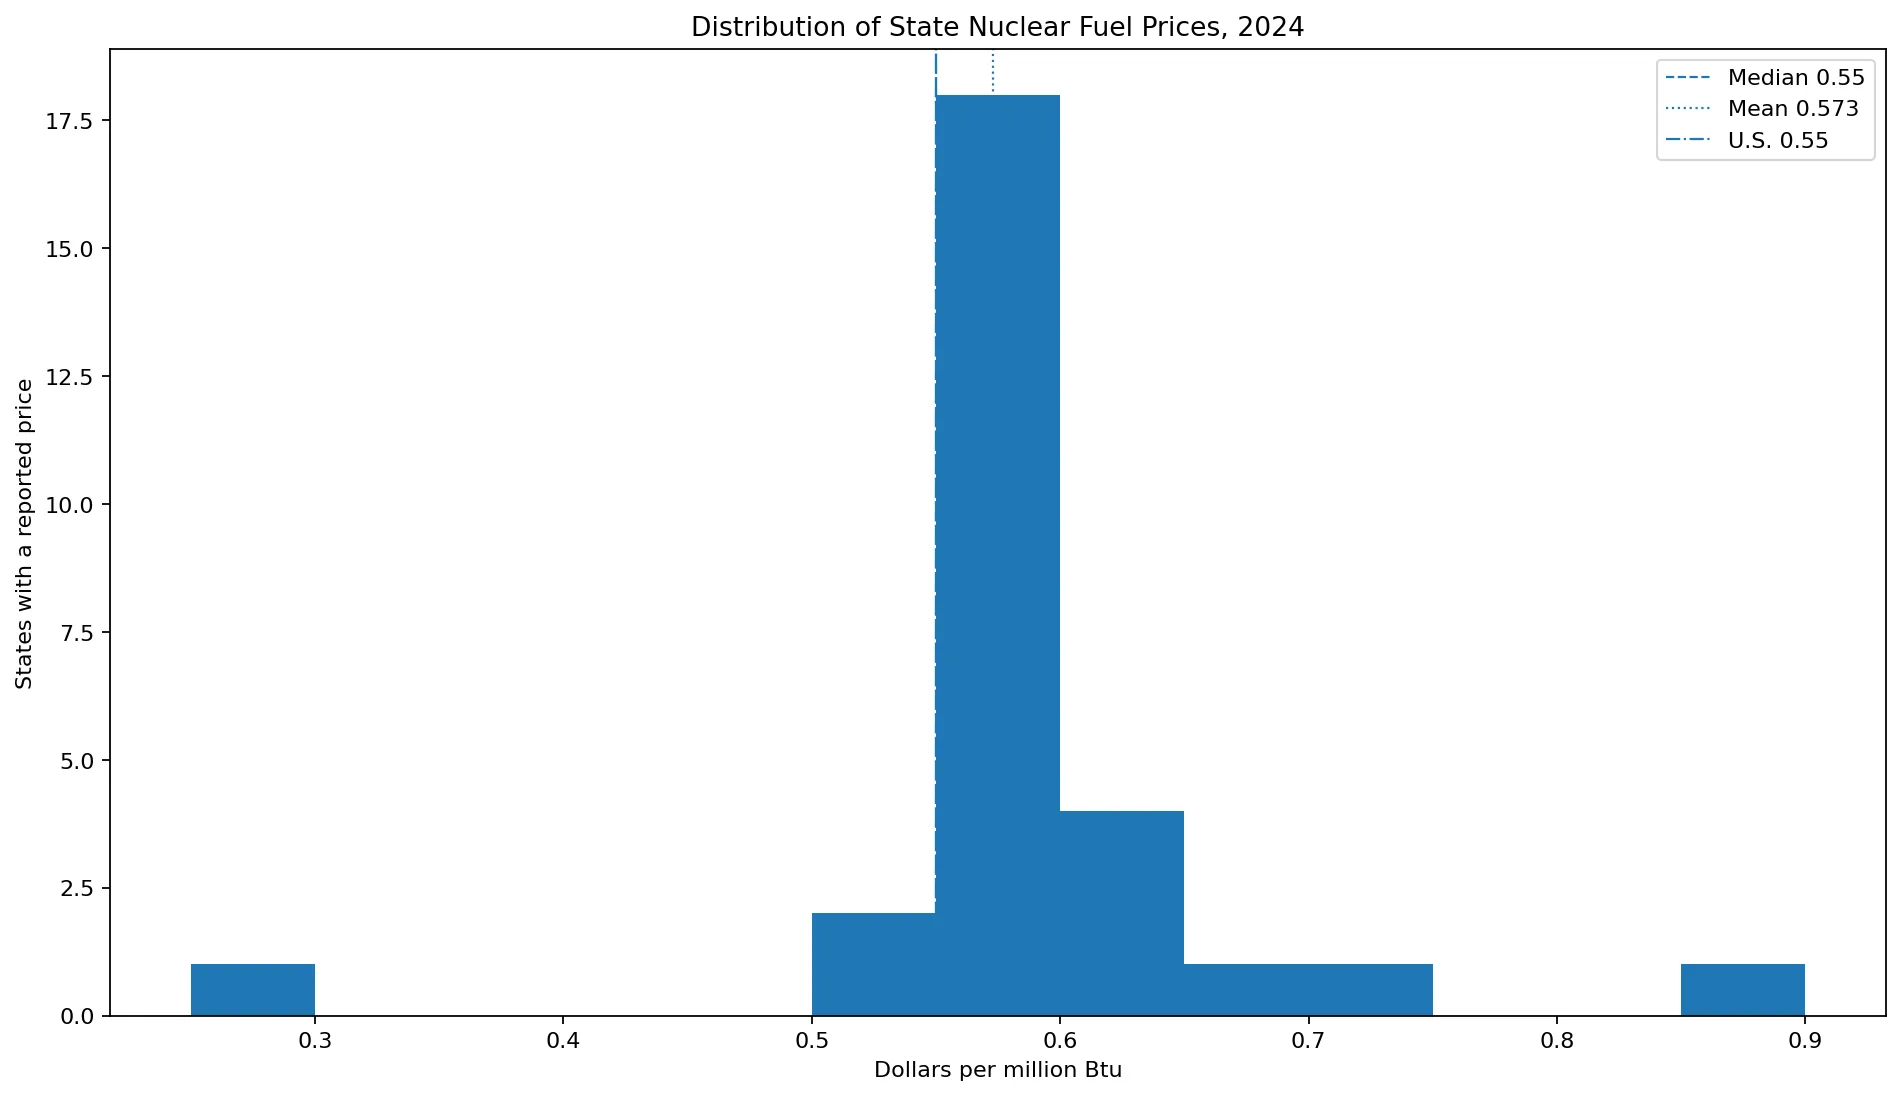
This concentration means exact ordinal rankings are not very informative through the middle of the distribution. Fourteen states are tied at the published precision. Internal estimates can differ slightly before rounding even when the public table displays the same two-decimal value, so the $0.55 group is better treated as a common price band than as fourteen separate ranks.
Just above that cluster are Virginia and South Carolina at $0.56 and North Carolina at $0.57. Arkansas is slightly below at $0.54, Florida at $0.52, and Georgia is far lower at $0.26. Most reported states therefore sit near the national value, with only a few notable deviations.
Georgia is the lowest positive observation
Georgia records $0.26/MMBtu, the lowest reported price among the 28 states. Florida is next at $0.52 and Arkansas at $0.54. Georgia stands distinctly below the main cluster and below the next-lowest state by $0.26/MMBtu.
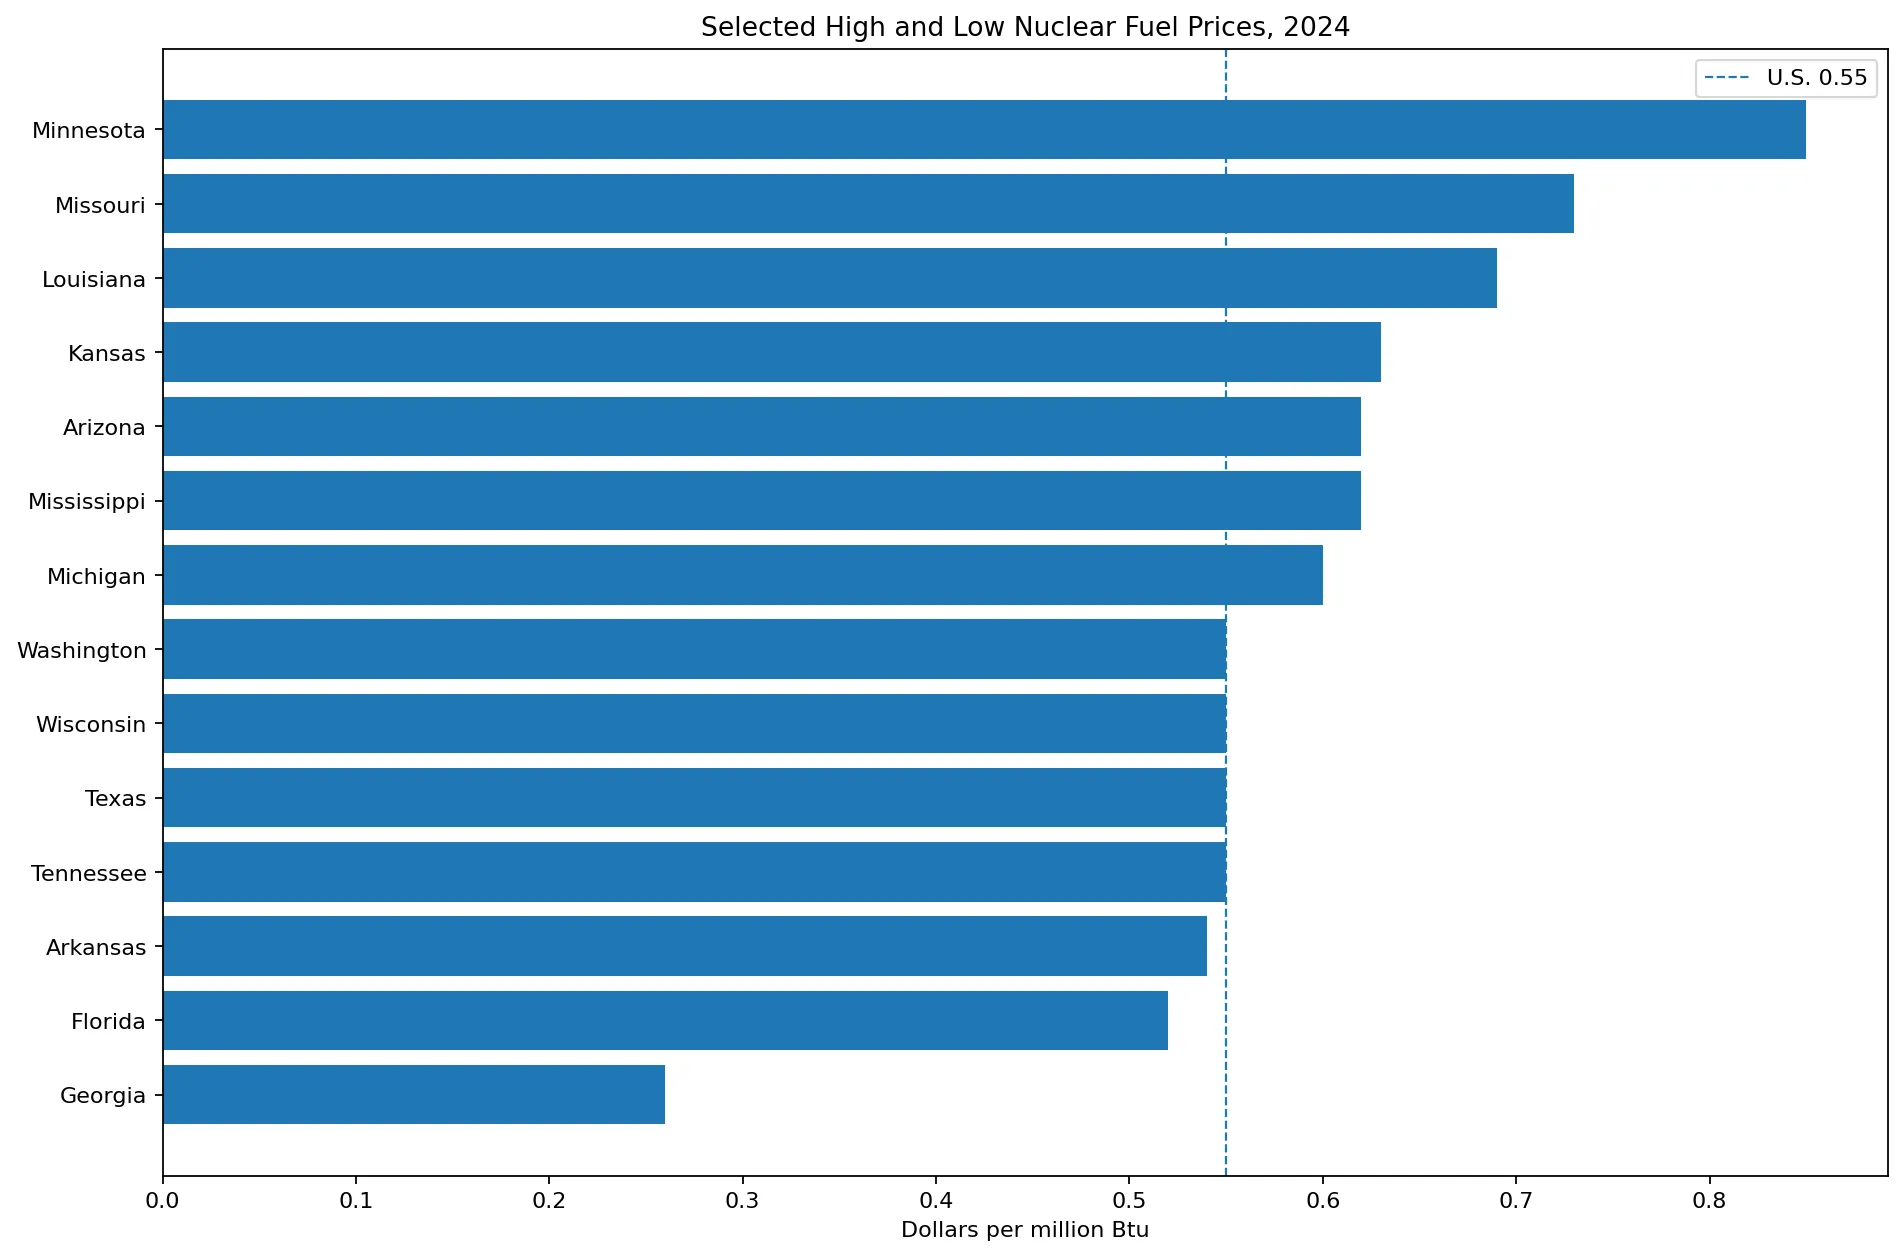
A low nuclear fuel price should not be interpreted as the lowest total cost of nuclear generation. Fuel is only one component of nuclear power costs. Capital recovery, operations and maintenance, labor, regulatory compliance, waste management, and other plant costs are outside this specific price measure.
Why 23 zero entries are not $0 nuclear fuel prices
Alaska, Colorado, Delaware, the District of Columbia, Hawaii, Idaho, Indiana, Iowa, Kentucky, Maine, Massachusetts, Montana, Nevada, New Mexico, North Dakota, Oklahoma, Oregon, Rhode Island, South Dakota, Utah, Vermont, West Virginia, and Wyoming appear as 0.00 in the state series. In EIA Table F29, however, the price entries for these jurisdictions are dashes.
The footnote to Table F29 defines the dash as no consumption. The same table shows zero nuclear electric-power consumption for these jurisdictions. They should therefore not be placed below Georgia in a price ranking. Doing so would transform the absence of nuclear generation consumption into a false zero-dollar fuel price.
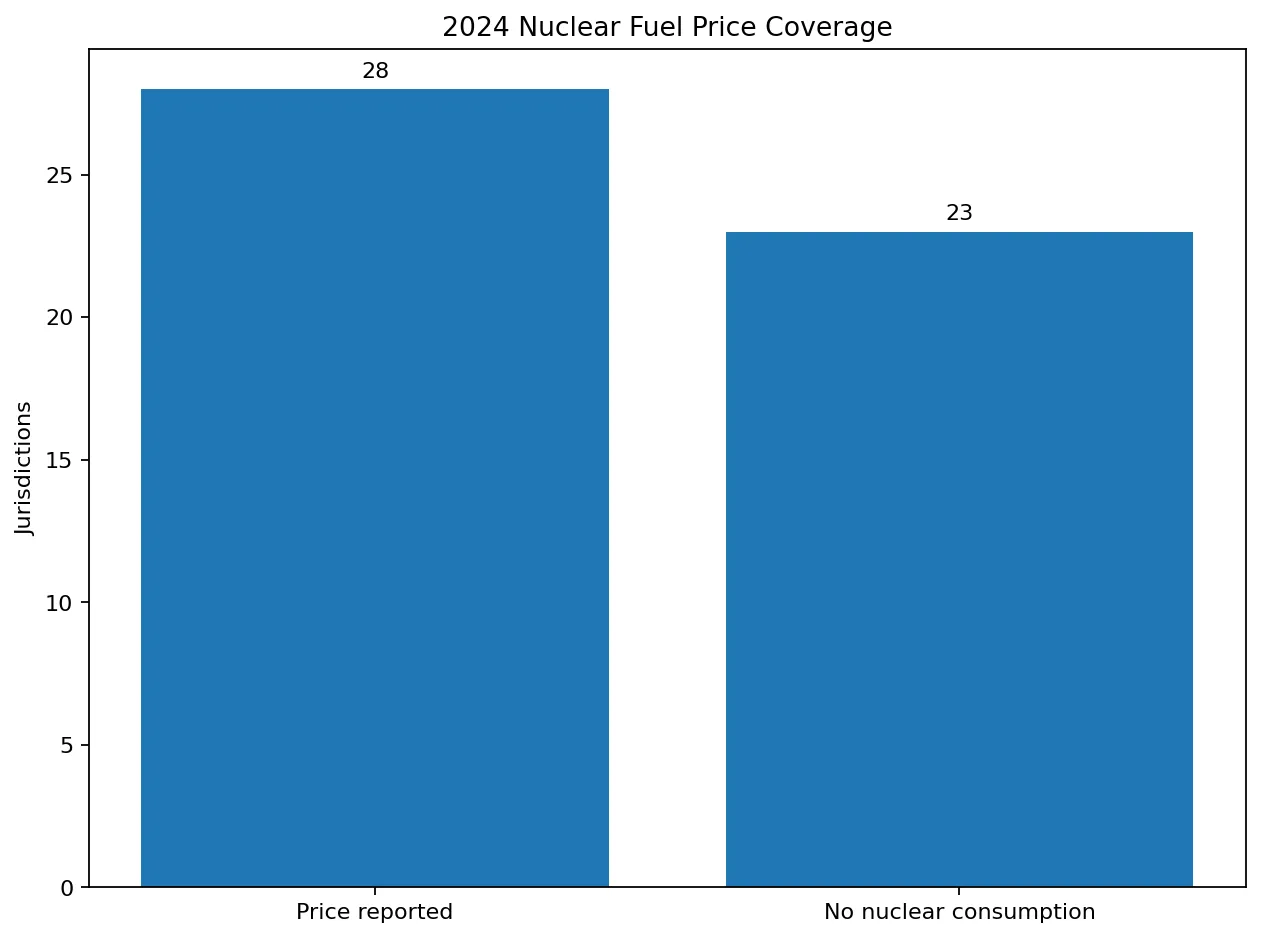
The distinction also matters for mapping. A true zero would imply an extraordinarily cheap fuel price, while no nuclear consumption means there is no comparable state price to plot. A separate no-data/no-consumption category preserves the meaning of the official table.
The U.S. nuclear fuel price is $0.55/MMBtu
EIA Table F29 reports 2024 U.S. nuclear electric-power consumption of 8165.0 trillion Btu, nuclear fuel expenditures of $4503.0 million, and a nuclear fuel price of $0.55/MMBtu. The national price is not the unweighted arithmetic mean of the reported state prices. SEDS derives the U.S. price from national expenditures and national nuclear energy consumption.
The simple mean of the 28 reported state prices is about $0.573/MMBtu, slightly above the national $0.55 value. This difference is expected because an unweighted state mean gives Minnesota, Missouri, and other states the same weight as much larger nuclear-generation states. The national figure reflects the scale of nuclear consumption and expenditures.
How EIA estimates state nuclear fuel prices
EIA’s SEDS methodology documentation states that for 2009 forward, state-level nuclear fuel prices are estimated from plant-level fuel-cost data. For a state with one nuclear power plant, the average fuel cost of reactors of the same vintage is used. In the SEDS price-and-expenditure variable definitions, NUEGD is the nuclear fuel price in the electric power sector and state values are independent state estimates.
SEDS calculates state nuclear fuel expenditures from the state’s nuclear electric-power energy consumption and state nuclear fuel price. The U.S. nuclear fuel price is then calculated from U.S. nuclear fuel expenditures divided by U.S. nuclear electric-power consumption. That accounting structure explains why a national price need not equal the simple average of state prices.
What should be compared alongside fuel price
Fuel price alone does not measure nuclear competitiveness. Table F29 also provides nuclear generation, Btu-based nuclear energy consumption, and fuel expenditures. A state can have a relatively high fuel price but limited total fuel expenditures if its nuclear generation is small. A state with a lower price can have much larger expenditures if it operates a large nuclear fleet.
For nuclear share of electricity, generation should be divided by total state generation. For total generation cost, analysts need capital and operating costs in addition to fuel. For retail electricity prices, transmission, distribution, taxes, and rate structures also matter. The nuclear fuel price series is best used for the narrower question of state-level fuel cost per unit of nuclear energy.
Official EIA references
EIA Table F29 presents 2024 nuclear generation, nuclear energy consumption, nuclear fuel prices, and expenditures by state. EIA’s SEDS methodology-change documentation describes the plant-level fuel-cost method used for state nuclear fuel prices from 2009 forward.
All 51 state jurisdictions
The table below retains the 50 states and the District of Columbia. Only the 28 states with a numerical nuclear fuel price receive a price rank. The other 23 jurisdictions are shown with a dash because EIA reports no nuclear consumption.
| Rank | State | Code | Year | $/MMBtu | Status |
|---|---|---|---|---|---|
| 1 | Minnesota | MN | 2024 | 0.85 | Price reported |
| 2 | Missouri | MO | 2024 | 0.73 | Price reported |
| 3 | Louisiana | LA | 2024 | 0.69 | Price reported |
| 4 | Kansas | KS | 2024 | 0.63 | Price reported |
| 5 | Arizona | AZ | 2024 | 0.62 | Price reported |
| 6 | Mississippi | MS | 2024 | 0.62 | Price reported |
| 7 | Michigan | MI | 2024 | 0.60 | Price reported |
| 8 | Alabama | AL | 2024 | 0.59 | Price reported |
| 9 | North Carolina | NC | 2024 | 0.57 | Price reported |
| 10 | South Carolina | SC | 2024 | 0.56 | Price reported |
| 11 | Virginia | VA | 2024 | 0.56 | Price reported |
| 12 | California | CA | 2024 | 0.55 | Price reported |
| 13 | Connecticut | CT | 2024 | 0.55 | Price reported |
| 14 | Illinois | IL | 2024 | 0.55 | Price reported |
| 15 | Maryland | MD | 2024 | 0.55 | Price reported |
| 16 | Nebraska | NE | 2024 | 0.55 | Price reported |
| 17 | New Hampshire | NH | 2024 | 0.55 | Price reported |
| 18 | New Jersey | NJ | 2024 | 0.55 | Price reported |
| 19 | New York | NY | 2024 | 0.55 | Price reported |
| 20 | Ohio | OH | 2024 | 0.55 | Price reported |
| 21 | Pennsylvania | PA | 2024 | 0.55 | Price reported |
| 22 | Tennessee | TN | 2024 | 0.55 | Price reported |
| 23 | Texas | TX | 2024 | 0.55 | Price reported |
| 24 | Washington | WA | 2024 | 0.55 | Price reported |
| 25 | Wisconsin | WI | 2024 | 0.55 | Price reported |
| 26 | Arkansas | AR | 2024 | 0.54 | Price reported |
| 27 | Florida | FL | 2024 | 0.52 | Price reported |
| 28 | Georgia | GA | 2024 | 0.26 | Price reported |
| — | Alaska | AK | 2024 | — | No nuclear consumption |
| — | Colorado | CO | 2024 | — | No nuclear consumption |
| — | Delaware | DE | 2024 | — | No nuclear consumption |
| — | District of Columbia | DC | 2024 | — | No nuclear consumption |
| — | Hawaii | HI | 2024 | — | No nuclear consumption |
| — | Idaho | ID | 2024 | — | No nuclear consumption |
| — | Indiana | IN | 2024 | — | No nuclear consumption |
| — | Iowa | IA | 2024 | — | No nuclear consumption |
| — | Kentucky | KY | 2024 | — | No nuclear consumption |
| — | Maine | ME | 2024 | — | No nuclear consumption |
| — | Massachusetts | MA | 2024 | — | No nuclear consumption |
| — | Montana | MT | 2024 | — | No nuclear consumption |
| — | Nevada | NV | 2024 | — | No nuclear consumption |
| — | New Mexico | NM | 2024 | — | No nuclear consumption |
| — | North Dakota | ND | 2024 | — | No nuclear consumption |
| — | Oklahoma | OK | 2024 | — | No nuclear consumption |
| — | Oregon | OR | 2024 | — | No nuclear consumption |
| — | Rhode Island | RI | 2024 | — | No nuclear consumption |
| — | South Dakota | SD | 2024 | — | No nuclear consumption |
| — | Utah | UT | 2024 | — | No nuclear consumption |
| — | Vermont | VT | 2024 | — | No nuclear consumption |
| — | West Virginia | WV | 2024 | — | No nuclear consumption |
| — | Wyoming | WY | 2024 | — | No nuclear consumption |
Frequently Asked Questions
Which state had the highest nuclear fuel price in 2024?
Minnesota was highest at $0.85/MMBtu, followed by Missouri at $0.73 and Louisiana at $0.69.
Do the 23 zero entries mean nuclear fuel was free?
No. EIA Table F29 displays dashes for those jurisdictions and defines the dash as no nuclear consumption.
What was the U.S. nuclear fuel price in 2024?
EIA Table F29 reports a U.S. nuclear fuel price of $0.55 per million Btu.
Is the nuclear fuel price the same as the uranium spot price?
No. The SEDS measure reflects nuclear power plant fuel cost per unit of nuclear energy, not simply the commodity price of uranium feed material.
Related Articles
Green Map creates custom-edited map images using open geographic data sources such as geoBoundaries, Natural Earth, OpenStreetMap, and government open data. These maps are edited visual materials, not raw data files, and are provided for education, documents, presentations, and graphic reference.