Children out of school at primary age are the share of children in the official primary-school-age group who are not enrolled in primary or secondary school. The World Bank series contains 205 latest non-empty observations, but the years range from 1980 to 2025. Only 12 observations are dated 2025, while 109 are from 2024, so the broad comparison is centered on the much larger 2024 same-year group.
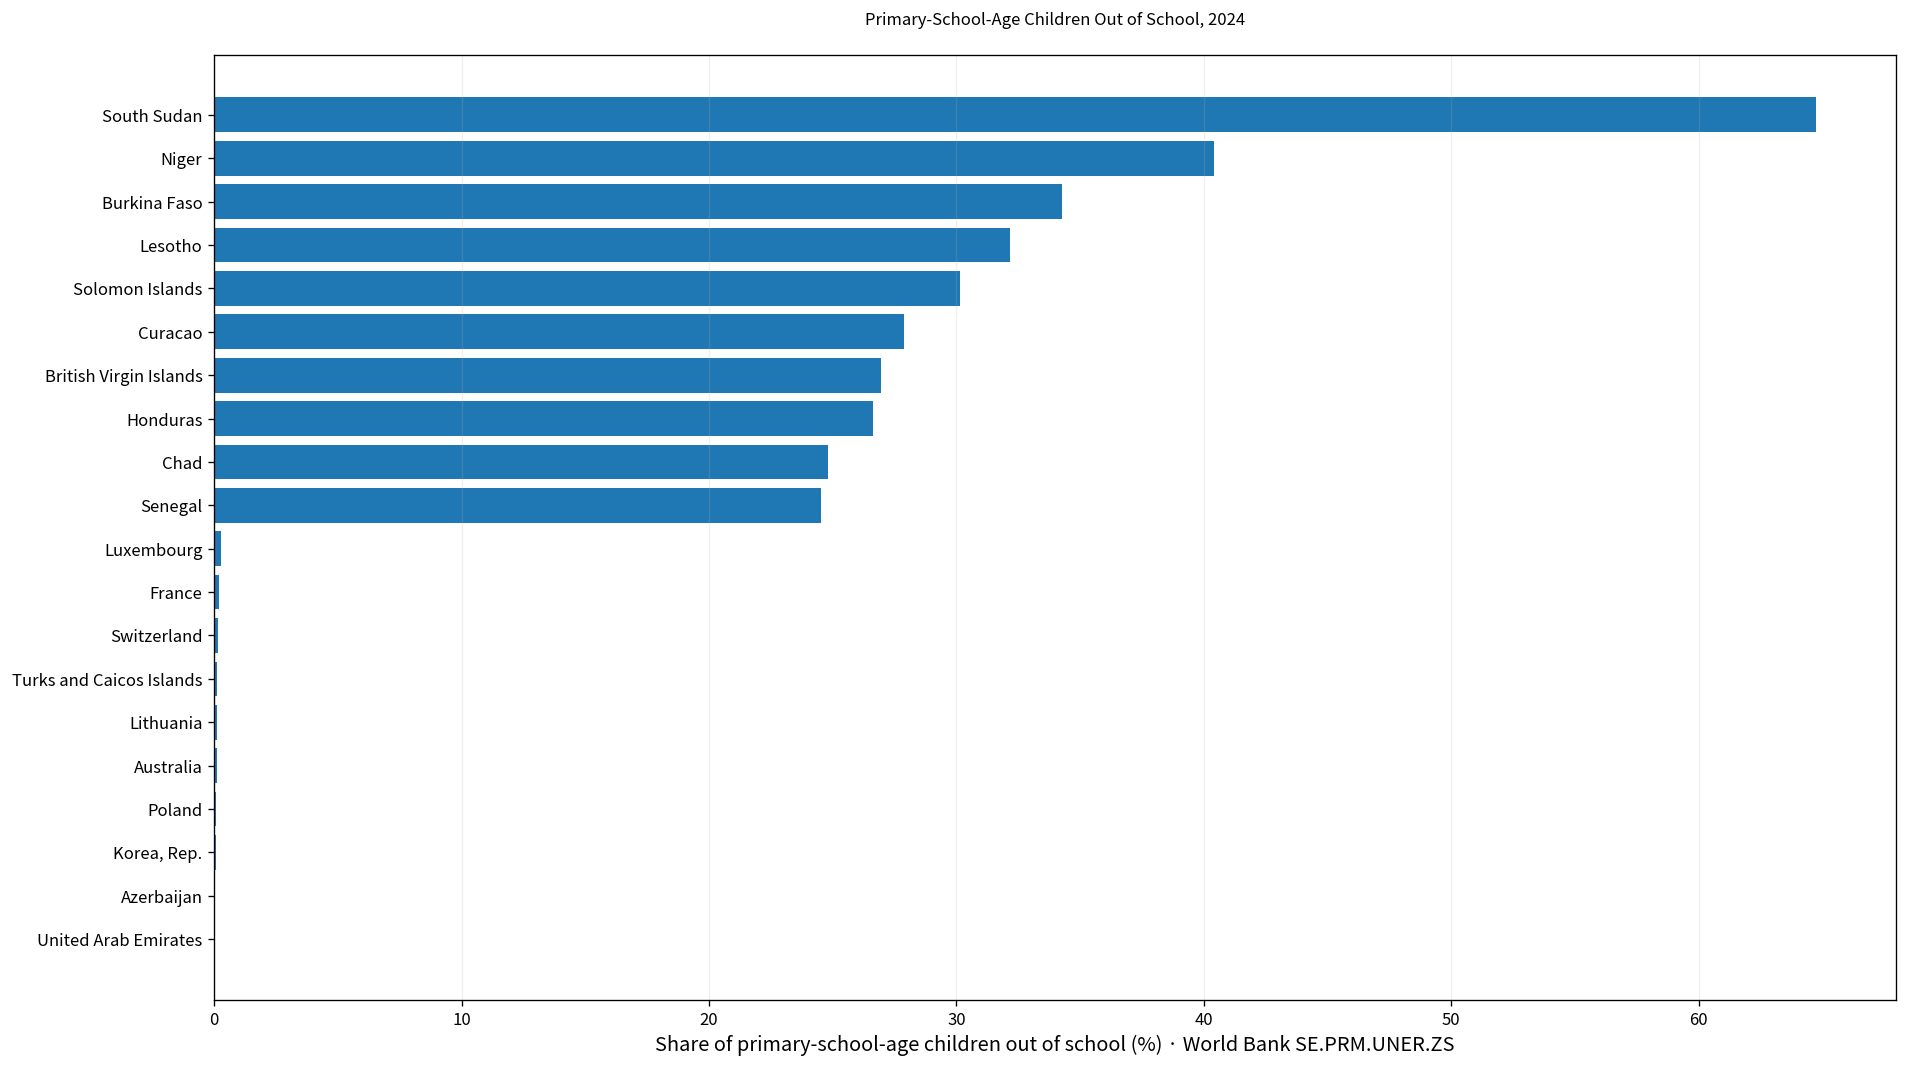
Table of Contents
What the primary-age out-of-school rate measures
World Bank documentation defines children out of school as the percentage of primary-school-age children who are not enrolled in either primary or secondary school. A child in the official primary-age group who is still enrolled in preprimary education is counted as out of school for this indicator.
The measure is useful for tracking access to primary-level schooling, but it does not directly measure attendance, persistence, learning outcomes, or education quality. A child can be formally enrolled yet attend irregularly, and a low out-of-school rate does not automatically imply high learning achievement.
The 205 latest observations span 1980 to 2025
Among the 205 latest observations, 109 are from 2024, 40 from 2023, 13 from 2022, and only 12 from 2025. Smaller groups come from earlier years, including a few observations from the 1980s and 1990s.
| Observation year | Economies/territories | Share of 205 |
|---|---|---|
| 2025 | 12 | 5.9% |
| 2024 | 109 | 53.2% |
| 2023 | 40 | 19.5% |
| 2022 | 13 | 6.3% |
| 2021 | 3 | 1.5% |
| 2020 | 1 | 0.5% |
| 2019 | 3 | 1.5% |
| 2017 | 3 | 1.5% |
| 2016 | 2 | 1.0% |
| 2015 | 2 | 1.0% |
| 2014 | 1 | 0.5% |
| 2013 | 1 | 0.5% |
| 2012 | 2 | 1.0% |
| 2010 | 2 | 1.0% |
| 2009 | 1 | 0.5% |
| 2008 | 1 | 0.5% |
| 2007 | 1 | 0.5% |
| 1999 | 1 | 0.5% |
| 1997 | 2 | 1.0% |
| 1996 | 1 | 0.5% |
| 1993 | 1 | 0.5% |
| 1991 | 1 | 0.5% |
| 1983 | 1 | 0.5% |
| 1980 | 1 | 0.5% |
The mixed-year collection has a mean of 9.58% and a median of 3.98%, with values ranging from 0.00% to 85.27%. Because the observations come from different periods, these figures should not be presented as a current global out-of-school average.
The 2024 mean is 8.16% and the median is 4.34%
The 2024 same-year subset contains 109 economies. The mean is 8.16% and the median 4.34%. The first quartile is 1.38% and the third quartile 10.79%, so the middle half lies roughly between 1.4% and 10.8%.
23 observations are below 1% and 63 are below 5%. At the other end, 31 are at least 10%, 15 are at least 20%, 5 are at least 30%, and 1 exceeds 50%. The spread across economies is therefore very wide.
South Sudan is highest in 2024 at 64.73%
South Sudan records 64.73%, followed by Niger at 40.41%, Burkina Faso at 34.29%, Lesotho at 32.17%, and Solomon Islands at 30.14%. Curacao, British Virgin Islands, Honduras, Chad, and Senegal are also among the higher 2024 observations.
| 2024 rank | Economy/territory | Primary-age out-of-school rate |
|---|---|---|
| 1 | South Sudan | 64.73% |
| 2 | Niger | 40.41% |
| 3 | Burkina Faso | 34.29% |
| 4 | Lesotho | 32.17% |
| 5 | Solomon Islands | 30.14% |
| 6 | Curacao | 27.89% |
| 7 | British Virgin Islands | 26.97% |
| 8 | Honduras | 26.62% |
| 9 | Chad | 24.80% |
| 10 | Senegal | 24.53% |
| 11 | Micronesia, Fed. Sts. | 23.06% |
| 12 | Lebanon | 22.51% |
| 13 | Ethiopia | 22.46% |
| 14 | Syrian Arab Republic | 21.81% |
| 15 | Comoros | 20.65% |
A high rate means a large share of children in the official primary-age group are not enrolled in primary or secondary school. The indicator does not identify a single cause. School availability, household resources, conflict and displacement, gender or regional gaps, education-system structure, and statistical coverage can all matter.
Twenty-three 2024 observations are below 1%
The United Arab Emirates is lowest at 0.0039%, followed by Azerbaijan at 0.0266%, Korea, Rep. at 0.0557%, Poland at 0.0917%, Australia at 0.1243%, Lithuania at 0.1297%, Turks and Caicos Islands at 0.1334%, Switzerland at 0.1430%, France at 0.2044%, and Luxembourg at 0.2564%.
| Low-order position in 2024 | Economy/territory | Primary-age out-of-school rate |
|---|---|---|
| 1 | United Arab Emirates | 0.00% |
| 2 | Azerbaijan | 0.03% |
| 3 | Korea, Rep. | 0.06% |
| 4 | Poland | 0.09% |
| 5 | Australia | 0.12% |
| 6 | Lithuania | 0.13% |
| 7 | Turks and Caicos Islands | 0.13% |
| 8 | Switzerland | 0.14% |
| 9 | France | 0.20% |
| 10 | Luxembourg | 0.26% |
| 11 | Germany | 0.27% |
| 12 | Mexico | 0.36% |
| 13 | Moldova | 0.46% |
| 14 | Albania | 0.49% |
| 15 | Saudi Arabia | 0.53% |
A rate below 1% suggests that nearly all children in the official primary-age group are enrolled in primary or secondary education. It does not show whether attendance is regular, whether students stay through later grades, or whether learning outcomes are strong.
The 12 observations from 2025 are useful but not globally representative
Only 12 economies have a latest observation dated 2025. Their mean is 6.33% and median 2.26%. Burundi is highest at 26.47%, followed by Gambia, The at 16.91% and Lao PDR at 10.36%.
At the lower end, India records 0.12%, Uzbekistan 0.66%, Nepal 0.76%, Thailand 0.82%, and Indonesia 0.88%. These are current observations for those economies, but a 12-economy group should not be treated as a representative global distribution.
A low rate and a high rate do not answer every education question
A low out-of-school rate indicates broad enrollment coverage for children of official primary age. It does not tell us how often those children attend, whether they repeat grades, whether they complete primary school, or what they learn.
A high rate clearly signals a large enrollment gap, but understanding why requires more detailed evidence by sex, household income, location, disability, conflict or displacement status, school supply, and education costs.
Primary-age children in preprimary education still count as out of school
An important part of the definition is that a child who is old enough for primary school but is enrolled only in preprimary education is counted as out of school. The measure therefore focuses on enrollment at the expected primary or secondary level rather than attendance in any educational setting.
This matters for international comparison because official school-entry ages and education structures differ. In systems with delayed entry, some children can be in an educational program but still fall into the out-of-school category for this indicator.
The out-of-school rate complements enrollment and persistence measures
The out-of-school rate looks directly at the share of official primary-age children outside primary or secondary enrollment. Net enrollment or adjusted net enrollment measures the enrolled side of access. The concepts are closely related, but details can differ depending on the level included and the denominator definition.
A fuller education picture also needs completion rates, persistence to grade 5, dropout, teacher availability, and learning outcomes. Access, persistence, completion, and learning are separate dimensions.
Complete list of the 205 latest observations
The table below lists the latest non-empty observation for each economy and territory in alphabetical order. Rows not dated 2024 retain their original observation year. For a strict same-year comparison, use only the 2024 observations.
| Economy/territory | Observation year | Primary-age out-of-school rate |
|---|---|---|
| Afghanistan | 1993 | 68.77% |
| Albania | 2024 | 0.49% |
| Algeria | 2025 | 1.57% |
| Andorra | 2024 | 2.41% |
| Angola | 2023 | 36.76% |
| Antigua and Barbuda | 2023 | 1.71% |
| Argentina | 2023 | 0.73% |
| Armenia | 2024 | 1.08% |
| Aruba | 2014 | 1.76% |
| Australia | 2024 | 0.12% |
| Austria | 2024 | 1.43% |
| Azerbaijan | 2024 | 0.03% |
| Bahamas, The | 2024 | 15.88% |
| Bahrain | 2024 | 4.75% |
| Bangladesh | 2024 | 5.86% |
| Barbados | 2024 | 17.60% |
| Belarus | 2024 | 4.49% |
| Belgium | 2023 | 1.66% |
| Belize | 2024 | 10.68% |
| Benin | 2022 | 9.61% |
| Bermuda | 2012 | 3.41% |
| Bhutan | 2024 | 10.50% |
| Bolivia | 2024 | 9.25% |
| Bosnia and Herzegovina | 2023 | 2.10% |
| Botswana | 2022 | 0.54% |
| Brazil | 2024 | 2.19% |
| British Virgin Islands | 2024 | 26.97% |
| Brunei Darussalam | 2024 | 3.61% |
| Bulgaria | 2024 | 5.90% |
| Burkina Faso | 2024 | 34.29% |
| Burundi | 2025 | 26.47% |
| Cabo Verde | 2022 | 41.84% |
| Cambodia | 2024 | 3.69% |
| Cameroon | 2024 | 3.76% |
| Canada | 2023 | 4.99% |
| Cayman Islands | 2024 | 5.17% |
| Central African Republic | 2012 | 37.89% |
| Chad | 2024 | 24.80% |
| Chile | 2024 | 2.12% |
| China | 1997 | 6.68% |
| Colombia | 2022 | 7.32% |
| Comoros | 2024 | 20.65% |
| Congo, Dem. Rep. | 1999 | 65.35% |
| Congo, Rep. | 2023 | 17.08% |
| Costa Rica | 2024 | 4.49% |
| Cote d’Ivoire | 2024 | 12.60% |
| Croatia | 2023 | 1.81% |
| Cuba | 2024 | 4.68% |
| Curacao | 2024 | 27.89% |
| Cyprus | 2023 | 0.43% |
| Czechia | 2023 | 0.81% |
| Denmark | 2024 | 0.89% |
| Dominica | 2023 | 3.95% |
| Dominican Republic | 2024 | 4.93% |
| Ecuador | 2023 | 4.72% |
| Egypt, Arab Rep. | 2024 | 3.51% |
| El Salvador | 2024 | 8.66% |
| Equatorial Guinea | 2015 | 65.60% |
| Eritrea | 2022 | 40.38% |
| Estonia | 2024 | 3.39% |
| Eswatini | 2022 | 3.83% |
| Ethiopia | 2024 | 22.46% |
| Fiji | 2024 | 2.39% |
| Finland | 2024 | 1.77% |
| France | 2024 | 0.20% |
| French Polynesia | 1996 | 4.06% |
| Gabon | 2019 | 28.76% |
| Gambia, The | 2025 | 16.91% |
| Georgia | 2024 | 6.17% |
| Germany | 2024 | 0.27% |
| Ghana | 2024 | 4.77% |
| Gibraltar | 2024 | 1.58% |
| Greece | 2023 | 0.11% |
| Grenada | 2024 | 4.94% |
| Guatemala | 2024 | 8.43% |
| Guinea | 2020 | 14.73% |
| Guinea-Bissau | 2010 | 30.55% |
| Guyana | 2023 | 17.98% |
| Haiti | 1997 | 39.79% |
| Honduras | 2024 | 26.62% |
| Hong Kong SAR, China | 2024 | 1.40% |
| Hungary | 2024 | 2.81% |
| Iceland | 2023 | 1.82% |
| India | 2025 | 0.12% |
| Indonesia | 2025 | 0.88% |
| Iran, Islamic Rep. | 2023 | 0.10% |
| Iraq | 2007 | 10.72% |
| Ireland | 2022 | 1.81% |
| Israel | 2024 | 2.66% |
| Italy | 2023 | 2.06% |
| Jamaica | 2024 | 4.34% |
| Japan | 2023 | 0.07% |
| Jordan | 2024 | 1.89% |
| Kazakhstan | 2025 | 7.91% |
| Kenya | 2022 | 32.90% |
| Kiribati | 2024 | 8.71% |
| Korea, Dem. People’s Rep. | 2009 | 0.51% |
| Korea, Rep. | 2024 | 0.06% |
| Kuwait | 2016 | 7.47% |
| Kyrgyz Republic | 2025 | 2.96% |
| Lao PDR | 2025 | 10.36% |
| Latvia | 2024 | 2.74% |
| Lebanon | 2024 | 22.51% |
| Lesotho | 2024 | 32.17% |
| Liberia | 2022 | 38.25% |
| Libya | 1983 | 4.54% |
| Liechtenstein | 2021 | 0.82% |
| Lithuania | 2024 | 0.13% |
| Luxembourg | 2024 | 0.26% |
| Macao SAR, China | 2024 | 10.79% |
| Madagascar | 2024 | 3.40% |
| Malawi | 2022 | 2.09% |
| Malaysia | 2024 | 11.97% |
| Maldives | 2024 | 0.95% |
| Mali | 2023 | 34.01% |
| Malta | 2023 | 2.64% |
| Marshall Islands | 2024 | 1.48% |
| Mauritania | 2024 | 11.26% |
| Mauritius | 2024 | 0.79% |
| Mexico | 2024 | 0.36% |
| Micronesia, Fed. Sts. | 2024 | 23.06% |
| Moldova | 2024 | 0.46% |
| Mongolia | 2024 | 8.56% |
| Montenegro | 2023 | 0.22% |
| Morocco | 2021 | 0.47% |
| Mozambique | 2022 | 1.00% |
| Myanmar | 2010 | 1.41% |
| Namibia | 2024 | 0.87% |
| Naoero | 2025 | 6.60% |
| Nepal | 2025 | 0.76% |
| Netherlands | 2023 | 0.52% |
| New Caledonia | 1991 | 7.42% |
| New Zealand | 2024 | 2.62% |
| Nicaragua | 2023 | 6.66% |
| Niger | 2024 | 40.41% |
| Nigeria | 2023 | 24.32% |
| North Macedonia | 2023 | 3.79% |
| Norway | 2024 | 1.38% |
| Oman | 2024 | 5.76% |
| Pakistan | 2024 | 17.93% |
| Palau | 2024 | 1.33% |
| Panama | 2024 | 7.70% |
| Papua New Guinea | 2021 | 4.00% |
| Paraguay | 2024 | 13.33% |
| Peru | 2019 | 0.16% |
| Philippines | 2024 | 11.64% |
| Poland | 2024 | 0.09% |
| Portugal | 2023 | 0.51% |
| Puerto Rico (US) | 2024 | 13.25% |
| Qatar | 2024 | 4.62% |
| Romania | 2023 | 15.59% |
| Russian Federation | 2023 | 4.94% |
| Rwanda | 2024 | 0.97% |
| Samoa | 2024 | 1.81% |
| San Marino | 2024 | 6.13% |
| Sao Tome and Principe | 2017 | 2.88% |
| Saudi Arabia | 2024 | 0.53% |
| Senegal | 2024 | 24.53% |
| Serbia | 2024 | 3.33% |
| Seychelles | 2024 | 6.80% |
| Sierra Leone | 2015 | 0.89% |
| Singapore | 2023 | 0.21% |
| Sint Maarten (Dutch part) | 2023 | 6.78% |
| Slovak Republic | 2024 | 1.06% |
| Slovenia | 2023 | 1.45% |
| Solomon Islands | 2024 | 30.14% |
| Somalia, Fed. Rep. | 1980 | 85.27% |
| South Africa | 2023 | 6.06% |
| South Sudan | 2024 | 64.73% |
| Spain | 2024 | 1.24% |
| Sri Lanka | 2023 | 9.14% |
| St. Kitts and Nevis | 2008 | 0.86% |
| St. Lucia | 2024 | 7.01% |
| St. Vincent and the Grenadines | 2017 | 0.59% |
| Sudan | 2019 | 43.84% |
| Suriname | 2024 | 16.22% |
| Sweden | 2024 | 0.57% |
| Switzerland | 2024 | 0.14% |
| Syrian Arab Republic | 2024 | 21.81% |
| Tajikistan | 2017 | 4.15% |
| Tanzania | 2024 | 16.37% |
| Thailand | 2025 | 0.82% |
| Timor-Leste | 2023 | 6.88% |
| Togo | 2024 | 0.64% |
| Tonga | 2022 | 2.28% |
| Trinidad and Tobago | 2024 | 7.16% |
| Tunisia | 2023 | 1.09% |
| Turkiye | 2023 | 0.60% |
| Turkmenistan | 2024 | 4.31% |
| Turks and Caicos Islands | 2024 | 0.13% |
| Tuvalu | 2024 | 0.54% |
| Uganda | 2013 | 4.12% |
| Ukraine | 2024 | 12.93% |
| United Arab Emirates | 2024 | 0.00% |
| United Kingdom | 2023 | 0.07% |
| United States | 2022 | 3.98% |
| Uruguay | 2023 | 0.04% |
| Uzbekistan | 2025 | 0.66% |
| Vanuatu | 2024 | 2.53% |
| Venezuela, RB | 2023 | 0.55% |
| Viet Nam | 2024 | 1.73% |
| West Bank and Gaza | 2023 | 9.56% |
| Yemen, Rep. | 2016 | 30.62% |
| Zambia | 2024 | 3.51% |
| Zimbabwe | 2024 | 10.52% |
How to interpret the comparison
First, the 205 latest observations do not share one year. Second, only 12 are from 2025, so the latest-value set is not a 2025 global ranking. Third, this indicator measures enrollment status rather than attendance, persistence, or learning. Fourth, primary-age children who remain in preprimary education are counted as out of school.
Education systems and update schedules differ across economies, so older latest values may not describe current conditions. Country-level analysis should check the newest World Bank series alongside official national education statistics.
Source and calculation
The source is World Bank World Development Indicators SE.PRM.UNER.ZS, Children out of school (% of primary school age). The 2024 mean, median, quartiles, threshold counts, and rankings are calculated from the 109 observations dated 2024.
Frequently Asked Questions
Who counts as a primary-school-age child out of school?
A child of official primary-school age who is not enrolled in primary or secondary school. Children of primary age who remain only in preprimary education are also counted as out of school.
What is the 2024 median?
The median across the 109 observations dated 2024 is 4.34%, while the mean is 8.16%.
Can the 12 observations from 2025 be treated as a global ranking?
No. Twelve economies are too few to represent the global distribution and should be kept separate from the larger 2024 same-year group.
Related Articles
Green Map creates custom-edited map images using open geographic data sources such as geoBoundaries, Natural Earth, OpenStreetMap, and government open data. These maps are edited visual materials, not raw data files, and are provided for education, documents, presentations, and graphic reference.