The applied simple-mean tariff on manufactured products is the unweighted average of tariff rates actually applied across manufactured-product tariff lines. The World Bank series contains 188 latest non-empty observations, of which 143 are dated 2022. Because the remainder are from earlier years, the complete latest-value list is separated from the 2022 same-year comparison.
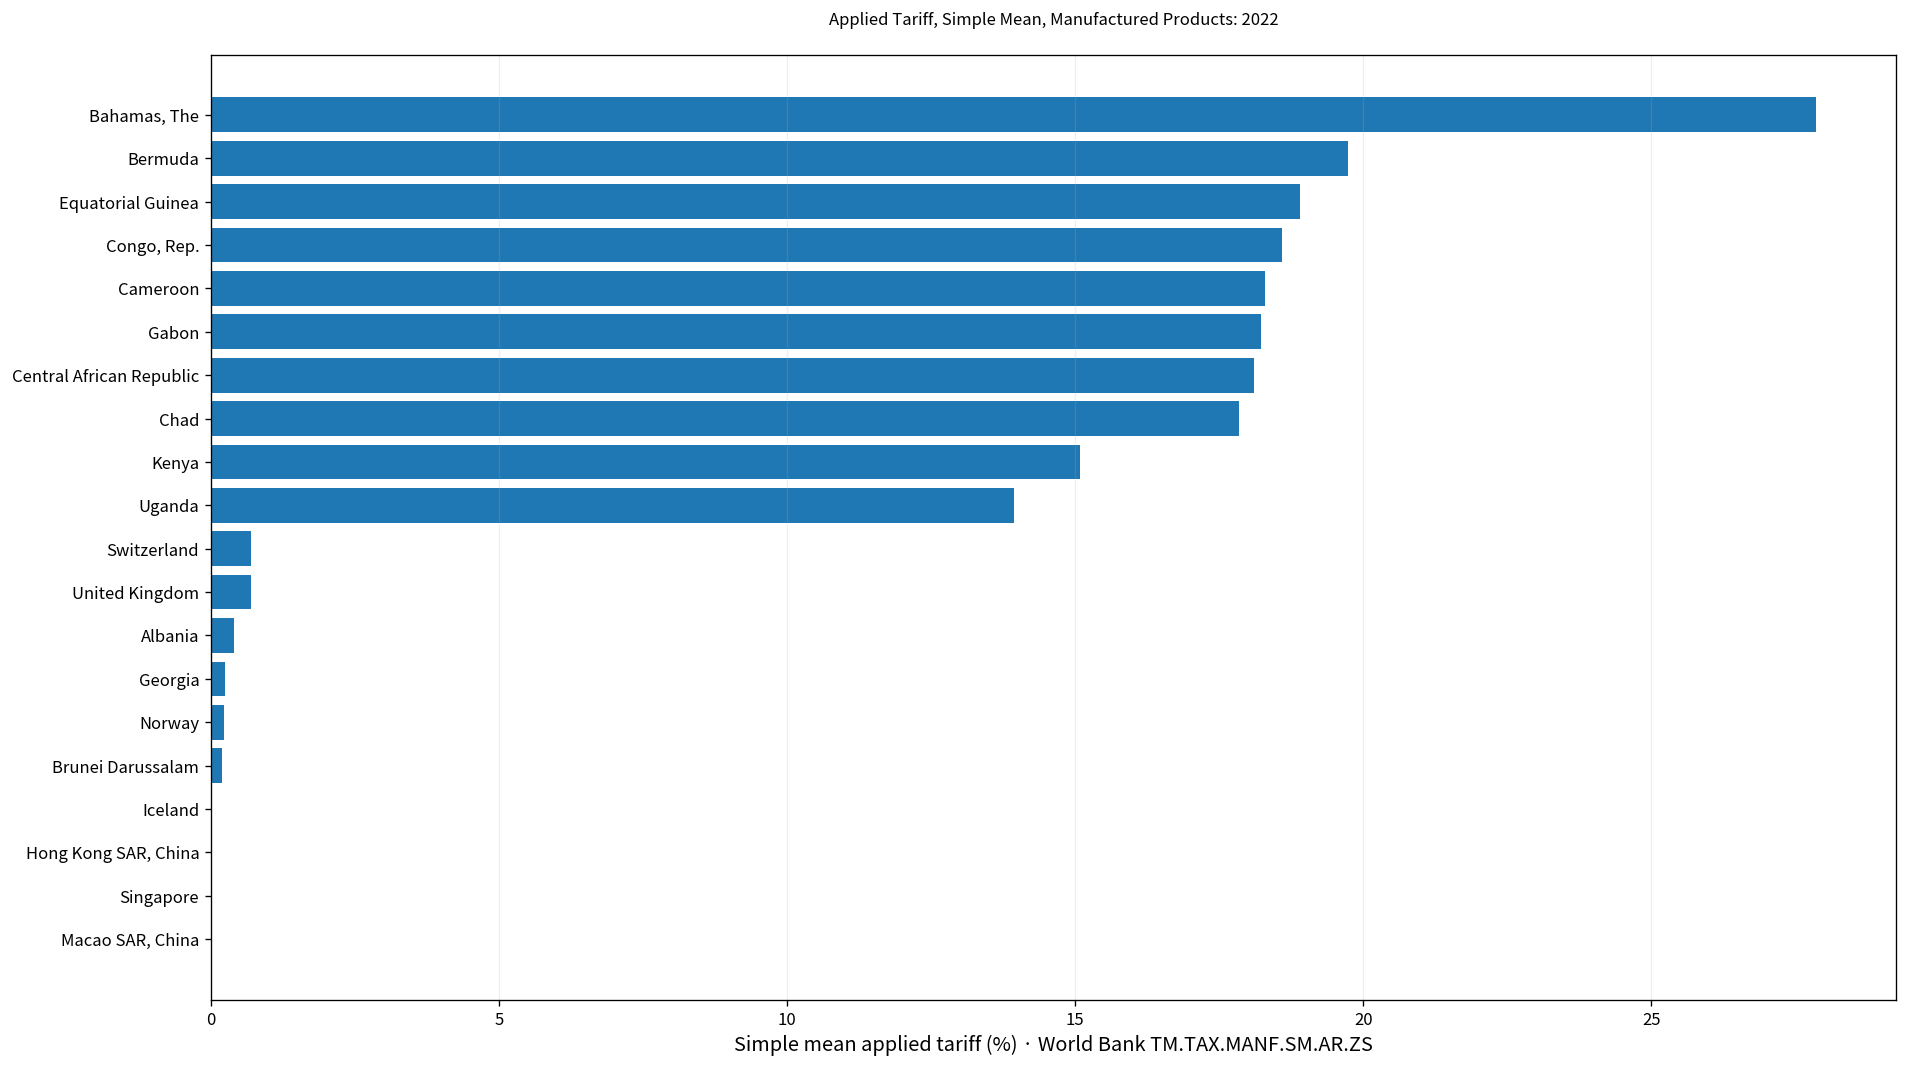
Table of Contents
What the applied simple-mean manufacturing tariff measures
World Bank documentation describes the simple mean applied tariff as the unweighted average of effectively applied tariff rates for products subject to tariffs. Tariff-line data are classified using the Harmonized System and matched to SITC Revision 3 commodity groups. Manufactured products cover SITC sections 5–8 excluding division 68.
When an effectively applied rate is unavailable, the most-favored-nation rate may be used instead. Specific duties are converted to ad valorem equivalents where possible. The indicator therefore represents a standardized average across tariff lines rather than one single statutory rate.
A simple mean is different from an import-weighted mean
The simple mean gives every included tariff line the same weight. An import-weighted mean gives more weight to products with larger import values. If a country has very high tariffs on products it imports only in small quantities, the simple mean can be high while the import-weighted mean remains much lower.
This distinction matters for interpretation. The simple mean is useful for describing the general level of a tariff schedule, while the weighted mean better reflects the tariff pattern attached to actual imports. Neither measure alone describes every aspect of trade protection.
Most of the 188 latest observations are from 2022
Among the 188 latest observations, 143 are from 2022 and 26 from 2021. There are 9 from 2020 and a small number of older latest observations reaching back to 2002.
| Observation year | Economies/territories | Share of 188 |
|---|---|---|
| 2022 | 143 | 76.1% |
| 2021 | 26 | 13.8% |
| 2020 | 9 | 4.8% |
| 2019 | 2 | 1.1% |
| 2018 | 1 | 0.5% |
| 2017 | 3 | 1.6% |
| 2016 | 1 | 0.5% |
| 2014 | 1 | 0.5% |
| 2006 | 1 | 0.5% |
| 2002 | 1 | 0.5% |
The mixed-year collection has a mean of 6.95% and a median of 5.64%, with values ranging from 0.00% to 27.85%. Because the observations do not share a year, those figures should not be described as a 2022 global average.
The 2022 mean is 6.58% and the median is 4.85%
The same-year 2022 subset contains 143 economies. Its mean is 6.58% and median 4.85%. The first quartile is 1.44% and the third quartile 11.10%, showing a wide middle range.
45 observations are below 2%, 71 are at least 5%, and 47 are at least 10%. 9 are at least 15%, while only 1 exceeds 20%. The distribution spans both near-zero tariff schedules and double-digit averages.
The Bahamas is highest in 2022 at 27.85%
The Bahamas records 27.85%, followed by Bermuda at 19.74%, Equatorial Guinea at 18.90%, Congo, Rep. at 18.58%, Cameroon at 18.30%, Gabon at 18.22%, Central African Republic at 18.11%, Chad at 17.84%, and Kenya at 15.09%.
| 2022 rank | Economy/territory | Applied simple-mean manufacturing tariff |
|---|---|---|
| 1 | Bahamas, The | 27.85% |
| 2 | Bermuda | 19.74% |
| 3 | Equatorial Guinea | 18.90% |
| 4 | Congo, Rep. | 18.58% |
| 5 | Cameroon | 18.30% |
| 6 | Gabon | 18.22% |
| 7 | Central African Republic | 18.11% |
| 8 | Chad | 17.84% |
| 9 | Kenya | 15.09% |
| 10 | Uganda | 13.94% |
| 11 | Cabo Verde | 13.84% |
| 12 | Brazil | 13.82% |
| 13 | Gambia, The | 13.19% |
| 14 | Venezuela, RB | 13.00% |
| 15 | Nepal | 12.85% |
A high value means the unweighted average of applied tariff rates across the manufactured-product lines in the indicator is high. It does not imply that the tariff burden on the actual import basket is equally high, and it does not show which individual manufactured industries face the highest rates.
Four 2022 observations are exactly zero
Hong Kong SAR, China, Iceland, Macao SAR, China, and Singapore are reported at 0%. Brunei Darussalam follows at 0.19%, Norway at 0.22%, Georgia at 0.24%, Albania at 0.40%, the United Kingdom at 0.69%, and Switzerland and Seychelles at 0.70%.
| Low-order position in 2022 | Economy/territory | Applied simple-mean manufacturing tariff |
|---|---|---|
| 1 | Hong Kong SAR, China | 0.00% |
| 2 | Iceland | 0.00% |
| 3 | Macao SAR, China | 0.00% |
| 4 | Singapore | 0.00% |
| 5 | Brunei Darussalam | 0.19% |
| 6 | Norway | 0.22% |
| 7 | Georgia | 0.24% |
| 8 | Albania | 0.40% |
| 9 | United Kingdom | 0.69% |
| 10 | Switzerland | 0.70% |
| 11 | Seychelles | 0.70% |
| 12 | Japan | 0.97% |
| 13 | Chile | 1.01% |
| 14 | Mauritius | 1.06% |
| 15 | Peru | 1.16% |
The zero values are published numeric observations rather than missing cells, so they are retained. A zero for this indicator should not be interpreted as proof that every import faces no border cost or that all trade barriers are absent. Nontariff measures, product exceptions, origin rules, and other taxes are outside this measure.
Repeated 1.44% values should be interpreted carefully
Many European Union members show the same 1.44% value, including Austria, Belgium, Bulgaria, Cyprus, Czechia, Denmark, Germany, Spain, Estonia, Finland, France, Greece, Croatia, Hungary, Ireland, Italy, Lithuania, Latvia, Malta, Netherlands, Poland, Portugal, and Romania. A shared external tariff framework can contribute to repeated values, but the indicator alone cannot explain every country-specific trade condition.
Economies with the same simple mean can still have very different import baskets, preference utilization, and origin composition. The same average tariff schedule does not imply the same effective burden on firms or consumers.
Applied tariffs are not the same as MFN tariffs
The most-favored-nation tariff is the baseline rate available under MFN treatment. The applied rate aims to reflect the rate actually applicable, and the World Bank methodology can use the MFN rate when the effectively applied rate is unavailable. Preferential arrangements can therefore make applied rates lower than MFN rates for some trade relationships.
Comparing a manufactured-products MFN simple mean with this applied simple mean can help show the difference between the baseline tariff schedule and rates available in practice. The comparison should use aligned years and product definitions.
The 2021 and 2022 averages are not a time trend
The 2021 subset contains 26 observations, with a mean of 7.79% and a median of 5.70%. Both are above the 2022 figures, but the two groups contain different economies. The difference should not be interpreted as a one-year global decline in manufacturing tariffs.
The data structure retains the latest non-empty observation for each economy. A true time trend would need the same economies observed in consecutive years rather than changing annual subsets.
A high tariff average is not the same as a high actual import-tax burden
Because the simple mean ignores import values, a high tariff on a rarely imported product receives the same weight as a rate on a major import line. Revenue or firm-level burden requires additional information on import values, exemptions, preferences, and tariff collection.
Tariffs are also only one part of trade policy. Quotas, technical standards, sanitary measures, subsidies, licensing rules, and rules of origin can affect trade without appearing in this indicator. The simple mean should therefore be treated as one dimension of border policy.
Complete list of the 188 latest observations
The table below lists the latest non-empty observation for every economy and territory in alphabetical order. Rows not dated 2022 retain their original observation year. For a strict same-year comparison, use only the 2022 observations.
| Economy/territory | Observation year | Applied simple-mean manufacturing tariff |
|---|---|---|
| Afghanistan | 2018 | 6.92% |
| Albania | 2022 | 0.40% |
| Algeria | 2022 | 10.97% |
| Angola | 2022 | 10.19% |
| Antigua and Barbuda | 2021 | 11.51% |
| Argentina | 2022 | 12.35% |
| Armenia | 2021 | 5.57% |
| Aruba | 2021 | 10.87% |
| Australia | 2022 | 2.12% |
| Austria | 2022 | 1.44% |
| Azerbaijan | 2022 | 8.79% |
| Bahamas, The | 2022 | 27.85% |
| Bahrain | 2022 | 3.77% |
| Bangladesh | 2022 | 12.57% |
| Barbados | 2022 | 10.49% |
| Belarus | 2021 | 5.60% |
| Belgium | 2022 | 1.44% |
| Belize | 2022 | 10.04% |
| Benin | 2022 | 10.68% |
| Bermuda | 2022 | 19.74% |
| Bhutan | 2022 | 6.36% |
| Bolivia | 2022 | 9.97% |
| Bosnia and Herzegovina | 2022 | 3.05% |
| Botswana | 2022 | 8.68% |
| Brazil | 2022 | 13.82% |
| Brunei Darussalam | 2022 | 0.19% |
| Bulgaria | 2022 | 1.44% |
| Burkina Faso | 2022 | 11.43% |
| Burundi | 2022 | 11.88% |
| Cabo Verde | 2022 | 13.84% |
| Cambodia | 2022 | 11.99% |
| Cameroon | 2022 | 18.30% |
| Canada | 2022 | 1.46% |
| Cayman Islands | 2021 | 22.26% |
| Central African Republic | 2022 | 18.11% |
| Chad | 2022 | 17.84% |
| Chile | 2022 | 1.01% |
| China | 2022 | 5.21% |
| Colombia | 2022 | 3.55% |
| Comoros | 2021 | 13.23% |
| Congo, Dem. Rep. | 2020 | 11.53% |
| Congo, Rep. | 2022 | 18.58% |
| Costa Rica | 2022 | 2.51% |
| Cote d’Ivoire | 2022 | 12.32% |
| Croatia | 2022 | 1.44% |
| Cuba | 2022 | 10.42% |
| Cyprus | 2022 | 1.44% |
| Czechia | 2022 | 1.44% |
| Denmark | 2022 | 1.44% |
| Djibouti | 2014 | 20.13% |
| Dominica | 2020 | 8.66% |
| Dominican Republic | 2022 | 3.97% |
| Ecuador | 2022 | 7.89% |
| Egypt, Arab Rep. | 2019 | 4.85% |
| El Salvador | 2022 | 2.94% |
| Equatorial Guinea | 2022 | 18.90% |
| Eritrea | 2006 | 9.61% |
| Estonia | 2022 | 1.44% |
| Eswatini | 2022 | 5.06% |
| Ethiopia | 2021 | 18.40% |
| Fiji | 2021 | 6.24% |
| Finland | 2022 | 1.44% |
| France | 2022 | 1.44% |
| French Polynesia | 2021 | 8.08% |
| Gabon | 2022 | 18.22% |
| Gambia, The | 2022 | 13.19% |
| Georgia | 2022 | 0.24% |
| Germany | 2022 | 1.44% |
| Ghana | 2022 | 12.44% |
| Greece | 2022 | 1.44% |
| Grenada | 2022 | 11.75% |
| Guatemala | 2022 | 3.06% |
| Guinea | 2022 | 12.30% |
| Guinea-Bissau | 2022 | 12.74% |
| Guyana | 2022 | 8.05% |
| Haiti | 2020 | 5.68% |
| Honduras | 2022 | 1.54% |
| Hong Kong SAR, China | 2022 | 0.00% |
| Hungary | 2022 | 1.44% |
| Iceland | 2022 | 0.00% |
| India | 2022 | 9.00% |
| Indonesia | 2022 | 5.78% |
| Iran, Islamic Rep. | 2020 | 15.60% |
| Ireland | 2022 | 1.44% |
| Israel | 2022 | 2.79% |
| Italy | 2022 | 1.44% |
| Jamaica | 2022 | 8.72% |
| Japan | 2022 | 0.97% |
| Jordan | 2022 | 3.79% |
| Kazakhstan | 2022 | 4.73% |
| Kenya | 2022 | 15.09% |
| Korea, Rep. | 2022 | 2.40% |
| Kuwait | 2022 | 4.71% |
| Kyrgyz Republic | 2021 | 4.38% |
| Lao PDR | 2022 | 2.49% |
| Latvia | 2022 | 1.44% |
| Lebanon | 2020 | 3.78% |
| Lesotho | 2022 | 4.50% |
| Liberia | 2022 | 12.46% |
| Libya | 2021 | 4.47% |
| Lithuania | 2022 | 1.44% |
| Macao SAR, China | 2022 | 0.00% |
| Madagascar | 2022 | 9.69% |
| Malawi | 2021 | 9.20% |
| Malaysia | 2022 | 5.54% |
| Maldives | 2022 | 11.24% |
| Mali | 2022 | 11.64% |
| Malta | 2022 | 1.44% |
| Mauritania | 2022 | 12.34% |
| Mauritius | 2022 | 1.06% |
| Mexico | 2022 | 2.62% |
| Moldova | 2022 | 2.08% |
| Mongolia | 2022 | 4.85% |
| Montenegro | 2022 | 1.52% |
| Morocco | 2021 | 5.48% |
| Mozambique | 2021 | 8.56% |
| Myanmar | 2022 | 2.84% |
| Namibia | 2022 | 7.39% |
| Naoero | 2021 | 12.31% |
| Nepal | 2022 | 12.85% |
| Netherlands | 2022 | 1.44% |
| New Zealand | 2022 | 2.38% |
| Nicaragua | 2022 | 2.89% |
| Niger | 2022 | 10.35% |
| Nigeria | 2022 | 11.77% |
| North Macedonia | 2022 | 2.97% |
| Norway | 2022 | 0.22% |
| Oman | 2022 | 2.98% |
| Pakistan | 2022 | 11.23% |
| Palau | 2021 | 4.33% |
| Panama | 2022 | 5.32% |
| Papua New Guinea | 2021 | 2.62% |
| Paraguay | 2022 | 8.40% |
| Peru | 2022 | 1.16% |
| Philippines | 2022 | 3.82% |
| Poland | 2022 | 1.44% |
| Portugal | 2022 | 1.44% |
| Qatar | 2022 | 4.09% |
| Romania | 2022 | 1.44% |
| Russian Federation | 2021 | 5.44% |
| Rwanda | 2022 | 10.43% |
| Samoa | 2020 | 11.07% |
| Sao Tome and Principe | 2019 | 9.79% |
| Saudi Arabia | 2022 | 5.84% |
| Senegal | 2022 | 12.37% |
| Serbia | 2021 | 2.92% |
| Seychelles | 2022 | 0.70% |
| Sierra Leone | 2022 | 12.84% |
| Singapore | 2022 | 0.00% |
| Slovak Republic | 2022 | 1.44% |
| Slovenia | 2022 | 1.44% |
| Solomon Islands | 2022 | 10.25% |
| South Africa | 2022 | 7.70% |
| Spain | 2022 | 1.44% |
| Sri Lanka | 2021 | 4.36% |
| St. Kitts and Nevis | 2020 | 9.82% |
| St. Lucia | 2020 | 7.85% |
| St. Vincent and the Grenadines | 2022 | 7.71% |
| Sudan | 2021 | 0.00% |
| Suriname | 2022 | 8.94% |
| Sweden | 2022 | 1.44% |
| Switzerland | 2022 | 0.70% |
| Syrian Arab Republic | 2020 | 9.03% |
| Tajikistan | 2021 | 5.79% |
| Tanzania | 2022 | 12.06% |
| Thailand | 2022 | 7.61% |
| Timor-Leste | 2021 | 2.53% |
| Togo | 2022 | 12.33% |
| Tonga | 2022 | 10.26% |
| Trinidad and Tobago | 2022 | 7.96% |
| Tunisia | 2016 | 9.32% |
| Turkiye | 2022 | 5.48% |
| Turkmenistan | 2002 | 3.80% |
| Tuvalu | 2017 | 8.21% |
| Uganda | 2022 | 13.94% |
| Ukraine | 2022 | 1.98% |
| United Arab Emirates | 2021 | 4.00% |
| United Kingdom | 2022 | 0.69% |
| United States | 2022 | 2.78% |
| Uruguay | 2022 | 10.19% |
| Uzbekistan | 2021 | 6.30% |
| Vanuatu | 2022 | 9.34% |
| Venezuela, RB | 2022 | 13.00% |
| Viet Nam | 2022 | 3.44% |
| West Bank and Gaza | 2017 | 1.37% |
| Yemen, Rep. | 2017 | 5.68% |
| Zambia | 2022 | 11.34% |
| Zimbabwe | 2021 | 17.97% |
How to interpret the comparison
First, the 188 latest observations do not share one year. Second, the simple mean gives each tariff line equal weight and differs from an import-weighted mean. Third, applied tariffs and MFN tariffs are related but not identical concepts. Fourth, a high tariff average does not directly measure the actual burden on the import basket or the overall restrictiveness of trade policy.
A detailed country analysis should combine tariff-line data, import weights, preferential agreements, tariff revenue, and nontariff measures. Trade data can also be revised, so the latest official tariff schedules and customs information are important for current decisions.
Source and calculation
The source is World Bank World Development Indicators TM.TAX.MANF.SM.AR.ZS, Tariff rate, applied, simple mean, manufactured products (%). The 2022 mean, median, quartiles, threshold counts, and rankings are calculated from the 143 observations dated 2022.
Frequently Asked Questions
Is the applied simple mean the same as an import-weighted tariff?
No. The simple mean gives each tariff line equal weight, while an import-weighted mean gives more weight to products with larger import values.
What is the 2022 median?
The median across the 143 observations dated 2022 is 4.85%, while the mean is 6.58%.
Does 0% mean there are no tariffs or trade barriers on all imports?
No. It is the simple mean for this manufactured-products tariff measure; nontariff measures, exceptions, origin rules, and other taxes are separate.
Related Articles
Green Map creates custom-edited map images using open geographic data sources such as geoBoundaries, Natural Earth, OpenStreetMap, and government open data. These maps are edited visual materials, not raw data files, and are provided for education, documents, presentations, and graphic reference.