Noncombustible renewable energy production varies sharply across the United States. In the U.S. Energy Information Administration’s State Energy Data System (SEDS), this category combines conventional hydropower, geothermal energy, solar thermal and photovoltaic energy, and wind energy. The 2024 dataset contains one annual observation for each of the 50 states plus the District of Columbia, all expressed in billion British thermal units (Billion Btu). Because every observation is from the same year, the map can be read as a direct 2024 state comparison rather than a mixture of “latest available” years.
Texas records the largest value at 585,047 Billion Btu, followed by California at 483,392 and Washington at 242,390. At the other end, the District of Columbia records 1,008 Billion Btu, Delaware 1,736, and Rhode Island 3,724. These values measure absolute energy production in the specified EIA category. They are not renewable shares, efficiency scores, or ratings of state energy policy, so state size, resource endowment, generating capacity, and power-system structure all matter when interpreting the ranking.
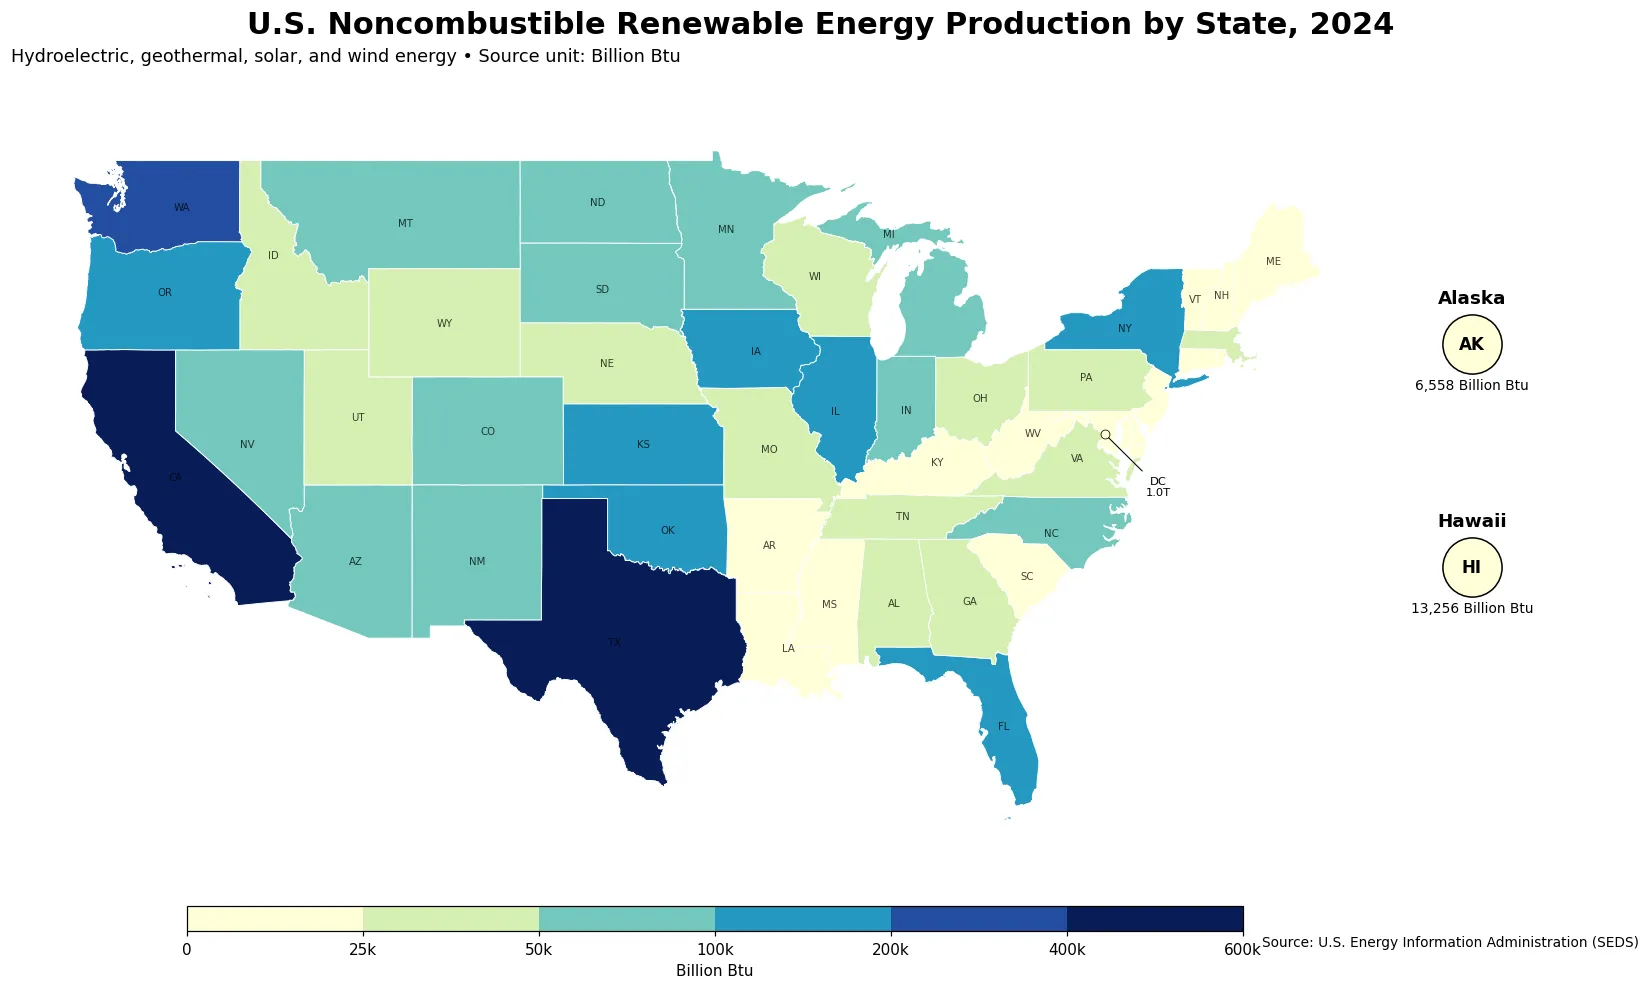
Table of Contents
All 51 observations refer to 2024
The year structure is unusually clean for a geographic comparison. Every row in the dataset is labeled 2024, so Texas is being compared with California, Washington, Iowa, New York, and every other jurisdiction on the same annual basis. There is no need to explain away a state whose last observation is several years older than another state’s value. The 51 rows also make the coverage explicit: the 50 states are joined by the District of Columbia as a separate jurisdiction.
Adding the 51 state-and-D.C. observations gives 3,586,973 Billion Btu, equivalent to about 3,586.97 trillion Btu. EIA’s 2024 production technical notes define the U.S. total for this category as the sum of state values. This total should still be read narrowly. It is the sum for noncombustible renewable energy only; it does not represent all renewable production because EIA classifies biofuels and wood-and-waste energy separately.
Texas and California together account for nearly 30% of the reported sum
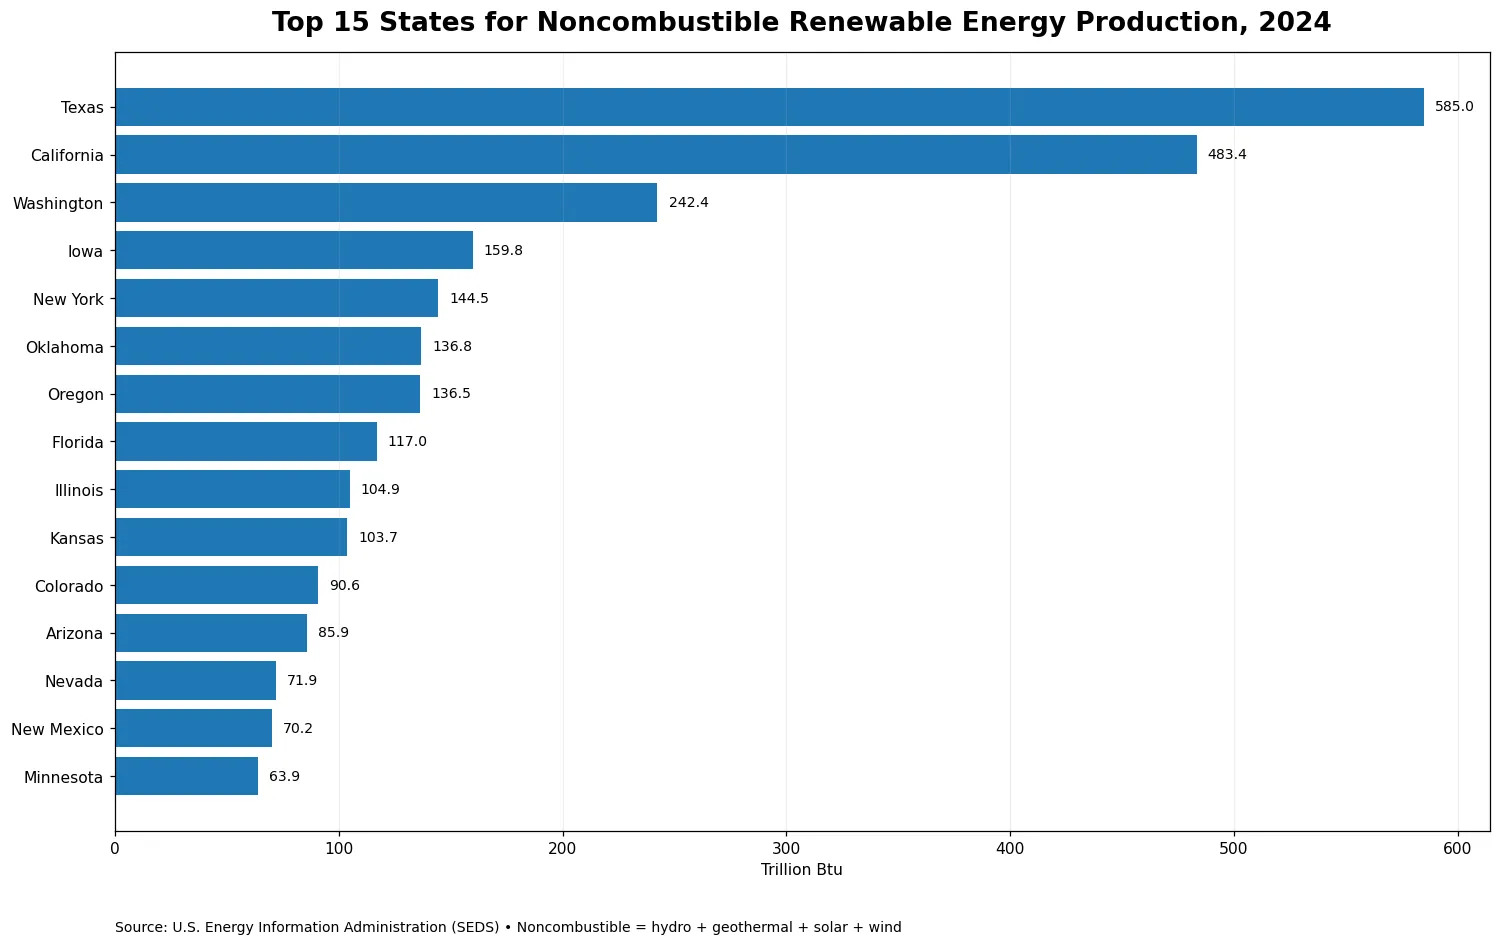
Texas alone represents about 16.3% of the 51-value sum, while California contributes about 13.5%. Together they account for roughly 29.8%. Washington adds about 6.8%, Iowa 4.5%, and New York 4.0%. The first five jurisdictions therefore make up about 45.0% of the total represented by the dataset. Extending the list to the top ten raises the concentration to about 61.7%.
The leaders do not all reach the top for the same physical reason. Texas has an exceptionally large wind fleet and substantial solar capacity. California combines large solar output with hydroelectric and geothermal resources, while Washington’s renewable profile is strongly associated with hydropower. The aggregated series used here does not provide a component breakdown by state, however, so the article does not assign a specific number of Billion Btu to wind, hydro, solar, or geothermal within any state. That requires the underlying EIA source-specific series.
| State / jurisdiction | 2024 Billion Btu |
|---|---|
| Texas | 585,047 |
| California | 483,392 |
| Washington | 242,390 |
| Iowa | 159,803 |
| New York | 144,538 |
| Oklahoma | 136,834 |
| Oregon | 136,489 |
| Florida | 116,977 |
| Illinois | 104,871 |
| Kansas | 103,715 |
The median is only about half of the mean
The distribution is strongly right-skewed. The median is 34,754 Billion Btu, while the mean is approximately 70,333 Billion Btu. The first quartile is 18,828 and the third quartile is 71,035 Billion Btu. In practical terms, a handful of very large observations pull the average well above the value of a typical middle-ranked state. A reader who looks only at the mean would therefore get an inflated sense of what most states produce.
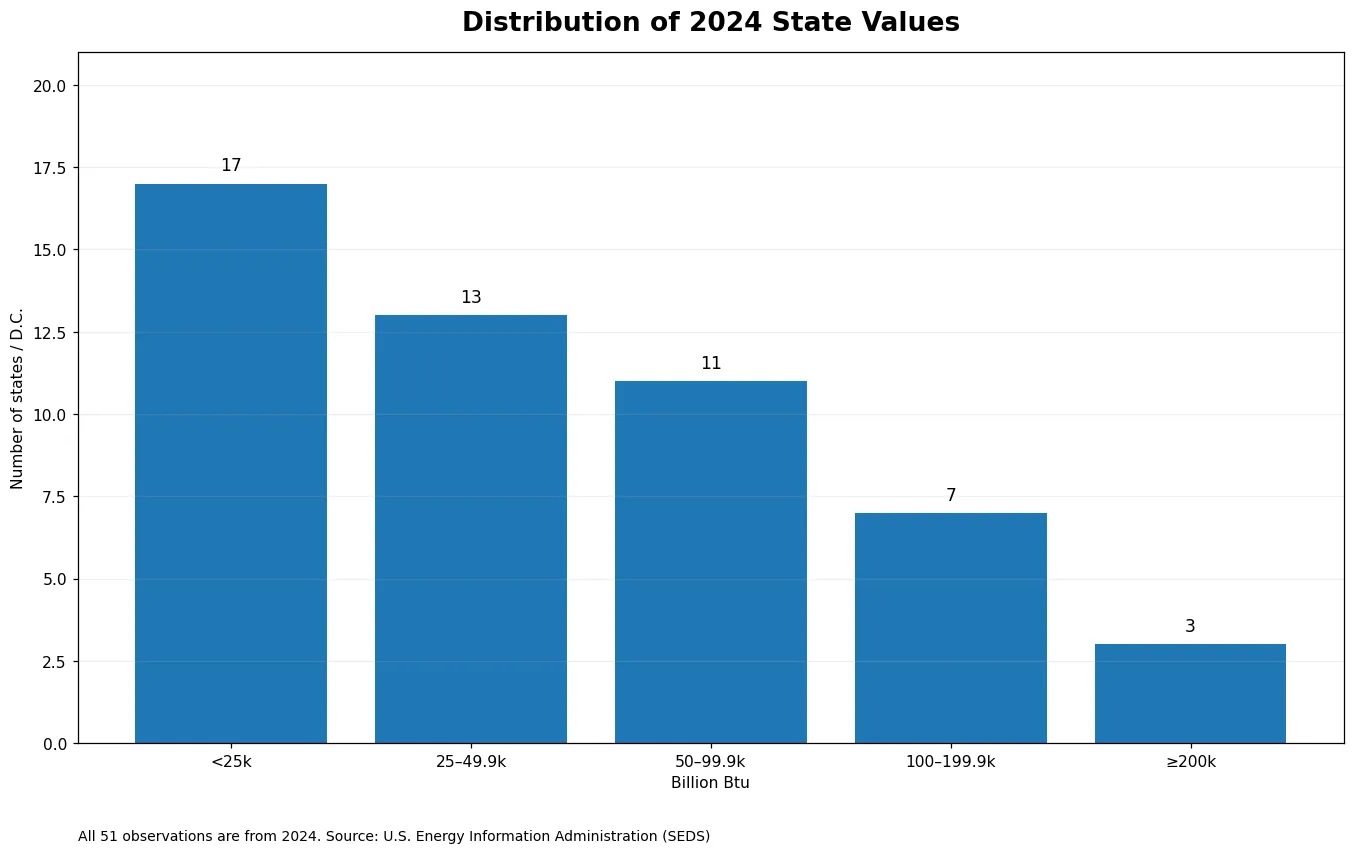
The grouped counts show the same pattern. Seventeen jurisdictions, or 33.3% of the dataset, are below 25,000 Billion Btu. Another 13 fall from 25,000 to just under 50,000, and 11 are between 50,000 and 100,000. Only seven are in the 100,000-to-below-200,000 range, while just three—Texas, California, and Washington—are at or above 200,000 Billion Btu. The upper tail is small but very influential.
What EIA means by noncombustible renewable energy
The word “noncombustible” is important because it defines the boundary of the statistic. EIA’s SEDS production methodology includes four sources in this group: geothermal energy, conventional hydroelectric power, solar thermal and photovoltaic energy, and wind energy. These sources do not depend on burning a renewable fuel to release heat. Biomass fuels, wood, waste, biodiesel, fuel ethanol, renewable diesel, and other biofuels therefore belong to other renewable-production categories and are not part of the values shown here.
SEDS treats production of these noncombustible renewable sources as equal to their energy consumption for this accounting framework. The state total is the sum of geothermal, hydropower, solar, and wind production. That definition also explains why the numbers should not be compared directly with a table labeled simply “renewable energy production” unless the scope of that table is checked first. EIA’s broader renewable total includes biofuels and wood-and-waste in addition to the noncombustible component.
Why the source uses Billion Btu rather than only megawatt-hours
A Btu is a unit of energy. SEDS uses common energy units so that resources with different physical forms can be compared within one energy accounting system. The cleaned state series supplied for this analysis is already published in Billion Btu, so the map and tables preserve that unit. The top-15 chart converts the same values to trillion Btu only to make the labels easier to read. No additional energy estimate is introduced by that display conversion.
There is also an important methodological note for longer time-series work. Beginning with the SEDS 2022 data cycle, EIA calculates primary energy consumption for electricity generation from solar, wind, hydroelectric, and geothermal sources using the captured energy approach. It applies the constant electricity heat content of 3,412 Btu per kilowatthour. Earlier SEDS cycles used a fossil-fuel-equivalency method based on the average heat rate of fossil-fueled steam-electric plants. Anyone comparing values across long periods should account for that methodological change; the 2024 cross-section here uses one consistent current method.
Absolute production is not the same thing as renewable share
The ranking answers a location question: where was the largest amount of noncombustible renewable energy produced in 2024? It does not answer what percentage of each state’s electricity or total energy came from renewables. Texas can lead in absolute production while another state can have a higher renewable percentage because the denominator—total generation or consumption—may be much smaller. Large economies and large power systems can post high absolute values even when renewables represent only part of their overall energy mix.
For policy or transition comparisons, it is useful to pair this dataset with renewable generation share, total electricity generation, total state energy consumption, and source-specific generation. Absolute production shows scale; shares show dependence within an energy mix; per-capita measures show output relative to population; and intensity measures can relate energy to economic activity. Those indicators answer different questions and should not be treated as interchangeable.
The lowest values need geographic context
The smallest 2024 observation is the District of Columbia at 1,008 Billion Btu. Delaware follows at 1,736, Rhode Island at 3,724, Alaska at 6,558, and Vermont at 7,291. Reading those numbers as a performance league table would be misleading. D.C. has very limited land and generating space. Small northeastern states operate within highly interconnected regional power markets. Alaska, despite its enormous land area, has a geographically dispersed population and isolated electric systems. Absolute production is shaped by those structural conditions as well as by resource availability.
| Lowest-value jurisdiction | 2024 Billion Btu |
|---|---|
| District of Columbia | 1,008 |
| Delaware | 1,736 |
| Rhode Island | 3,724 |
| Alaska | 6,558 |
| Vermont | 7,291 |
The map is therefore most useful as a spatial index to where the category is large or small. It does not by itself reveal whether a state’s value comes mostly from dams, wind farms, solar installations, or geothermal facilities. Two states in the same color class can have very different resource portfolios. Source-specific EIA series are needed before drawing conclusions about the technology mix behind a state’s position.
Source and interpretation limits
The annual observations come from the U.S. Energy Information Administration State Energy Data System bulk files. The formal definition and accounting relationships are documented in the SEDS 2024 Renewable Energy Production Technical Notes. EIA defines the category as the sum of geothermal, hydropower, solar, and wind production and states that the production of these noncombustible renewable sources is treated as equal to consumption in SEDS.
This article intentionally stays within the evidence supplied by the 2024 cross-section. It does not calculate annual growth, forecast future output, or infer causal explanations from the ranking. It also does not convert the state values into renewable shares or per-capita measures. Used within those limits, the dataset gives a clear picture of the geographic concentration and wide spread of U.S. noncombustible renewable energy production in 2024.
Frequently Asked Questions
What sources count as noncombustible renewable energy in SEDS?
EIA includes geothermal energy, conventional hydropower, solar thermal and photovoltaic energy, and wind. Biofuels and wood-and-waste energy are separate categories.
Are all 51 observations from 2024?
Yes. The dataset contains 2024 values for all 50 states and the District of Columbia, so the jurisdictions are compared on the same annual basis.
Does Texas ranking first mean it has the highest renewable share?
No. This is an absolute production measure in Billion Btu. Renewable share requires a denominator such as total electricity generation or total energy consumption.
Related Articles
Green Map creates custom-edited map images using open geographic data sources such as geoBoundaries, Natural Earth, OpenStreetMap, and government open data. These maps are edited visual materials, not raw data files, and are provided for education, documents, presentations, and graphic reference.