World Bank indicator MS.MIL.XPND.GD.ZS provides a latest non-empty military-expenditure share of GDP for 164 countries and economies. 147 observations are from 2024, while 17 latest observations are from earlier years between 1999 and 2023. The unweighted country mean is 2.37% and the median 1.75%. Ukraine has the highest latest observation at 34.48%, while Eritrea’s 20.87% is from 2003 and should not be treated as a current-year comparison.
The indicator is a ratio, not a monetary amount. The numerator is military expenditure under the SIPRI framework and the denominator is GDP. It therefore shows military spending relative to the size of an economy rather than ranking countries by absolute military expenditure or military capability.
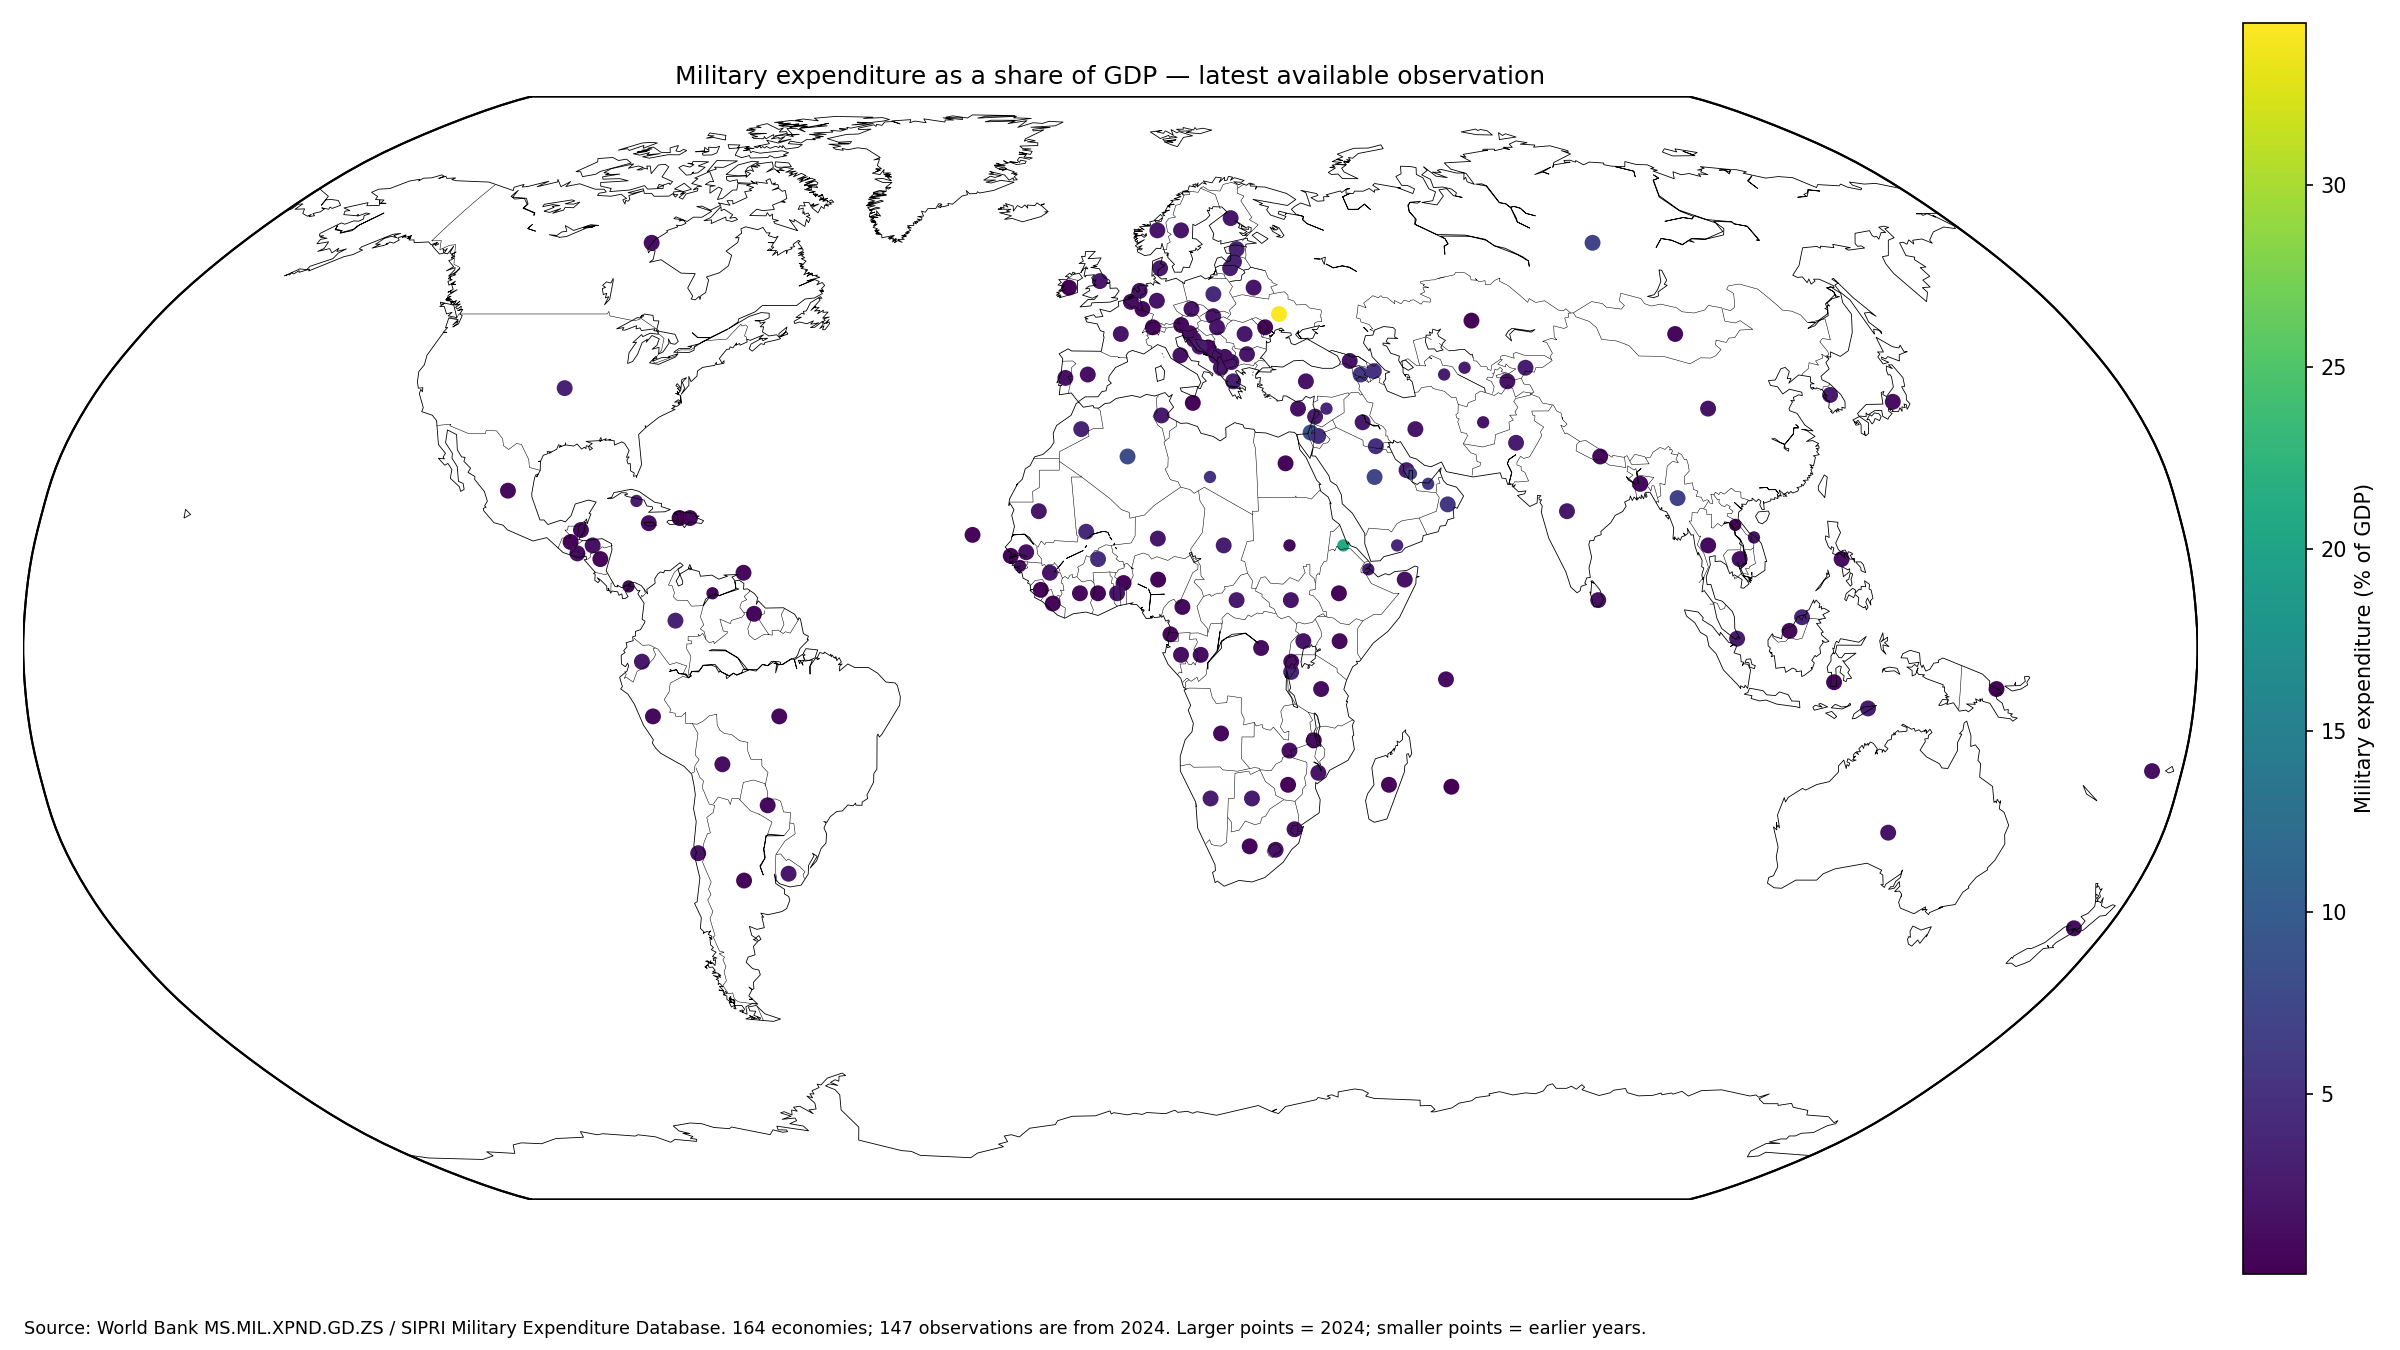
Table of Contents
What military expenditure as a share of GDP measures
The World Bank defines the indicator as military expenditure by country expressed as a percentage of gross domestic product. The ratio places military spending against the total value of economic production.
The World Bank metadata glossary identifies the Stockholm International Peace Research Institute Military Expenditure Database as the source. The World Bank API provides the latest non-empty country observations.
SIPRI military expenditure is broader than arms purchases
The SIPRI definition aims, where possible, to include current and capital spending on armed forces, peacekeeping forces, defence ministries and other agencies engaged in defence projects, qualifying paramilitary forces, and military space activities.
It can include personnel costs, operations and maintenance, procurement, military research and development, military construction, and military aid in the donor country’s expenditure. Civil defence and some spending related to past military activities, such as veterans’ benefits, demobilization, conversion, and weapon destruction, are excluded. Military expenditure is therefore not synonymous with spending on weapons.
The synchronized 2024 subset covers 147 economies
Restricting the data to 2024 leaves 147 economies. Ukraine records 34.48%, Israel 8.78%, Algeria 7.97%, Saudi Arabia 7.30%, the Russian Federation 7.05%, and Myanmar 6.79%.
| 2024 rank | Country or economy | Military expenditure / GDP |
|---|---|---|
| 1 | Ukraine | 34.48% |
| 2 | Israel | 8.78% |
| 3 | Algeria | 7.97% |
| 4 | Saudi Arabia | 7.30% |
| 5 | Russian Federation | 7.05% |
| 6 | Myanmar | 6.79% |
| 7 | Oman | 5.59% |
| 8 | Armenia | 5.48% |
| 9 | Azerbaijan | 4.99% |
| 10 | Kuwait | 4.84% |
| 11 | Jordan | 4.80% |
| 12 | Burkina Faso | 4.68% |
| 13 | Mali | 4.20% |
| 14 | Poland | 4.15% |
| 15 | Burundi | 3.80% |
The 2024 subset has an unweighted mean of 2.20% and a median of 1.59%. Its first quartile is 0.98% and third quartile 2.39%. 42 economies are below 1%, 49 are from 1% to under 2%, 33 from 2% to under 3%, 15 from 3% to under 5%, and 8 are at least 5%.
The full latest-value table mixes observation years
Across all latest observations, Ukraine records 34.48%, Eritrea 20.87%, Israel 8.78%, and Algeria 7.97%. Eritrea is a 2003 observation, however, and other high values include Qatar from 2022 and the United Arab Emirates from 2014.
For that reason, the 164-economy list should be called a latest-available comparison rather than a current 2024 ranking. Same-year analysis is cleaner when restricted to the 147 observations from 2024.
| Latest-observation rank | Country or economy | Observation year | Military expenditure / GDP |
|---|---|---|---|
| 1 | Ukraine | 2024 | 34.48% |
| 2 | Eritrea | 2003 | 20.87% |
| 3 | Israel | 2024 | 8.78% |
| 4 | Algeria | 2024 | 7.97% |
| 5 | Saudi Arabia | 2024 | 7.30% |
| 6 | Russian Federation | 2024 | 7.05% |
| 7 | Myanmar | 2024 | 6.79% |
| 8 | Qatar | 2022 | 6.50% |
| 9 | United Arab Emirates | 2014 | 5.64% |
| 10 | Oman | 2024 | 5.59% |
| 11 | Armenia | 2024 | 5.48% |
| 12 | Libya | 2023 | 5.29% |
| 13 | Azerbaijan | 2024 | 4.99% |
| 14 | Kuwait | 2024 | 4.84% |
| 15 | Jordan | 2024 | 4.80% |
Seventeen latest observations are older than 2024
Panama and Turkmenistan are from 1999, Eritrea from 2003, Djibouti from 2008, the Syrian Arab Republic from 2010, and Lao PDR from 2013. The United Arab Emirates and Yemen are from 2014; Cuba, Uzbekistan, and Viet Nam from 2018; Afghanistan and Sudan from 2021; Qatar from 2022; and Guinea-Bissau, Libya, and Venezuela from 2023.
| Country or economy | Latest observation year | Military expenditure / GDP |
|---|---|---|
| Panama | 1999 | 0.97% |
| Turkmenistan | 1999 | 2.90% |
| Eritrea | 2003 | 20.87% |
| Djibouti | 2008 | 2.63% |
| Syrian Arab Republic | 2010 | 4.06% |
| Lao PDR | 2013 | 0.19% |
| United Arab Emirates | 2014 | 5.64% |
| Yemen, Rep. | 2014 | 3.97% |
| Cuba | 2018 | 2.88% |
| Uzbekistan | 2018 | 2.87% |
| Viet Nam | 2018 | 1.81% |
| Afghanistan | 2021 | 1.83% |
| Sudan | 2021 | 0.93% |
| Qatar | 2022 | 6.50% |
| Guinea-Bissau | 2023 | 1.23% |
| Libya | 2023 | 5.29% |
| Venezuela, RB | 2023 | 0.50% |
An old latest observation is not a statement about the country’s present policy. The most-recent-non-empty method improves coverage but leaves countries on different reference years.
The overall median is 1.75%
The median across 164 latest observations is 1.75%, with a first quartile of 0.98% and third quartile of 2.60%. 46 observations are below 1%, 52 are from 1% to under 2%, 37 from 2% to under 3%, 17 from 3% to under 5%, and 12 are at least 5%.
The mean of 2.37% sits above the median because a small number of high ratios stretch the upper tail. The median and distribution bands are more useful than the mean alone when describing a typical country observation.
The low end includes many values below 1%
The lowest latest observations include Haiti at 0.07%, Mauritius 0.15%, Lao PDR 0.19%, Ireland 0.24%, Papua New Guinea 0.31%, Zimbabwe 0.35%, Guatemala 0.37%, and Ghana 0.38%.
A low share does not mean military spending is absent. It means military expenditure is small relative to GDP. A very large economy at 0.5% can spend more in absolute terms than a small economy at 3%.
| Low-end rank | Country or economy | Observation year | Military expenditure / GDP |
|---|---|---|---|
| 1 | Haiti | 2024 | 0.07% |
| 2 | Mauritius | 2024 | 0.15% |
| 3 | Lao PDR | 2013 | 0.19% |
| 4 | Ireland | 2024 | 0.24% |
| 5 | Papua New Guinea | 2024 | 0.31% |
| 6 | Zimbabwe | 2024 | 0.35% |
| 7 | Guatemala | 2024 | 0.37% |
| 8 | Ghana | 2024 | 0.38% |
| 9 | Kazakhstan | 2024 | 0.43% |
| 10 | Malta | 2024 | 0.45% |
| 11 | Sierra Leone | 2024 | 0.46% |
| 12 | Venezuela, RB | 2023 | 0.50% |
| 13 | Nicaragua | 2024 | 0.55% |
| 14 | Nigeria | 2024 | 0.56% |
| 15 | Gambia, The | 2024 | 0.57% |
A GDP share is different from absolute military expenditure
Military expenditure as a percentage of GDP shows the relative scale of military spending compared with the economy. Absolute military expenditure shows the monetary amount. The two can produce very different country orderings.
Current-dollar or constant-dollar SIPRI series are more appropriate for absolute spending comparisons. The GDP-share series is suited to questions about military spending relative to economic output.
Military spending as a share of government expenditure uses another denominator
A separate indicator expresses military expenditure as a percentage of general government spending. That measure asks how much of the government’s expenditure is directed to the military, while the present indicator compares military spending with the entire economy.
The two ratios can differ substantially depending on the size of government expenditure relative to GDP. They should not be used interchangeably.
The ratio does not decide whether a spending level is appropriate
This dataset does not contain information on security conditions, force structure, alliances, fiscal constraints, social spending, procurement efficiency, or strategic objectives. A high or low ratio by itself therefore cannot establish what level of military spending is appropriate for a particular country.
Policy assessment requires additional country-specific evidence and objectives. This map is limited to the measured relationship between military expenditure and GDP.
Military expenditure is not the same as military capability
Spending is an input measure. Countries can convert the same amount of money into personnel, equipment, operations, infrastructure, and readiness in very different ways because prices, wages, procurement systems, domestic production, and exchange rates differ.
The GDP share should therefore not be interpreted as a direct score of military power or combat capability. It measures financial resources devoted to current military forces and activities relative to the economy.
High and low shares are geographically dispersed
In 2024, observations above 5% appear across Eastern Europe, the Middle East and North Africa, the Caucasus, and Southeast Asia. Values below 1% also appear across Latin America, Africa, Europe, Asia, and the Caribbean.
The map does not show one continent uniformly high or low. Country-level variation is substantial, and the causes of those differences cannot be established from this single indicator alone.
The country mean is not the world GDP-weighted military burden
The 2.37% simple mean gives every one of the 164 economies equal weight. A very large economy and a small economy each count once. That is different from aggregating military expenditure and GDP across countries or applying GDP weights.
A global military-expenditure-to-GDP ratio should therefore come from an appropriately weighted or official aggregate. The mean and median here summarize the distribution of country ratios.
Source and calculation notes
The source is World Bank World Development Indicators series MS.MIL.XPND.GD.ZS, based on the SIPRI Military Expenditure Database. The analysis uses 164 latest non-empty observations and separately reviews the 147 observations from 2024. The official World Bank API provides the series.
All 164 country codes are joined to geographic centroids for the map, producing a 100% match. Larger points mark 2024 observations and smaller points earlier years; missing values are not zero-filled.
Frequently Asked Questions
Does military expenditure mean spending only on weapons?
No. SIPRI's definition is broader and can include personnel, operations, procurement, military R&D, construction, and other current military activities.
Does a high military-expenditure share mean the country spends the most money?
Not necessarily. The indicator is a percentage of GDP, so absolute military spending can produce a different ordering.
Are all 164 observations from 2024?
No. 147 are from 2024 and 17 are latest available observations from 1999–2023.
Related Articles
Green Map creates custom-edited map images using open geographic data sources such as geoBoundaries, Natural Earth, OpenStreetMap, and government open data. These maps are edited visual materials, not raw data files, and are provided for education, documents, presentations, and graphic reference.