World Bank indicator NY.GNP.PCAP.KD provides a latest non-empty GNI-per-capita observation in constant 2015 US dollars for 203 countries and territories. 100 observations are from 2025, 48 from 2024, and 44 remain at 2015. The unweighted mean is $16,363 and the median $6,755. Liechtenstein has the highest latest observation at $137,689, but that value is from 2015; Singapore leads the 2025 subset at $64,996.
GNI per capita differs from GDP per capita because GNI follows the income of residents rather than production within the territory alone. Conceptually, GNI equals GDP plus primary income receivable from abroad minus primary income payable abroad, then divided by population. This series adjusts prices to a common 2015 reference and expresses the result in US dollars.
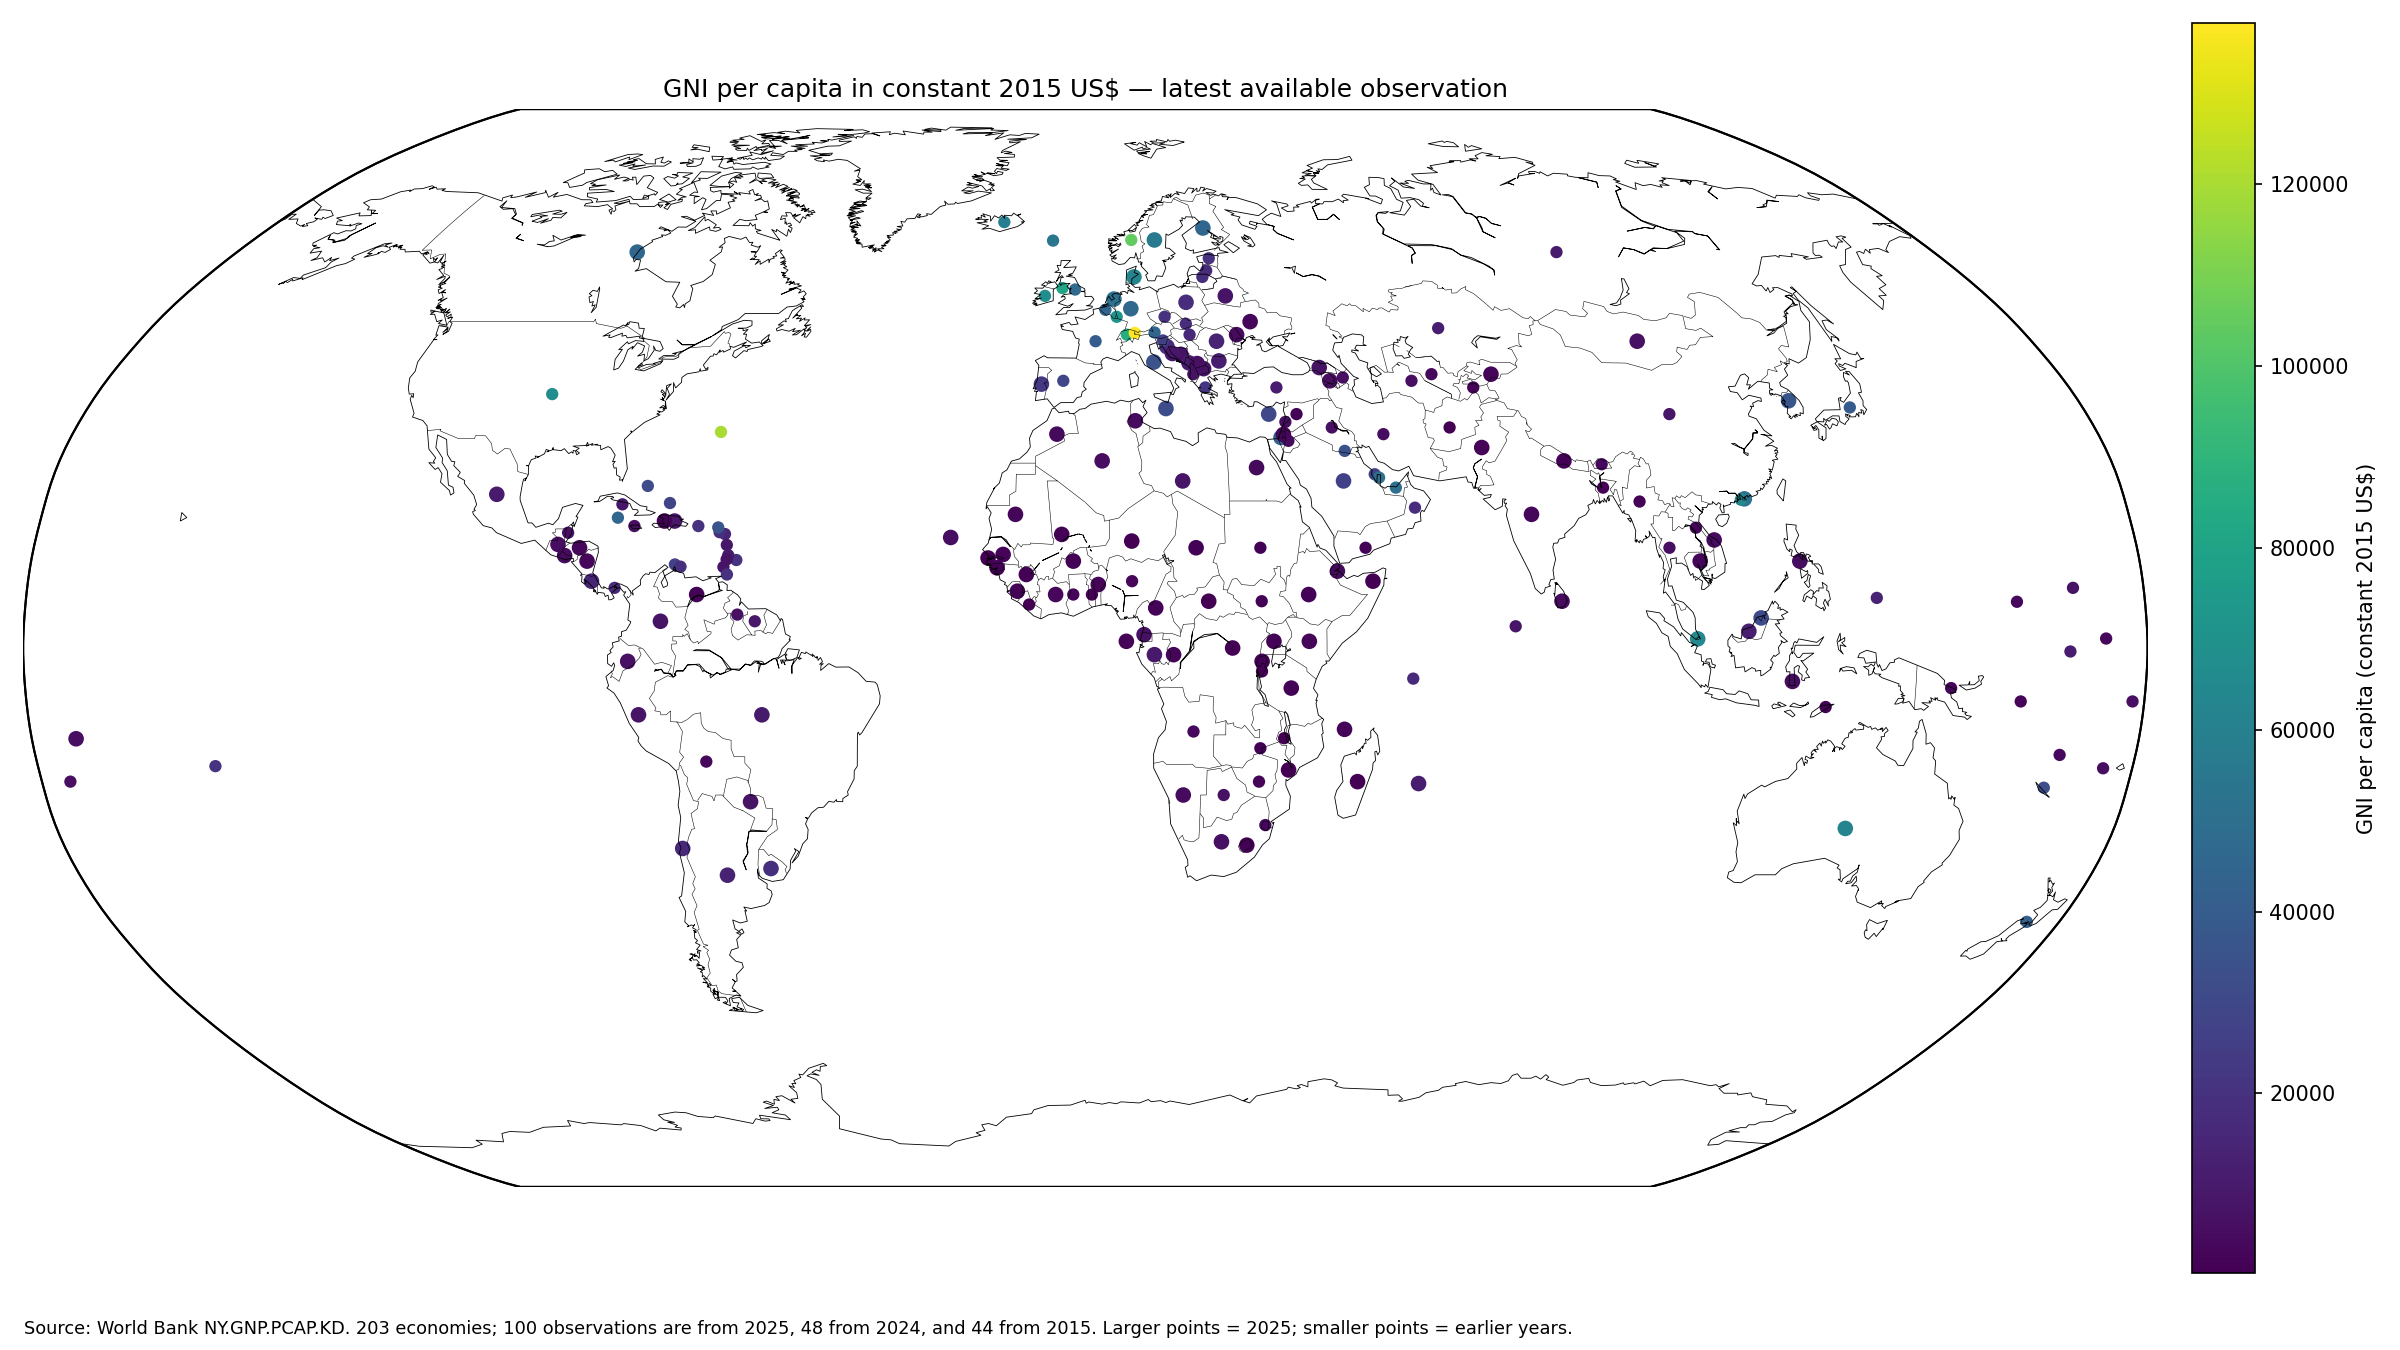
Table of Contents
What GNI per capita in constant 2015 US dollars means
The World Bank defines gross national income as the total income earned by residents of an economy during an accounting period. It can be expressed as GDP plus income receivable from abroad minus income payable abroad. Dividing by population creates the per-capita measure.
The World Bank metadata glossary states that the series is adjusted for price changes with 2015 as the reference year and expressed in US dollars. The World Bank API provides the latest non-empty country observations.
Constant US dollars differ from current US dollars
Current-dollar GNI per capita reflects the price level and exchange-rate conditions of each observation year. Constant 2015 US dollars remove much of the price-change effect so that the real level is more useful for comparisons through time.
Constant dollars do not, however, equal purchasing-power parity. PPP adjusts for differences in price levels across economies, while constant US dollars are a different conversion intended to express real values in a common dollar reference.
Why GNI and GDP can diverge
GDP measures production generated within an economic territory. GNI adjusts that production measure for net primary income flowing across borders, including compensation of employees and property income.
Economies with large cross-border investment income, multinational activity, or worker-income flows can therefore show a meaningful gap between GDP per capita and GNI per capita.
The full latest-value ranking mixes very different years
The highest latest observations include Liechtenstein at $137,689, Bermuda at $119,540, Norway at $104,871, Switzerland at $85,646, Isle of Man at $81,295, and Luxembourg at $70,611.
The years are not synchronized. Liechtenstein is 2015, Bermuda 2024, Norway 2022, and Switzerland and Isle of Man 2023. The 203-economy latest-value list should therefore not be described as a 2025 ranking.
| Rank | Country or territory | Observation year | GNI per capita |
|---|---|---|---|
| 1 | Liechtenstein | 2015 | $137,689 |
| 2 | Bermuda | 2024 | $119,540 |
| 3 | Norway | 2022 | $104,871 |
| 4 | Switzerland | 2023 | $85,646 |
| 5 | Isle of Man | 2023 | $81,295 |
| 6 | Luxembourg | 2024 | $70,611 |
| 7 | United States | 2024 | $67,191 |
| 8 | Ireland | 2024 | $67,024 |
| 9 | Singapore | 2025 | $64,996 |
| 10 | Macao SAR, China | 2024 | $64,642 |
| 11 | Denmark | 2025 | $62,544 |
| 12 | Australia | 2025 | $62,327 |
| 13 | Iceland | 2024 | $58,381 |
| 14 | Sweden | 2025 | $56,459 |
| 15 | Faroe Islands | 2015 | $54,063 |
The 2025 same-year subset covers 100 economies
Restricting the data to 2025 leaves 100 economies. Singapore leads at $64,996, followed by Denmark at $62,544, Australia at $62,327, Sweden at $56,459, Hong Kong SAR at $51,697, and the Netherlands at $51,094.
| 2025 rank | Country or territory | GNI per capita |
|---|---|---|
| 1 | Singapore | $64,996 |
| 2 | Denmark | $62,544 |
| 3 | Australia | $62,327 |
| 4 | Sweden | $56,459 |
| 5 | Hong Kong SAR, China | $51,697 |
| 6 | Netherlands | $51,094 |
| 7 | Germany | $45,964 |
| 8 | Canada | $45,753 |
| 9 | Finland | $45,185 |
| 10 | Israel | $42,711 |
| 11 | Italy | $34,912 |
| 12 | Malta | $32,017 |
| 13 | Brunei Darussalam | $31,133 |
| 14 | Cyprus | $29,932 |
| 15 | Saudi Arabia | $26,412 |
The 2025 subset has an unweighted mean of $11,581 and a median of $4,838. Its first quartile is $1,553 and third quartile $11,601. 29 economies are below $2,000, 22 are from $2,000 to under $5,000, 20 from $5,000 to under $10,000, 13 from $10,000 to under $25,000, 10 from $25,000 to under $50,000, and 6 are at least $50,000.
The low end also needs observation-year context
The lowest latest observations include Burundi, Madagascar, the Democratic Republic of the Congo, Somalia, the Central African Republic, Malawi, Mozambique, Afghanistan, Niger, and Liberia. Several of these are 2015 observations rather than recent values.
When an old last-available value is placed beside a 2025 observation, time differences become mixed with income differences. That is why the observation year is displayed in the table and encoded in point size on the map.
| Low-end rank | Country or territory | Observation year | GNI per capita |
|---|---|---|---|
| 1 | Burundi | 2015 | $254 |
| 2 | Madagascar | 2025 | $453 |
| 3 | Congo, Dem. Rep. | 2025 | $473 |
| 4 | Somalia, Fed. Rep. | 2025 | $481 |
| 5 | Central African Republic | 2025 | $499 |
| 6 | Malawi | 2015 | $527 |
| 7 | Mozambique | 2025 | $551 |
| 8 | Afghanistan | 2015 | $569 |
| 9 | Niger | 2025 | $610 |
| 10 | Liberia | 2015 | $632 |
| 11 | Gambia, The | 2025 | $728 |
| 12 | Syrian Arab Republic | 2015 | $816 |
| 13 | Guinea-Bissau | 2025 | $818 |
| 14 | Chad | 2025 | $856 |
| 15 | Burkina Faso | 2025 | $885 |
The overall median is about $6,755
The median across the 203 latest observations is $6,755, with a first quartile of $2,373 and third quartile of $19,699. 45 observations are below $2,000, 37 are from $2,000 to under $5,000, 42 from $5,000 to under $10,000, 34 from $10,000 to under $25,000, 26 from $25,000 to under $50,000, and 19 are at least $50,000.
The simple mean of $16,363 is far above the median because a relatively small group of high-income observations creates a long upper tail. The median and income bands provide a better picture of the typical country observation.
Forty-four latest observations remain in 2015
44 of the 203 country rows have 2015 as their latest non-empty observation, while 148 are from 2024 or 2025. The World Bank API request uses the most-recent-non-empty option, so the latest year is country-specific.
This design improves geographic coverage but limits a purely current comparison. A 2015 value should not be labeled as the economy’s 2025 income level without a newer observation.
Constant US dollars are not PPP dollars
Constant 2015 US dollars adjust a dollar-denominated series for price changes through time. PPP dollars are designed to account for cross-country differences in price levels and purchasing power.
PPP is often more suitable for comparing material purchasing power, while constant US-dollar GNI per capita is useful for real-income comparisons expressed on a common dollar base.
The Atlas method is a different GNI-per-capita concept
The World Bank also publishes Atlas-method GNI per capita, widely used for income classifications. The Atlas conversion factor smooths exchange-rate effects using a different methodology from this constant-2015-dollar series.
Atlas-method values, current US dollars, constant US dollars, and PPP international dollars should not be treated as interchangeable because their conversion and price adjustments answer different questions.
A real income level is not the same as a growth rate
This series reports the level of real GNI per person. Annual percentage growth is a separate indicator. A high-income economy can grow slowly, while a lower-income economy can record a high growth rate.
Level and growth should therefore be analyzed separately: one describes where an economy stands, the other how quickly it is changing.
Population changes also affect the per-capita figure
GNI per capita divides total GNI by population. Total national income can rise while the per-capita measure changes little if population grows rapidly. The reverse can also occur when population growth is slow or negative.
That makes GNI per capita different from aggregate GNI. One describes income scale for the whole economy; the other standardizes by population.
GNI per capita is not average household take-home income
GNI is a national-accounts measure, not a survey average of household paychecks or disposable income. It includes income accruing across institutional sectors and does not directly describe how income is distributed among households.
Household disposable income, consumption, poverty, and distributional indicators are needed for questions about actual household living standards and inequality.
The country mean is not the population-weighted world average
The $16,363 simple mean gives each of the 203 economies equal weight. A country with hundreds of millions of residents and a small island economy each count once.
A true world per-capita average would require population weights or global GNI divided by global population. The mean and median here summarize the cross-country distribution only.
Source and calculation notes
The source is World Bank World Development Indicators series NY.GNP.PCAP.KD, based on official statistics, national statistical organizations or central banks, national accounts, OECD files, and World Bank estimates. The analysis uses 203 latest non-empty observations and separately reviews the 100 observations from 2025. The official World Bank API provides the series.
All 203 reported country codes are joined to geographic centroids for the map, producing a 100% match. Larger points mark 2025 observations and smaller points earlier years. Missing economies are not converted to zero.
Frequently Asked Questions
Is GNI per capita the same as GDP per capita?
No. GNI adjusts GDP for primary income received from abroad and paid abroad before dividing by population.
Are constant 2015 US dollars the same as PPP dollars?
No. Constant dollars adjust price changes through time, while PPP adjusts cross-country price-level and purchasing-power differences.
Are all 203 observations from 2025?
No. 100 are from 2025, 48 from 2024, and 44 have 2015 as their latest non-empty observation.
Related Articles
Green Map creates custom-edited map images using open geographic data sources such as geoBoundaries, Natural Earth, OpenStreetMap, and government open data. These maps are edited visual materials, not raw data files, and are provided for education, documents, presentations, and graphic reference.