World Bank indicator EG.USE.COMM.FO.ZS measures fossil-fuel energy consumption as a percentage of total energy consumption. Fossil fuels include coal, oil and petroleum products, and natural gas. The underlying source is the International Energy Agency’s Energy Statistics. For this repaired comparison, 146 recent comparable economy observations from 2022 and 2023 are used. Their median fossil-fuel share is 74.15% and the simple mean is 66.67%.
The denominator is total energy consumption, not electricity generation. This distinction is fundamental. Transport fuels, industrial heat and building energy are part of the broader energy system, so a country can have relatively clean electricity while still relying heavily on oil or gas in the rest of its economy.
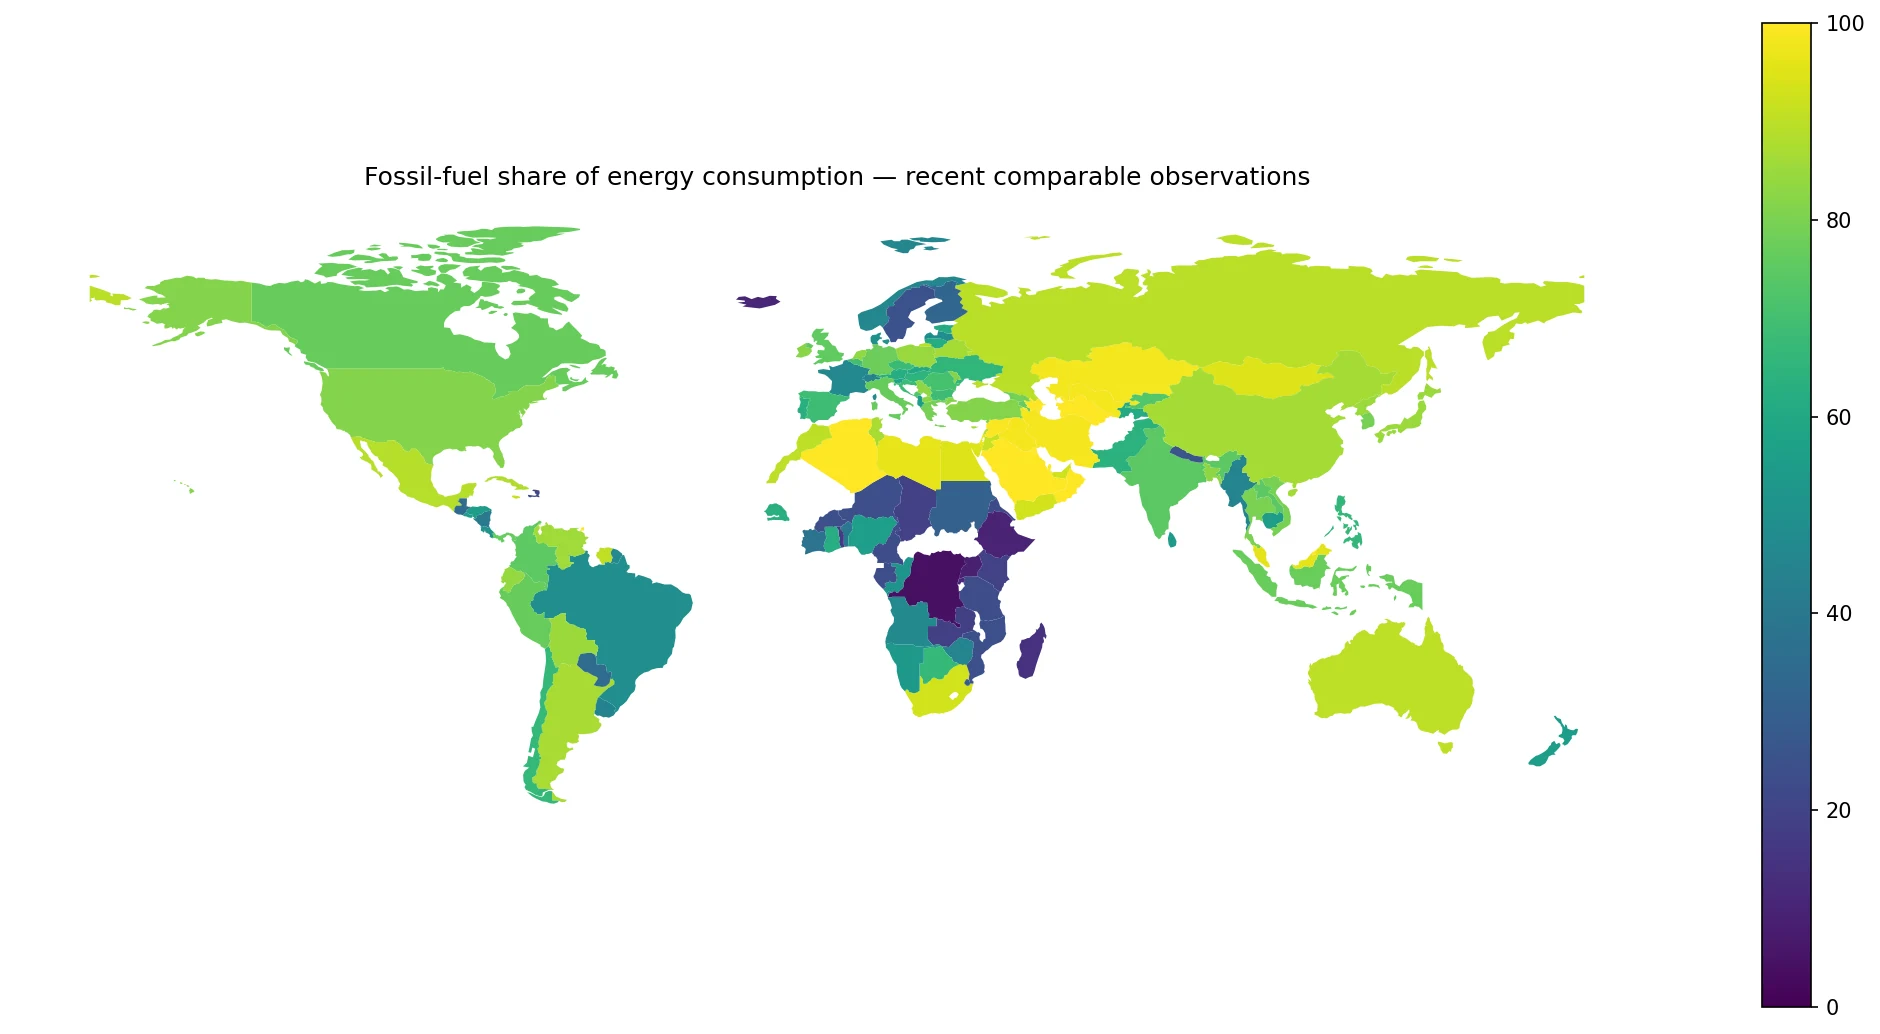
Table of Contents
The indicator is a share of the energy mix
A value of 80% means that roughly four fifths of total energy consumption comes from coal, oil and petroleum products, or natural gas. The remaining share may include hydro, nuclear, wind, solar, geothermal, bioenergy and other non-fossil sources. The indicator does not reveal the internal fossil-fuel mix, so two economies at 80% can have very different coal, oil and gas profiles.
It also does not measure absolute fuel consumption. A large economy with a 60% share can consume far more fossil energy than a small economy at 100%. For questions about emissions, import dependence or fuel demand, the share needs to be paired with energy volumes, population, GDP and emissions data.
The recent comparable median is 74.15%
Across the 146 observations, the median is 74.15% and the mean 66.67%. The middle half lies between 49.55% and 87.15%. There are 19 economies below 25%, 18 from 25% to under 50%, 38 from 50% to under 75%, 41 from 75% to under 90%, and 30 at 90% or above.
The mean is below the median because a meaningful group of economies occupies the low end of the distribution. At the same time, 30 economies are at 90% or more. The result is a very wide global range, from systems dominated by fossil fuels to systems where non-fossil energy plays a much larger role.
Five economies are at 100% in the recent comparable set
Azerbaijan, Bahrain, Brunei Darussalam, Algeria and Turkmenistan each record 100.0% in 2022. Kuwait, Qatar, Saudi Arabia and Trinidad and Tobago are at 99.9%, while Oman is at 99.7%. These observations show energy systems in which fossil fuels account for nearly all reported total energy consumption.
A high share should not automatically be described as low energy efficiency or the highest carbon emissions. Efficiency concerns energy used per unit of output, while emissions depend on both the quantity and type of fossil fuel. The share answers a narrower question: how the energy mix is composed.
| Economy | Observation year | Fossil-fuel share |
|---|---|---|
| Azerbaijan | 2022 | 100.0% |
| Bahrain | 2022 | 100.0% |
| Brunei Darussalam | 2022 | 100.0% |
| Algeria | 2022 | 100.0% |
| Turkmenistan | 2022 | 100.0% |
| Kuwait | 2022 | 99.9% |
| Qatar | 2022 | 99.9% |
| Saudi Arabia | 2022 | 99.9% |
| Trinidad and Tobago | 2022 | 99.9% |
| Oman | 2022 | 99.7% |
Nineteen economies are below 25%
The Democratic Republic of the Congo is lowest at 4.0% in 2022, followed by Uganda at 8.7%, Ethiopia at 9.7%, Iceland at 10.3% in 2023, Rwanda at 11.6%, Madagascar at 14.0%, Togo at 16.9%, Zambia at 18.4%, Chad at 19.5% and Kenya at 19.8% in 2023.
The reasons for low fossil shares differ. Some systems rely heavily on hydro or geothermal resources, while others have large roles for traditional biomass. A low fossil-fuel share is therefore not automatically evidence of a modern clean-energy transition. Energy access, fuel quality and the type of non-fossil energy matter.
| Economy | Observation year | Fossil-fuel share |
|---|---|---|
| Congo, Dem. Rep. | 2022 | 4.0% |
| Uganda | 2022 | 8.7% |
| Ethiopia | 2022 | 9.7% |
| Iceland | 2023 | 10.3% |
| Rwanda | 2022 | 11.6% |
| Madagascar | 2022 | 14.0% |
| Togo | 2022 | 16.9% |
| Zambia | 2022 | 18.4% |
| Chad | 2022 | 19.5% |
| Kenya | 2023 | 19.8% |
The synchronized 2023 subset has a median of 67.25%
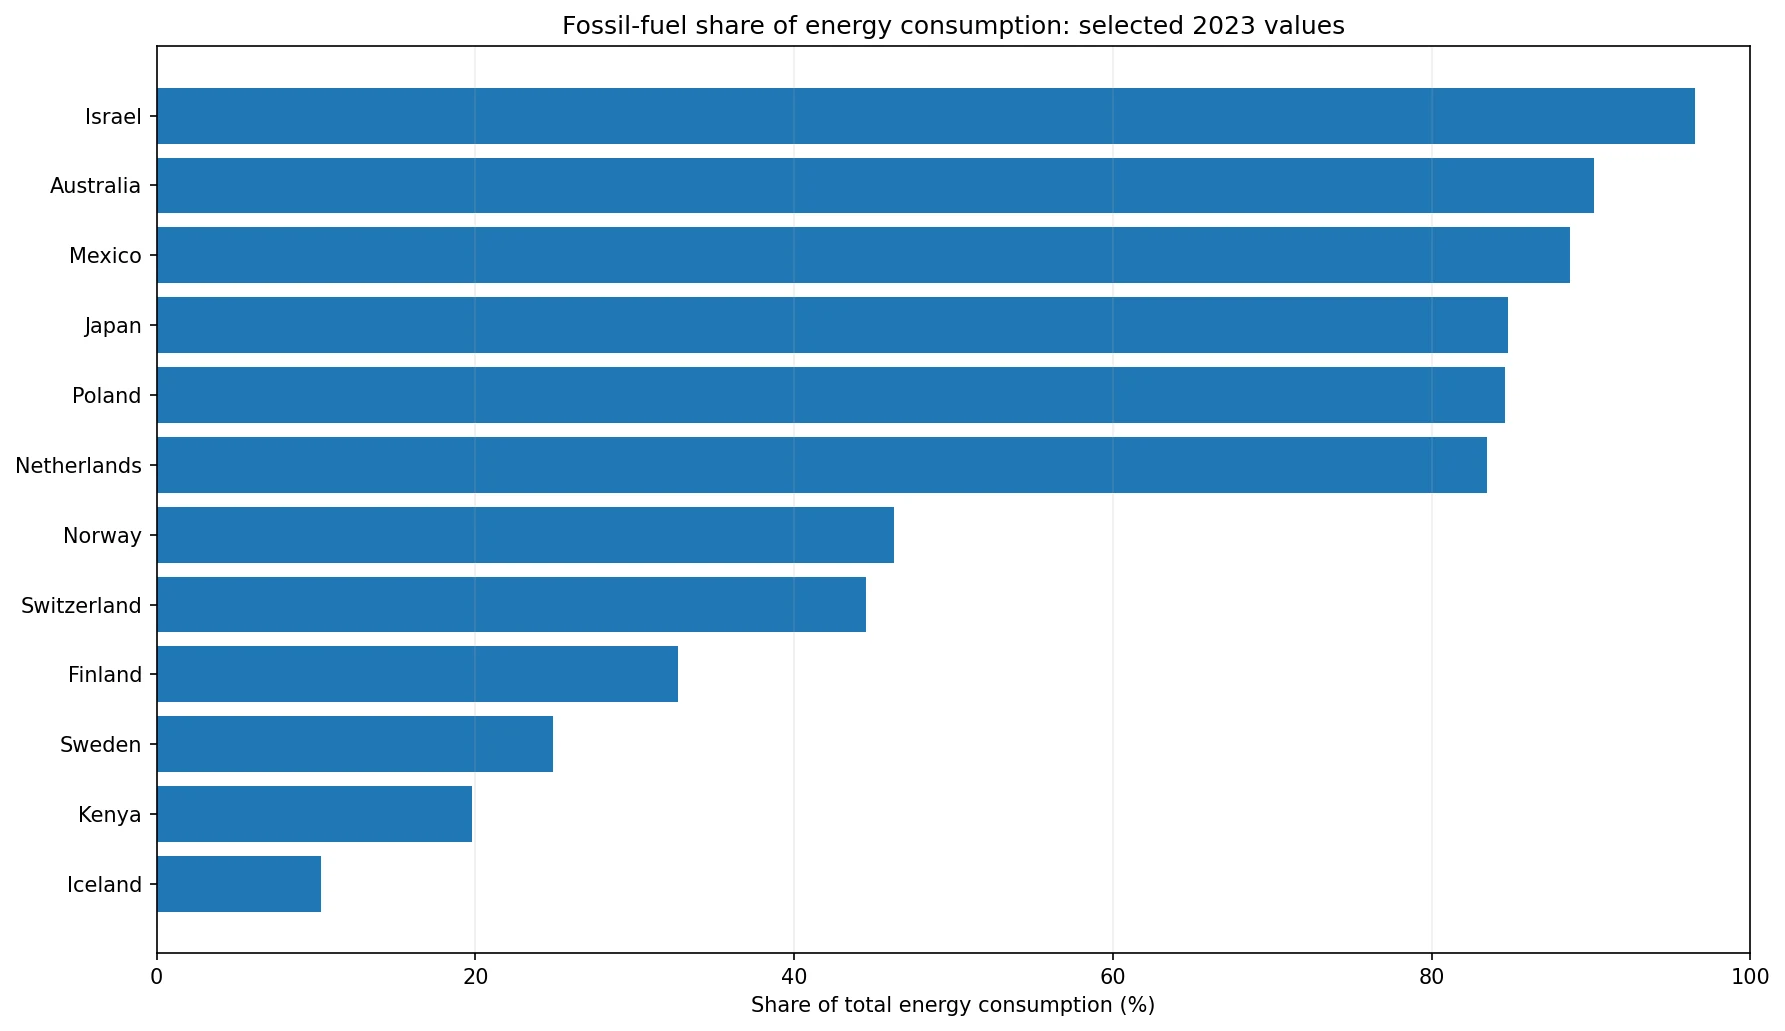
Restricting the comparison to the 40 economies observed in 2023 gives a median of 67.25% and a mean of 64.11%. The middle half ranges from 51.12% to 79.03%. This subset is not a complete global sample, but it avoids mixing observation years.
Within 2023, Israel records 96.5%, Australia 90.2%, Mexico 88.7%, Japan 84.8%, Poland 84.6% and the Netherlands 83.5%. At the low end, Iceland is at 10.3%, Kenya 19.8%, Sweden 24.9%, Finland 32.7%, Switzerland 44.5% and Norway 46.3%.
Total energy and electricity can tell different stories
Electricity is only one part of final and primary energy systems. Road transport, aviation, shipping, industrial furnaces and building heat often use fossil fuels directly. A power sector can decarbonize faster than these other uses, leaving the total-energy fossil share relatively high.
The reverse can also occur. An economy may have fossil-heavy electricity but a lower total-energy share because biomass, hydro, geothermal or other sources play large roles outside the power sector. That is why a fossil-fuel electricity-share map and this total-energy indicator are related but not interchangeable.
Renewable-energy shares are not always a simple complement
It is tempting to subtract the fossil share from 100% and call the remainder renewable energy. That is not generally valid. Nuclear energy is non-fossil but not renewable, and World Bank renewable-energy indicators may use total final energy consumption as a different denominator.
Indicator identities matter. A 70% fossil-fuel share does not automatically imply a 30% renewable share unless the categories and denominators are exactly aligned. Comparing energy indicators requires checking both the energy boundary and the accounting basis.
The repaired comparison contains 2022 and 2023 observations
Of the 146 comparable recent observations, 106 are from 2022 and 40 are from 2023. The two years are close, but energy prices, weather, industrial activity and fuel availability can move national energy mixes. The combined set is therefore described as recent comparable observations rather than a single-year ranking.
Large structural differences—such as 100% versus 20%—remain informative in a recent-value map. Small decimal ranking differences are less suitable when observation years differ. For precise ranking, a synchronized year is preferable, which is why the 2023 subset is reported separately.
Recent zero-filled rows in the input package were not treated as real energy shares
The automated source file supplied with the package contained recent rows in which nearly every economy was recorded as 0%. That pattern is inconsistent with the World Bank definition and with the separately distributed World Bank/ESG values for the same indicator. Those zero-filled rows were therefore not used as substantive observations.
For example, the comparable distribution reports the United States at 81.6% in 2023, Japan at 84.8% and Brazil at 49.4%. Treating later zero-filled API rows as genuine zero fossil-fuel consumption would create a severe distortion of the underlying energy mix.
A fossil-fuel share is not the same as a carbon-emissions indicator
The indicator is closely related to carbon dependence, but it does not measure greenhouse-gas emissions directly. Coal, oil and natural gas have different carbon intensities, and two economies with the same fossil share can consume very different total quantities of energy. Emissions analysis requires fuel volumes and carbon data.
Production is also different from consumption. A major oil or gas producer can export much of its output, while a non-producer can import fossil energy. EG.USE.COMM.FO.ZS describes the composition of energy consumed within the economy.
The main pattern in the recent comparable data
The median fossil-fuel share is 74.15% across 146 economies. Thirty are at or above 90%, while 19 are below 25%. The range from 4.0% to 100% shows that national energy systems remain highly heterogeneous rather than converging on a single mix.
Three interpretation rules are especially important: the denominator is total energy consumption, not electricity; the percentage is not an absolute fuel volume or emissions measure; and the repaired comparison mixes 2022 and 2023, so observation years must remain visible.
Source and interpretation limits
The indicator code is EG.USE.COMM.FO.ZS in World Development Indicators. The World Bank defines fossil fuel as coal, oil and petroleum products, and natural gas; the unit is percent of total energy consumption. The underlying source is the International Energy Agency Energy Statistics Data Browser.
This completed article preserves the anomalous automated source for provenance and adds a repaired 2022–2023 comparison file based on World Bank/ESG values. Public analysis uses the repaired comparable observations rather than the implausible recent zero-filled rows.
Frequently Asked Questions
Is this the fossil-fuel share of electricity generation?
No. It is the fossil-fuel share of total energy consumption, including energy used in transport, industry and buildings as well as electricity.
Does a 70% fossil share imply a 30% renewable share?
Not necessarily. Nuclear is non-fossil but not renewable, and renewable-energy indicators may use a different denominator.
Why were the recent zero-filled rows not used?
They formed an anomalous pattern inconsistent with separately distributed World Bank/ESG values, so the article uses repaired comparable 2022–2023 observations instead.
Related Articles
Green Map creates custom-edited map images using open geographic data sources such as geoBoundaries, Natural Earth, OpenStreetMap, and government open data. These maps are edited visual materials, not raw data files, and are provided for education, documents, presentations, and graphic reference.