World Bank indicator NY.GDP.PCAP.PP.KD measures GDP per capita at purchasing power parity in constant 2021 international dollars. For the 185 economies with a reported 2025 value, the median is 17,265 international dollars and the mean is 26,977. PPP adjusts for differences in price levels across economies, while the constant-2021 basis holds the price reference fixed so the measure is better suited to comparing real output levels rather than changes caused only by inflation.
The spread is extremely wide. Singapore records 139,593 international dollars, followed by Ireland at 131,338, Luxembourg at 127,421, Macao at 117,098 and Qatar at 110,136. At the lower end, Burundi is at 1,067, the Central African Republic 1,123, Somalia 1,404, Mozambique 1,451 and Malawi 1,623. Even on a common PPP and constant-price scale, the gap between the highest and lowest observations exceeds one hundred times.
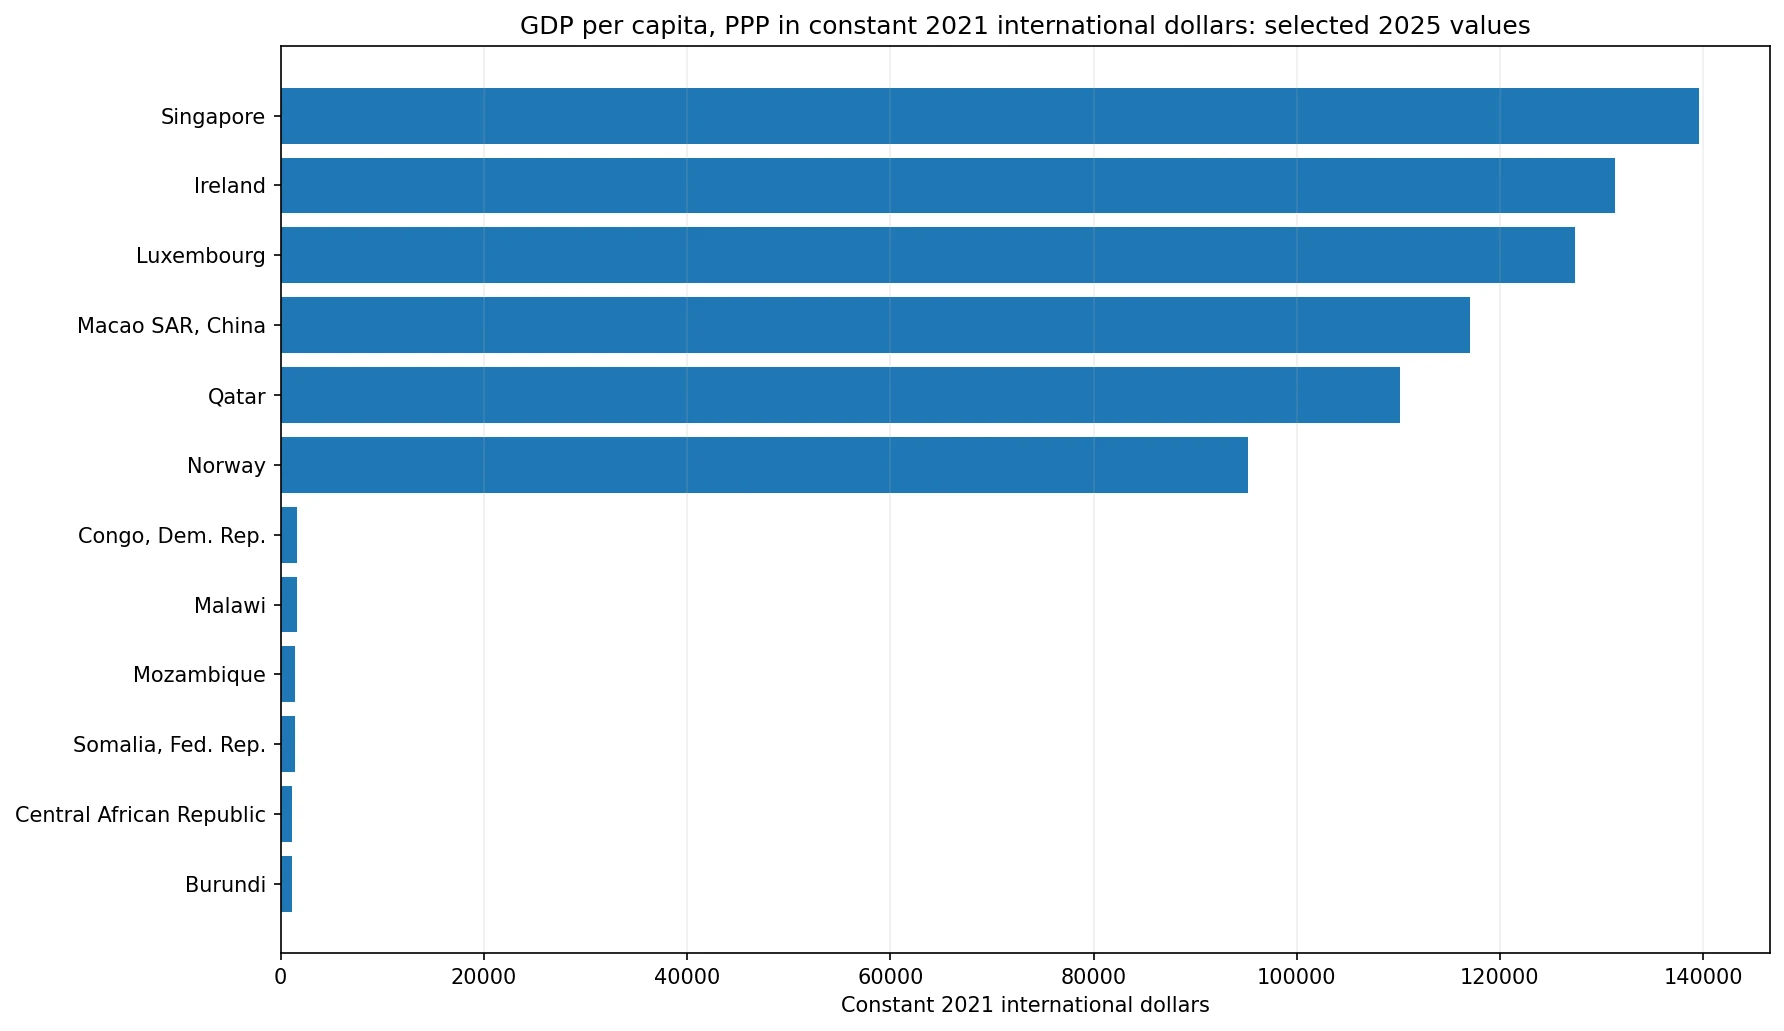
Table of Contents
What constant 2021 international dollars mean
An international dollar is a comparison unit designed to have purchasing power similar to one U.S. dollar in the United States. PPP conversion adjusts for differences in the prices of goods and services across economies, reducing the distortion that can arise when market exchange rates are used to compare domestic output. The result is particularly useful when the question is how much real economic output per person can buy within different price environments.
The phrase “constant 2021” adds a second adjustment. Rather than allowing each year’s price level to change the unit, the series expresses output using a fixed 2021 price basis. This helps separate changes in real production from changes in prices over time. The international dollar is still an analytical unit rather than a currency that households can exchange or spend.
GDP per capita is average output, not household income
GDP per capita divides the value of final goods and services produced in an economy by population. It includes forms of economic value that do not appear as household cash income, such as corporate profits, government production and depreciation. A value of 50,000 international dollars therefore does not mean the average person receives 50,000 dollars of disposable income.
The measure also says nothing directly about how income is distributed. Two economies with the same GDP per capita can have very different median incomes, poverty rates, public services and wealth distributions. Household income, consumption, inequality and access to services are needed when the question shifts from average production to living conditions.
The 2025 median is 17,265 international dollars
The median across 185 economies is 17,265 international dollars. The middle half of observations lies between 6,726 and 40,846. The mean is 26,977, substantially above the median because a relatively small group of very high-income economies pulls the arithmetic average upward. The distribution is therefore strongly right-skewed.
30 economies are at or above 50,000 international dollars and 82 are at or above 20,000. At the lower end, 61 are below 10,000 and 36 are below 5,000. These broad bands make the global spread easier to understand than a single mean or a fine-grained ranking of every economy.
Singapore, Ireland and Luxembourg sit at the top of the 2025 distribution
Singapore has the highest reported value at 139,593 international dollars. Ireland follows at 131,338, Luxembourg at 127,421, Macao at 117,098 and Qatar at 110,136. Norway records 95,173, Switzerland 85,732, Guyana 83,659, Brunei Darussalam 78,985 and the United States 76,931.
These figures describe output per resident under a common price-adjusted framework. They should not be interpreted as direct measures of household welfare. Population size, industrial structure, capital-intensive sectors, cross-border economic activity and the relationship between domestic production and resident income can all influence GDP per capita. The indicator records the outcome, not the mechanism behind it.
| Economy | Year | GDP per capita (constant 2021 international $) |
|---|---|---|
| Singapore | 2025 | 139,593 |
| Ireland | 2025 | 131,338 |
| Luxembourg | 2025 | 127,421 |
| Macao SAR, China | 2025 | 117,098 |
| Qatar | 2025 | 110,136 |
| Norway | 2025 | 95,173 |
| Switzerland | 2025 | 85,732 |
| Guyana | 2025 | 83,659 |
| Brunei Darussalam | 2025 | 78,985 |
| United States | 2025 | 76,931 |
The lower end falls to around 1,000–2,000 international dollars
Burundi records 1,067 international dollars, followed by the Central African Republic at 1,123, Somalia at 1,404, Mozambique at 1,451, Malawi at 1,623, the Democratic Republic of the Congo at 1,641, Madagascar at 1,668, Liberia at 1,693, Niger at 1,861 and Sudan at 1,873.
Low GDP per capita is an important signal of limited average economic output, but it does not summarize every dimension of welfare. Subsistence activity, nonmarket production, public services, distribution and local price structures can affect living conditions beyond what GDP captures. Country statistics can also be affected by data limitations and recent economic disruptions, so the values are best read as standardized macroeconomic estimates rather than complete descriptions of daily life.
| Economy | Year | GDP per capita (constant 2021 international $) |
|---|---|---|
| Burundi | 2025 | 1,067 |
| Central African Republic | 2025 | 1,123 |
| Somalia, Fed. Rep. | 2025 | 1,404 |
| Mozambique | 2025 | 1,451 |
| Malawi | 2025 | 1,623 |
| Congo, Dem. Rep. | 2025 | 1,641 |
| Madagascar | 2025 | 1,668 |
| Liberia | 2025 | 1,693 |
| Niger | 2025 | 1,861 |
| Sudan | 2025 | 1,873 |
Current PPP dollars and constant PPP dollars are different series
A related World Bank indicator reports GDP per capita at PPP in current international dollars. That series uses the price framework appropriate to each period, while NY.GDP.PCAP.PP.KD expresses the values in constant 2021 international dollars. The two can produce different numbers for the same economy and year even though both use PPP concepts.
Current PPP values are useful for describing the size of an economy at the price level relevant to the current period. Constant PPP values are more useful when the goal is to compare real output levels or changes over time without allowing inflation alone to raise the series. A difference between the two is therefore not an error; it reflects a different measurement basis.
Market-exchange-rate GDP per capita can also tell a different story
GDP per capita in current U.S. dollars converts local-currency GDP using market exchange rates. Exchange rates can move quickly because of financial conditions even when domestic production and local prices change much less. PPP conversion reduces the influence of those exchange-rate swings by comparing price levels across economies.
That does not make one measure universally superior. Market-dollar GDP is relevant for foreign-currency transactions and financial size, while PPP GDP is often more informative for comparing real domestic purchasing power and production levels. The appropriate series depends on the question being asked.
Thirty-two economies have no reported 2025 value
The fixed-year World Bank data contain 217 country and economy rows. Of those, 185 have a numeric 2025 observation and 32 are missing for 2025. Missing values are not replaced with zero. A zero would imply essentially no measured output per person, which is completely different from the absence of a reported observation.
A separate latest-value series contains 199 non-missing economy observations, but 14 of those are from 2024 or earlier. That series is useful for broad geographic coverage, while the fixed-2025 set is cleaner for a same-year comparison. Keeping the two purposes separate avoids presenting older observations as if they were 2025 data.
| Data status | Economies | Treatment |
|---|---|---|
| 2025 | 185 | Main same-year comparison |
| 2025 missing | 32 | Kept missing, not replaced with zero |
| 2024 in latest-value series | 10 | Excluded from the 2025 comparison |
| 2022–2023 in latest-value series | 4 | Excluded from the 2025 comparison |
The large spread is descriptive, not a complete explanation
The first quartile is about 6,726 international dollars and the third quartile about 40,846, so even the middle half spans roughly a sixfold range. The full range from about 1,067 to 139,593 is much wider. Differences in productivity, capital, industry structure, resources, demography, institutions and investment may all contribute.
This single indicator cannot quantify the contribution of those factors. Explaining why an economy is high or low requires complementary evidence on labor productivity, employment, sectoral value added, investment, education, population structure and other variables. The current comparison stays with what the data can support directly: the scale, distribution and interpretation of real PPP GDP per capita.
The clearest takeaway from the 2025 comparison
The strongest result is the scale of cross-economy differences. The median is 17,265 international dollars, yet the top five observations exceed 110,000 while several economies remain below 2,000. The mean of 26,977 sits well above the median, confirming that the upper tail is unusually influential.
Three rules keep the measure clear. PPP adjusts for differences in price levels across economies. The constant-2021 basis holds the price reference fixed over time. And GDP per capita is average economic output per resident, not household income or an inequality measure. With those distinctions, this series can be compared without confusing it with nearby GDP indicators.
Source and interpretation limits
The source is World Bank World Development Indicators series NY.GDP.PCAP.PP.KD. The unit is GDP per capita at PPP in constant 2021 international dollars. The main comparison uses the 185 economies with a reported 2025 value. Thirty-two missing 2025 observations remain missing, and economies whose most recent non-missing value is from an earlier year are not mixed into the same-year ranking.
A useful follow-up would compare this series with current-PPP GDP per capita, market-exchange-rate GDP per capita, GNI per capita and household consumption per person. Those measures separate production, national income, purchasing power and consumption and help show why no single per-capita indicator can answer every living-standard question.
Frequently Asked Questions
What are constant 2021 international dollars?
They are a PPP-adjusted comparison unit with the price reference fixed at 2021, designed for comparing real output across economies and over time.
How is this different from current international-dollar PPP?
Current PPP values reflect the price framework of each period, while constant 2021 international dollars hold the price basis fixed.
Is GDP per capita the same as average household income?
No. GDP per capita is average economic output per resident and does not directly measure household income or income distribution.
Related Articles
Green Map creates custom-edited map images using open geographic data sources such as geoBoundaries, Natural Earth, OpenStreetMap, and government open data. These maps are edited visual materials, not raw data files, and are provided for education, documents, presentations, and graphic reference.