Among the 131 countries and economies with a 2025 observation, the median real growth rate of general government final consumption expenditure was 2.46%. Uganda recorded the highest rate at 28.89%, followed by Guinea at 22.80% and Georgia at 19.64%. At the other end, Chad posted the largest contraction at -16.55%. The wide distance between the positive and negative extremes shows that government consumption moved very differently across countries in the same year.
The measure is the World Bank indicator `NE.CON.GOVT.KD.ZG`, officially titled General government final consumption expenditure (annual % growth). It tracks the year-over-year real change in government final consumption, a national-accounts category that includes current purchases of goods and services and compensation of employees, among other items. Because it is a constant-price growth measure, it should not be treated as a nominal budget growth rate.
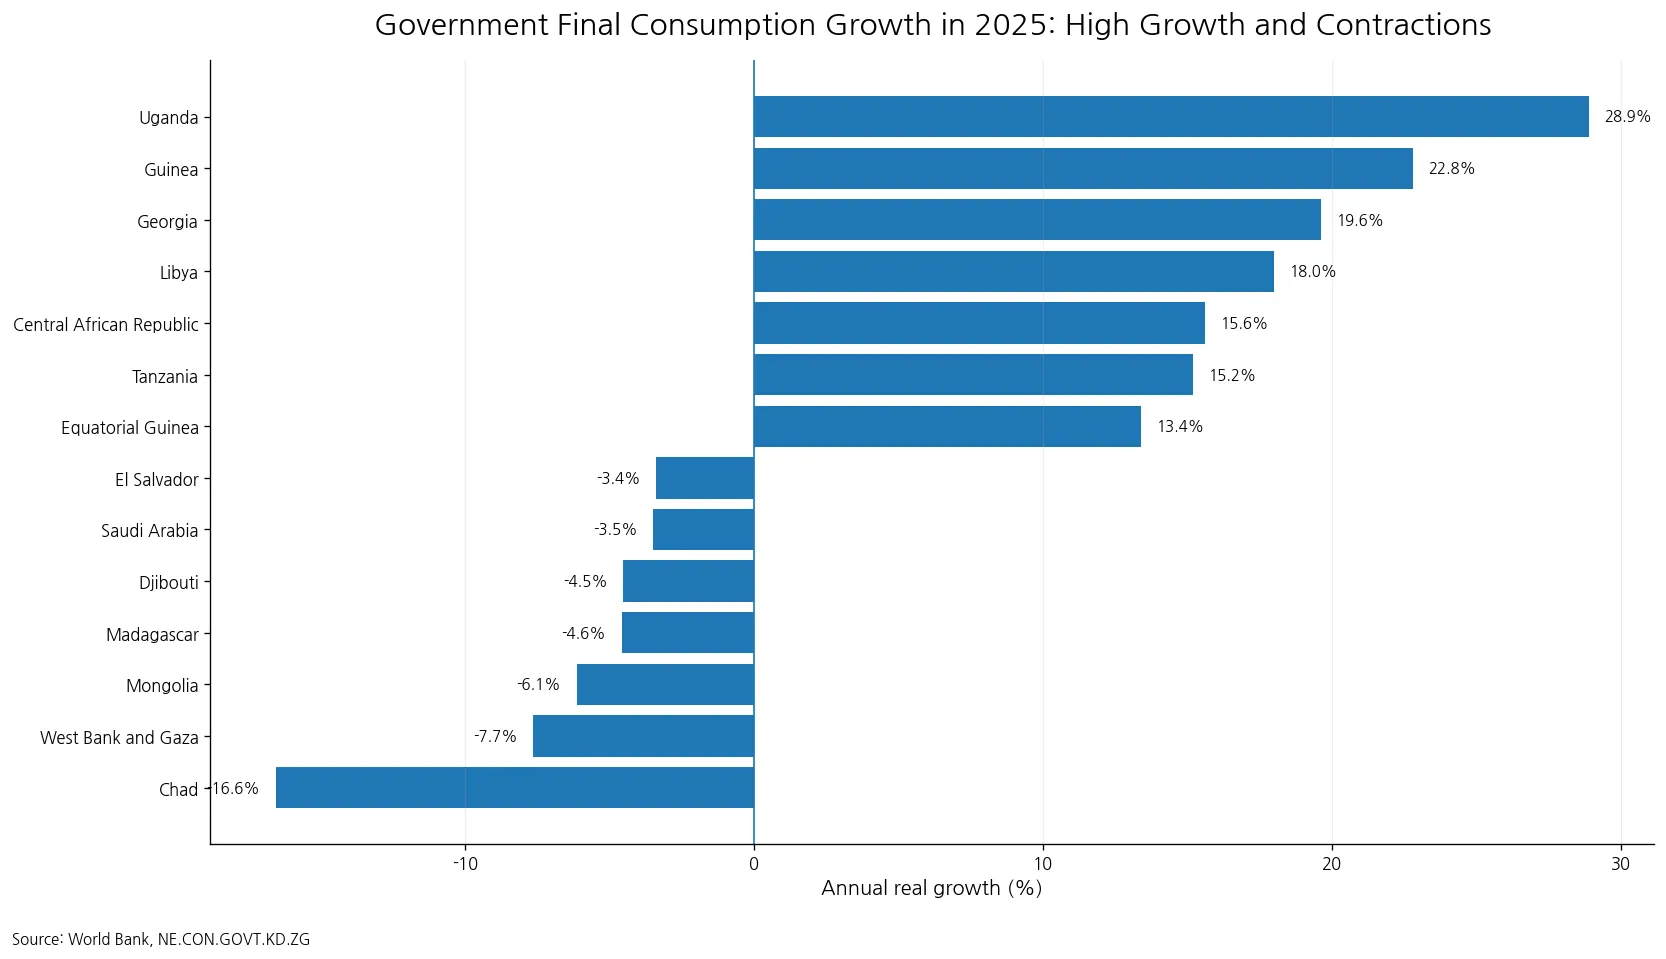
Table of Contents
The 2025 comparison uses 131 same-year observations
The source file contains the most recent non-empty observation for 175 countries and economies, but the observation years are not identical. There are 131 values from 2025, 30 from 2024, 4 from 2023, and 10 from 2022 or earlier. Ranking all 175 values as if they described 2025 would mix different fiscal and economic conditions and could make old outliers look current.
For that reason, the rankings, distribution statistics, and chart in this article use only the 131 observations dated 2025. The remaining observations are still useful as the latest available value for their respective places, but they answer a different question. A latest-observation dataset maximizes geographic coverage; a same-year comparison maximizes temporal consistency. Keeping those purposes separate is essential.
| Observation year | Countries/economies |
|---|---|
| 2025 | 131 |
| 2024 | 30 |
| 2023 | 4 |
| 2022 or earlier | 10 |
Several countries recorded double-digit growth
Uganda led the 2025 group at 28.89%, followed by Guinea at 22.80%, Georgia at 19.64%, and Libya at 18.00%. Central African Republic and Tanzania were also above 15%. In total, 14 of the 131 observations were at least 10%, while 39 were at least 5%. Double-digit growth was therefore clearly present, but it was not the typical outcome for the full group.
A high growth rate is not the same thing as a large government sector. The indicator measures change from the previous year, not the amount of spending and not the share of GDP devoted to government consumption. A country starting from a relatively small base can record a large percentage increase, while a country with a much larger absolute level can show a modest growth rate if spending changed little from the year before.
| Country/economy | 2025 growth rate |
|---|---|
| Uganda | 28.89% |
| Guinea | 22.80% |
| Georgia | 19.64% |
| Libya | 18.00% |
| Central African Republic | 15.60% |
| Tanzania | 15.19% |
| Equatorial Guinea | 13.39% |
| Nepal | 12.02% |
| Viet Nam | 11.89% |
| Gambia, The | 11.45% |
Twenty-two 2025 observations were negative
Of the 131 same-year observations, 108 were positive, 22 were negative, and 1 was exactly zero. Chad recorded the largest decline at -16.55%, followed by West Bank and Gaza at -7.66% and Mongolia at -6.14%. Only 3 places were at or below -5%, so very large contractions were less common than strong positive increases in the 2025 distribution.
A negative rate means real government final consumption was lower than in the previous year. It does not, by itself, identify the cause. Budget policy, the end of temporary programs, changes in public-service demand, revisions to national accounts, or unusual spending in the base year can all affect the annual rate. Establishing a cause requires country-level fiscal and national-accounts evidence beyond this single series.
| Country/economy | 2025 growth rate |
|---|---|
| Chad | -16.55% |
| West Bank and Gaza | -7.66% |
| Mongolia | -6.14% |
| Madagascar | -4.59% |
| Djibouti | -4.53% |
| Saudi Arabia | -3.49% |
| El Salvador | -3.38% |
| Congo, Dem. Rep. | -3.36% |
| Romania | -2.59% |
| Sao Tome and Principe | -2.55% |
The median was 2.46%, while the mean was 3.65%
The mean across the 2025 observations was 3.65% and the median was 2.46%. The mean exceeded the median by about 1.18 percentage points because the upper tail contains several increases in the 15% to 29% range. The first quartile was 0.79% and the third quartile was 5.92%, meaning the middle half of the observations sat roughly between those two rates.
The difference between the mean and the median matters because a single average can hide an uneven distribution. The mean reflects every value and is pulled upward by large increases. The median identifies the midpoint country after sorting the observations. Quartiles add another layer by showing where the central 50% sits. Together they show that the typical 2025 result was a modest positive increase, with a longer positive tail.
What general government final consumption covers
General government final consumption expenditure is a national-accounts concept focused on current consumption by government. It includes government purchases of goods and services used to provide public services and compensation of employees. It also includes much current spending related to defense and security, while capital formation is treated separately. The boundary is therefore narrower than total government expenditure or the full public budget.
This distinction is important because budgets contain many items that are not government final consumption. Investment, transfers, social benefits, interest payments, and other transactions may be recorded elsewhere in the accounts. Describing this indicator as total government spending growth would overstate its scope. The safer interpretation is growth in the real volume of the government final-consumption component.
Growth is different from government consumption as a share of GDP
Two indicators can contain the same phrase, government consumption, yet answer very different questions. A share-of-GDP measure describes the size of government final consumption relative to the economy in a particular year. The annual growth measure used here describes how the real level changed from the previous year. A country can have a high GDP share and low growth, or a low GDP share and high growth.
For example, if real government consumption rises from an index level of 100 to 110, the growth rate is about 10%. If GDP grows even faster, the government-consumption share of GDP can still fall. Conversely, a nearly unchanged level of government consumption could become a larger GDP share if GDP contracts. Growth and level should therefore be treated as separate dimensions rather than interchangeable measures.
The latest-observation file should not be mistaken for a single-year panel
The full set has 44 observations that are not from 2025. Most of those are fairly recent, including 30 observations from 2024, but some are older. A latest-value collection is useful for maximizing coverage, especially when countries publish national accounts on different schedules. It is less suitable for a strict annual ranking unless the observation year is kept visible.
Older extreme values deserve particular care. A large value from a past year may reflect a historical episode that has little to do with current conditions. This is why the representative chart and the top and bottom tables use the 2025 subset only. If a global map is built from latest observations, the year should be displayed alongside the value or older observations should be visually separated rather than silently treated as 2025 data.
Higher growth does not automatically mean better public services
The indicator records spending change, not service quality, administrative efficiency, fiscal sustainability, or citizen outcomes. Higher spending can support an expansion of services, but it can also reflect higher input costs, temporary responses, or other factors. Likewise, a decline can result from retrenchment, improved efficiency, or the expiration of exceptional spending. Outcome measures are needed before making a performance judgment.
The same caution applies to fiscal risk. A rapid increase in government consumption may be affordable in one country and difficult to finance in another. Debt, revenue, the overall fiscal balance, interest costs, and economic growth all matter. This series contributes one piece of that picture: the direction and size of the real annual change in current government consumption.
Constant-price growth is not nominal budget growth
The World Bank description specifies a constant-price series, so the indicator is designed to capture real rather than purely nominal change. When prices rise quickly, a government can spend more money without purchasing a proportionally larger quantity of goods and services. A real growth rate adjusts for price effects and therefore can differ substantially from the percentage increase shown in a nominal budget document.
This distinction is especially important in cross-country work because inflation environments differ. Comparing nominal increases can make high-inflation countries appear to have unusually fast spending growth even when the real volume changes much less. The real growth indicator does not solve every comparability issue, but it puts the focus on volume change rather than raw currency amounts.
One-year leaders are not necessarily long-term leaders
The 2025 ranking is a cross-section of annual change. It does not show whether Uganda, Guinea, or other high-growth countries have maintained similar rates for several years. A large increase can be a continuation of a trend, a rebound from a weak base, or a one-off movement. Identifying which explanation fits requires a multi-year series for the same indicator.
A longer series would allow analysis of persistence, volatility, sequences of increases or decreases, and changes around major fiscal events. The 2025 value is still useful because it identifies where the latest same-year movements were unusually large. It should simply be treated as one observation in time rather than a complete description of policy direction.
Country comparisons still require attention to statistical context
Using a common World Bank indicator improves consistency, but national accounts can be revised and country publication schedules differ. The 131 same-year observations reduce the timing problem, yet detailed institutional boundaries and statistical practices can still vary. A global indicator is well suited to screening and comparison; a country-specific policy conclusion should be checked against national accounts and budget documents.
Growth rates are also sensitive to the base year. If the previous year was unusually low, a return toward normal spending can produce a large positive percentage. If the previous year contained exceptional spending, the next year can show a negative rate even if the longer-run level remains high. This base effect is another reason not to treat the top and bottom positions as a scorecard.
Summary: positive growth was common, but the range was wide
In the 2025 subset, 108 of 131 observations were positive and 22 were negative. The median was 2.46%, the mean was 3.65%, and the middle half ranged from roughly 0.79% to 5.92%. The distance between Uganda at 28.89% and Chad at -16.55% was 45.45 percentage points, illustrating the size of the cross-country spread.
The key interpretation is to keep growth, level, and share separate. This indicator measures the annual real change in general government final consumption. It is not total budget growth, not the government-consumption share of GDP, and not a direct measure of public-service performance. Comparing countries with the same observation year and checking older values separately provides a cleaner picture of how government consumption changed in 2025.
Frequently Asked Questions
What was the median government final consumption growth rate in 2025?
Across the 131 countries and economies with a 2025 observation, the median was 2.46% and the mean was 3.65%.
Is this the same as total government budget growth?
No. It is the real annual change in the national-accounts category of general government final consumption, not the growth of every item in a government budget.
Can all 175 latest observations be ranked as 2025 values?
No. Only 131 of the 175 latest observations are dated 2025; the rest are from 2024 or earlier, so a same-year ranking should use the 2025 subset.
Related Articles
Green Map creates custom-edited map images using open geographic data sources such as geoBoundaries, Natural Earth, OpenStreetMap, and government open data. These maps are edited visual materials, not raw data files, and are provided for education, documents, presentations, and graphic reference.