The UNESCO Institute for Statistics (UIS) reports a 2023 adjusted gender parity index (GPIA) for the outbound mobility ratio across all destination regions for 116 countries and territories. The reference value is 1. A value of 1 means the female and male outbound mobility ratios are equal within the same origin country. Values below 1 indicate a lower female mobility ratio, while values above 1 indicate a higher female mobility ratio. This is therefore a measure of gender balance in a rate, not a ranking of how many students a country sends abroad.
The 2023 observations were concentrated below the parity point. 81 values were below 0.97, 9 fell in the 0.97–1.03 parity band, and 26 were above 1.03. The mean was 0.805 and the median was 0.825. Montenegro, at 0.99989, was the observation closest to 1. These statistics summarize the cross-country distribution of gender balance in outbound mobility to all destinations, but they do not constitute a general score of gender equality in education.
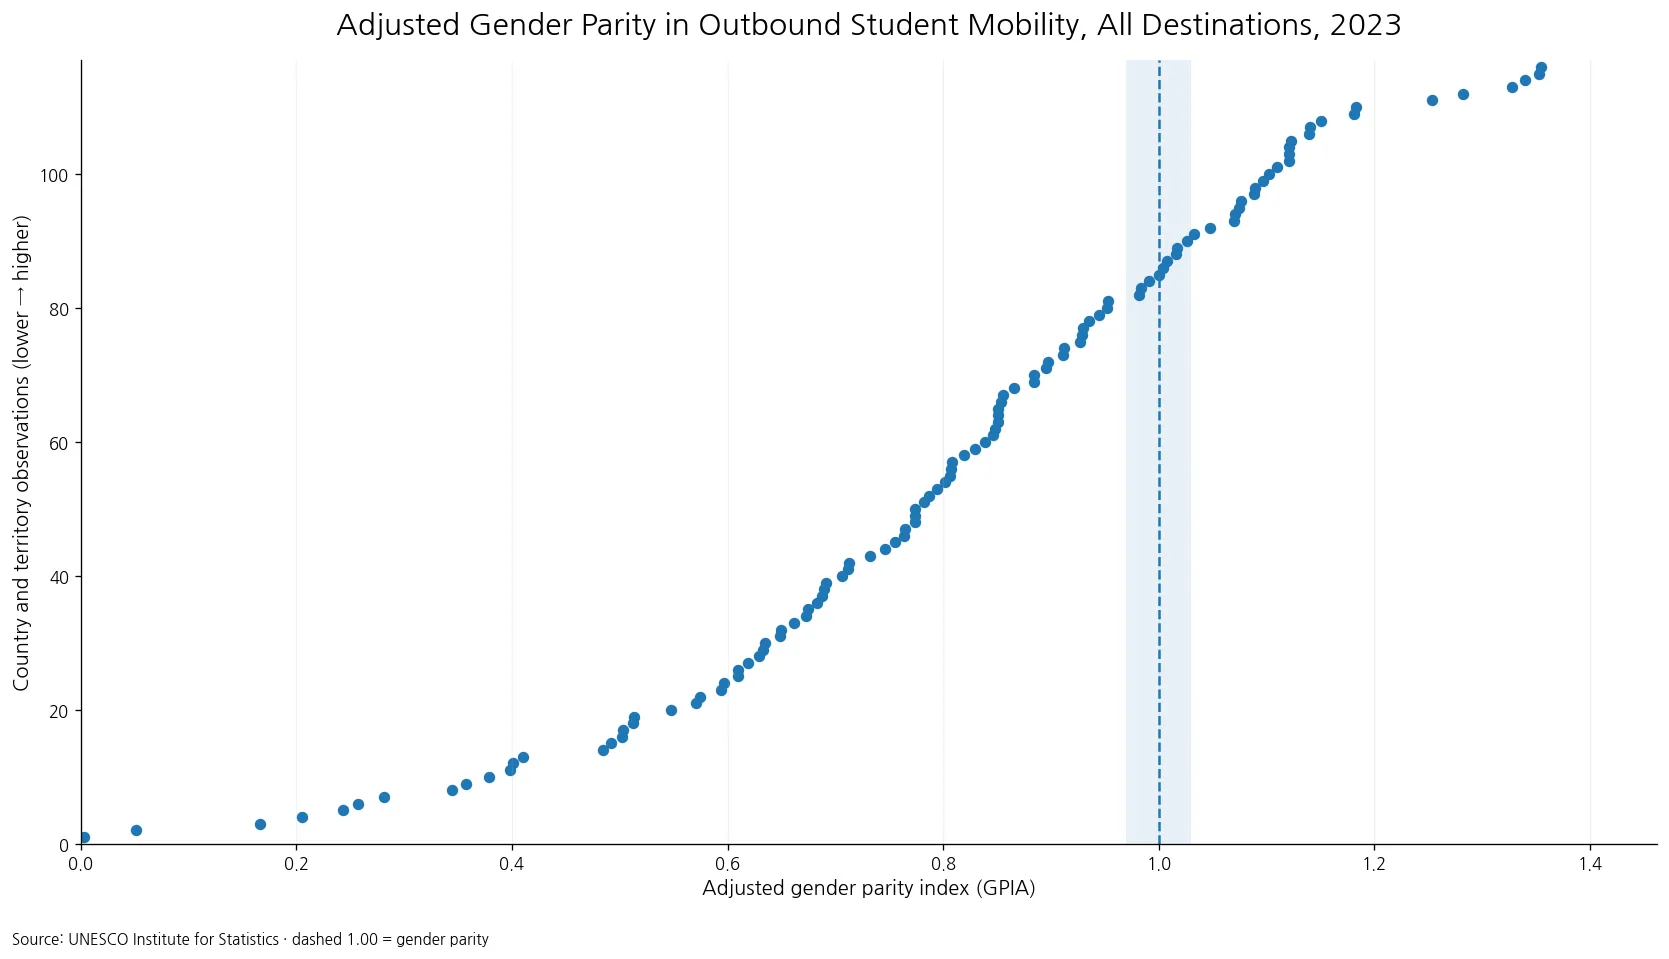
Table of Contents
What the all-destinations GPIA actually measures
The outbound mobility ratio relates students from an origin country who are enrolled in tertiary education abroad to the scale of tertiary enrollment in that origin country. UIS can disaggregate mobility by sex and by destination region. The indicator used here combines all destination regions and then compares the female and male mobility ratios through an adjusted gender parity index. The result is a compact way to compare the balance between two sex-specific rates. It is not the female share of mobile students, and it is not the overall outbound mobility ratio itself.
The phrase “all destinations” matters. A destination-specific indicator can be strongly shaped by language, geography, scholarship routes, academic networks, or particular fields of study. When every destination is combined, some of those differences may offset one another. A country could have a female advantage for mobility to one region and a male advantage for another yet end up close to 1 in the all-destinations measure. For that reason, the all-regions GPIA should not be substituted for a regional destination indicator.
Only nine observations were inside the 0.97–1.03 parity band
Using 0.97–1.03 as the practical parity interval, 9 of 116 observations fell inside the band. Montenegro was nearest to exact parity at 0.99989. Austria followed at 1.00410, France at 1.00779, Serbia at 0.99143, and Thailand at 1.01585. The United States, at 0.98371, was also inside the band.
| Country or territory | 2023 GPIA | Distance from 1 |
|---|---|---|
| Montenegro | 1.000 | 0.000 |
| Austria | 1.004 | 0.004 |
| France | 1.008 | 0.008 |
| Serbia | 0.991 | 0.009 |
| Thailand | 1.016 | 0.016 |
| United States of America | 0.984 | 0.016 |
| Congo | 1.017 | 0.017 |
| Lithuania | 0.982 | 0.018 |
| Ukraine | 1.026 | 0.026 |
| Lao People's Democratic Republic | 1.032 | 0.032 |
Distance from 1 is useful because it treats departures in either direction on the same scale. A value close to 1 means the female and male mobility ratios were similar, but it says nothing about whether both rates were high or low. Two countries can have nearly identical GPIA values even when one has very little outbound mobility and the other has much more. Parity and mobility scale answer different questions and should be reported separately.
The middle of the distribution sat below 1
The mean GPIA across the 116 reported observations was 0.805, while the median was 0.825. The first quartile was 0.635 and the third quartile was 1.010, placing the middle half of observations roughly between those values. 81 observations, or 69.8%, were below 0.97, compared with 26, or 22.4%, above 1.03. If the data are split simply at 1, 85 observations were below 1 and 31 were above it.
This pattern means that lower-female-mobility values were more common in the reported country set in 2023. It does not mean that roughly the same share of the world’s students experienced such a gap. Each country or territory contributes one observation regardless of population, tertiary enrollment, or number of mobile students. The unweighted country mean is therefore a description of the distribution of national indices, not a student-weighted global parity ratio.
The lower and upper tails point in opposite directions
The lowest reported value was Cook Islands at 0.00339. Other low observations included Sint Maarten (Dutch part), Samoa, Tonga, Turkmenistan, Qatar, and Kyrgyzstan. At the upper end, the Republic of Korea recorded 1.35430, followed closely by the Russian Federation, Finland, and Japan. Values in the lower tail indicate a lower female outbound mobility ratio; values in the upper tail indicate the opposite direction.
| Lowest observed GPIA | Value |
|---|---|
| Cook Islands | 0.003 |
| Sint Maarten (Dutch part) | 0.051 |
| Samoa | 0.167 |
| Tonga | 0.206 |
| Turkmenistan | 0.244 |
| Qatar | 0.257 |
| Kyrgyzstan | 0.281 |
| Azerbaijan | 0.345 |
| Pakistan | 0.357 |
| Belize | 0.378 |
| Jordan | 0.398 |
| Egypt | 0.401 |
| Highest observed GPIA | Value |
|---|---|
| Republic of Korea | 1.354 |
| Russian Federation | 1.353 |
| Finland | 1.340 |
| Japan | 1.328 |
| San Marino | 1.282 |
| Romania | 1.253 |
| Poland | 1.183 |
| Philippines | 1.181 |
| Bhutan | 1.151 |
| Croatia | 1.140 |
| Madagascar | 1.139 |
| Norway | 1.123 |
These extremes should not be converted directly into student counts or percentage-point gaps. GPIA is an adjusted parity index built from two underlying rates. A move from 0.30 to 0.60 is not equivalent to a simple doubling of the number of female mobile students, and a value of 1.30 does not mean that 30% more women study abroad. Correct interpretation requires the underlying female and male outbound mobility ratios, and ideally the numerators and denominators used to form them.
Cross-country differences do not identify causes
The index describes an outcome but does not reveal why a country falls above or below 1. Outbound study decisions can be influenced by domestic tertiary capacity, household income, tuition and living costs, scholarship availability, language, field of study, family expectations, visa policy, migration networks, military service, and institutional partnerships. The same GPIA can result from very different combinations of female and male participation.
Combining all destinations also hides destination composition. A country might show relatively high female mobility to Europe but lower female mobility to another region, producing an overall value near parity. Another country may send women and men to very different destinations while maintaining similar total mobility rates. To explain the mechanism behind the all-destinations GPIA, analysts need destination-specific mobility, sex-disaggregated rates, and preferably student counts and study-level information.
The 116 observations are not a complete list of every country in the world
The dataset contains official 2023 values for 116 countries and territories. Many catalogue units do not have a reported value for this indicator and year. Absence must not be treated as zero. A missing value means that no official observation is present in this extract; it does not mean that female outbound mobility is zero, male outbound mobility is zero, or the parity index is zero. The comparison therefore covers the reported observations only.
That distinction also limits rankings. The highest and lowest values shown here are the extremes among the 116 available observations, not guaranteed world-wide extremes across every country and territory. Coverage may also include territories alongside sovereign states. Describing the scope precisely—official national-level observations reported by UIS for 2023—prevents the data from implying more completeness than it has.
A single year cannot show whether parity is improving
Every observation in this comparison refers to 2023. A cross-section can show how countries differed at that point in time, but it cannot establish whether a country moved toward parity, moved away from parity, or remained stable. That requires the same indicator for multiple years. A simple longitudinal measure would be the absolute distance |GPIA−1|, tracked through time for each country.
A proper time-series analysis also needs to handle changing coverage. If a country is missing in one year and reported in the next, the transition must not be interpreted as a rise from zero. Analysts can compare a common set of countries across years, or retain missing observations explicitly in country-level series. Reporting coverage alongside the trend is especially important for international education data, where availability can vary by year.
How to read the 2023 comparison without overinterpreting it
Three rules keep the interpretation aligned with the indicator. First, 1 means balance between female and male outbound mobility ratios, not a large volume of student mobility. Second, this version combines all destination regions; a regional destination indicator may tell a different story. Third, GPIA is a relative, adjusted index and cannot identify the causes of a gap on its own. Those distinctions turn the indicator from a superficial ranking into a useful description of the gender structure of international student mobility.
In the 2023 UIS data, 9 of 116 observations were within 0.97–1.03, 81 were below the band, and 26 were above it. Montenegro was closest to 1, and the median across the reported observations was 0.825. The cross-country spread is informative, but the next analytical step is to connect several years of the same UIS indicator with the original female and male mobility ratios so that both direction and change can be measured.
Frequently Asked Questions
What does a GPIA value of 1 mean?
It means the female and male outbound mobility ratios across all destinations are equal within the same origin country. Values below 1 indicate a lower female rate; values above 1 indicate a higher female rate.
How many observations were in the 0.97–1.03 parity band in 2023?
9 of the 116 official observations were inside the band. Montenegro was closest to 1 at 0.99989.
Does a higher GPIA mean more students study abroad?
No. GPIA is a relative gender-balance index. It does not directly report the number of internationally mobile students or the overall level of outbound mobility.
Related Articles
Green Map creates custom-edited map images using open geographic data sources such as geoBoundaries, Natural Earth, OpenStreetMap, and government open data. These maps are edited visual materials, not raw data files, and are provided for education, documents, presentations, and graphic reference.