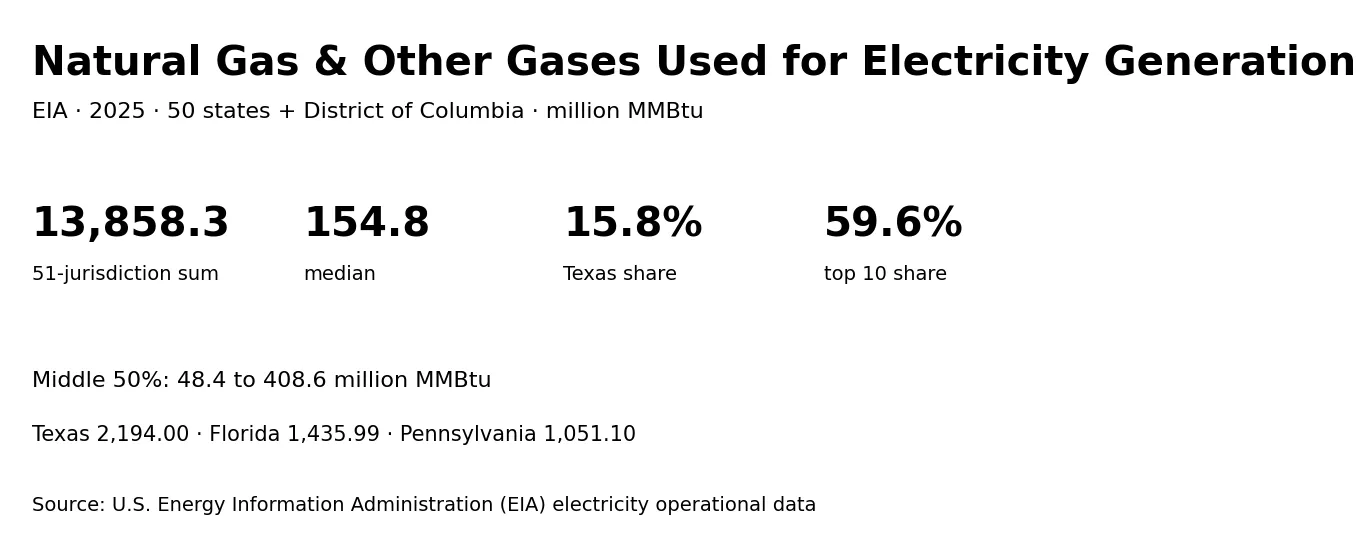
U.S. Energy Information Administration (EIA) data show substantial state variation in the heat content of natural gas & other gases consumed for electricity generation in 2025. The series covers 51 jurisdictions—the 50 states and the District of Columbia—and is reported in million MMBtu. The 51-jurisdiction sum is 13,858.28814, the median is 154.83669, and the mean is 271.73114.
The field definition is important. This is consumption-for-eg-btu, meaning fuel heat content assigned specifically to electricity generation. It is not the broader total-consumption-btu measure that can include fuel associated with useful thermal output. The same fuel label and reference year can therefore produce different values when the operational field changes.
Table of Contents
Texas leads with 2,193.99641 million MMBtu
Texas records 2,193.99641 million MMBtu, about 15.8% of the 51-jurisdiction sum. Florida follows at 1,435.99472, Pennsylvania at 1,051.09918, Ohio at 601.57025, and Louisiana at 554.59564. Texas exceeds Florida by 758.00169 million MMBtu.
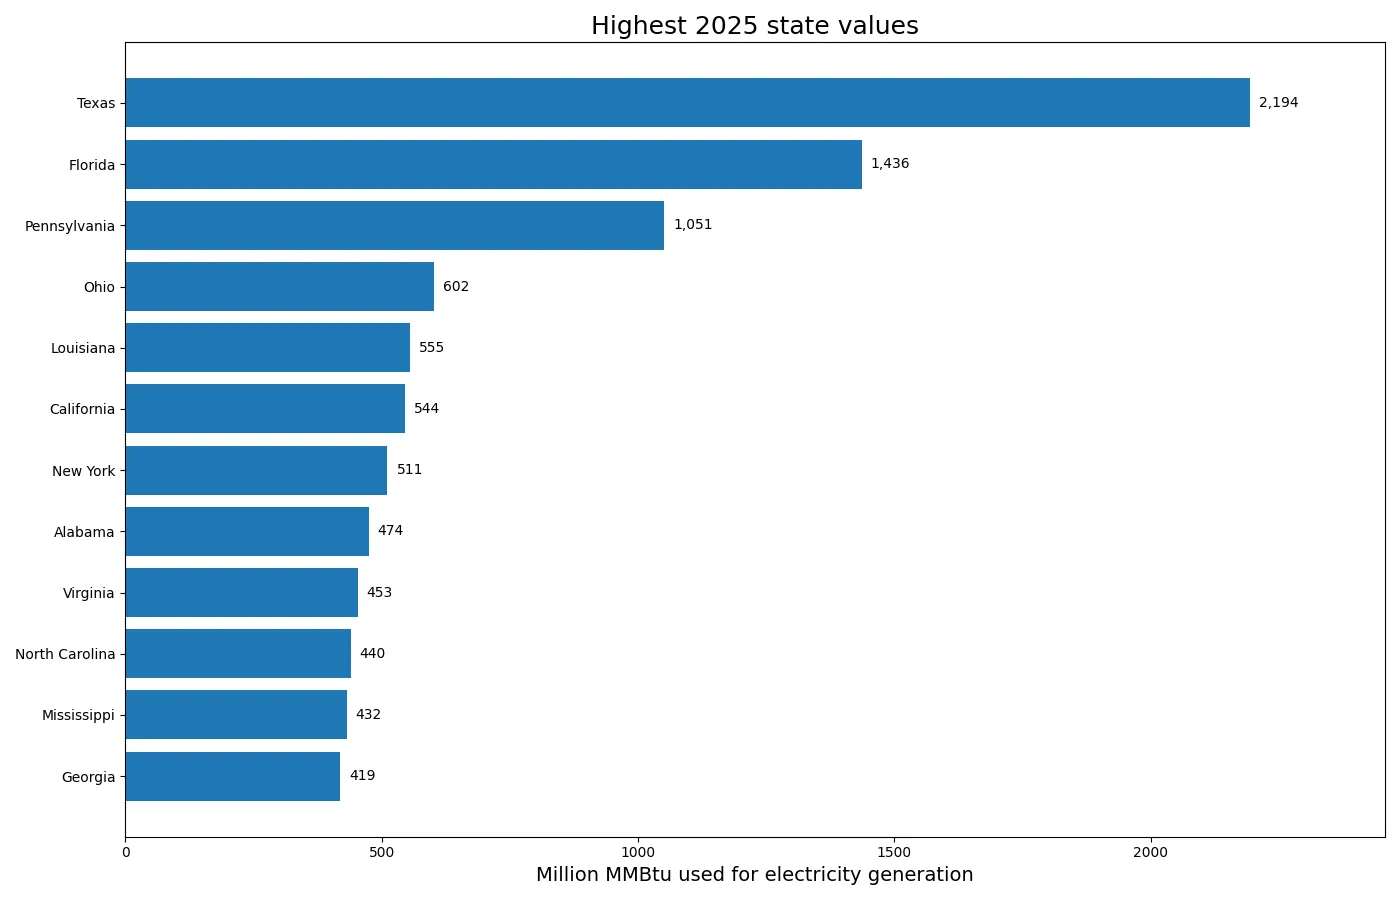
| State or jurisdiction | 2025 value (million MMBtu) |
|---|---|
| Texas | 2,193.99641 |
| Florida | 1,435.99472 |
| Pennsylvania | 1,051.09918 |
| Ohio | 601.57025 |
| Louisiana | 554.59564 |
| California | 544.46978 |
| New York | 511.13473 |
| Alabama | 474.23720 |
| Virginia | 453.22345 |
| North Carolina | 439.58155 |
The top three account for 33.8% of the total, the top five for 42.1%, and the top ten for 59.6%. The leading group is important, but Texas alone is not overwhelmingly dominant: more than four-fifths of the total remains outside the largest state.
This is not a ranking of electricity output. Fuel heat input and net generation are linked through plant efficiency and operating technology. Combined-cycle plants, simple-cycle turbines, steam units, and other configurations can produce different amounts of electricity from similar heat inputs. Net generation is the appropriate measure when the question concerns output rather than fuel energy consumed.
The median is 154.83669 million MMBtu
The median is 154.83669, with a first quartile of 48.42782 and a third quartile of 408.58358. The middle half therefore falls between roughly 48.4 and 408.6 million MMBtu. The maximum is about 14.2 times the median, showing a large gap between the biggest gas-fired systems and a typical jurisdiction.
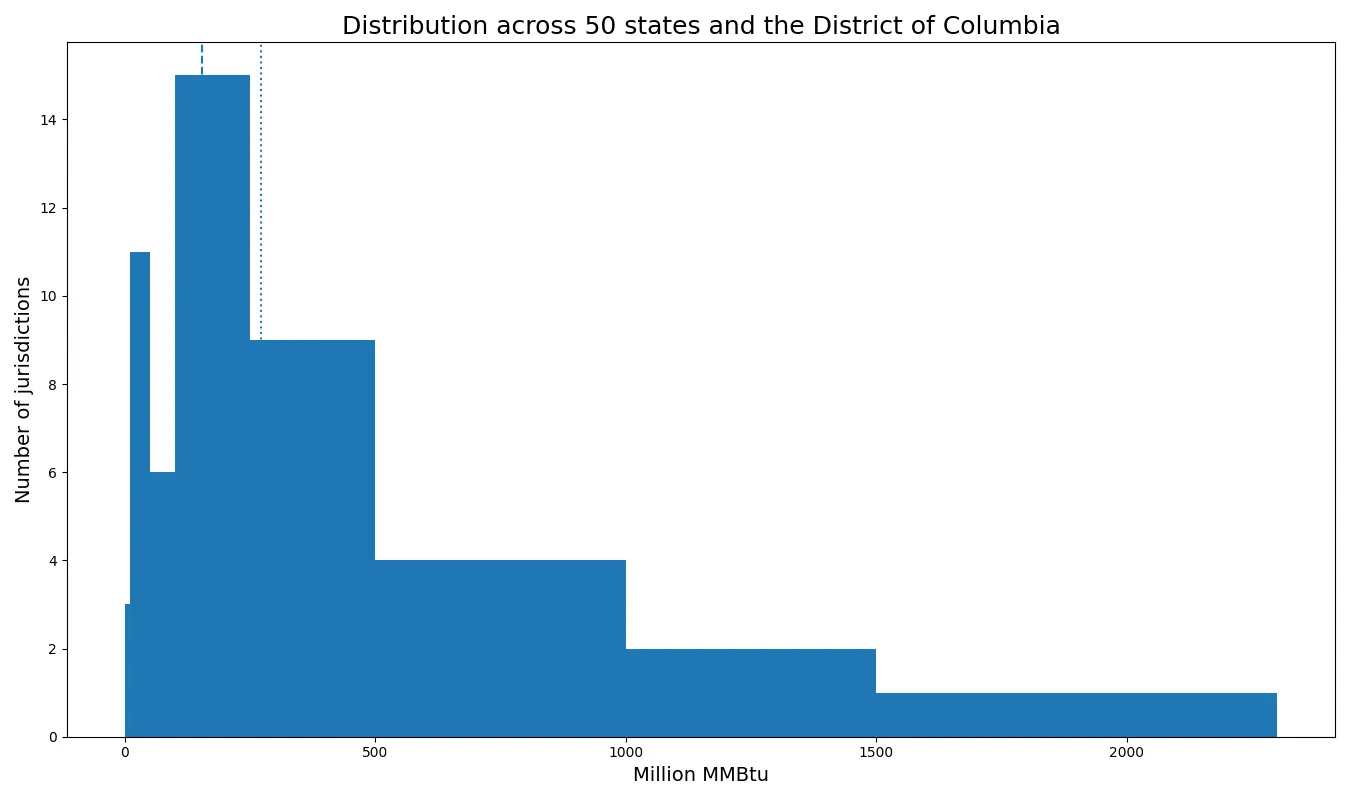
By band, 3 jurisdictions are below 10 million MMBtu, 11 are from 10 to under 50, 6 from 50 to under 100, 15 from 100 to under 250, and 9 from 250 to under 500. Another 4 lie from 500 to under 1,000, while only 3 reach 1,000 or more.
The mean of 271.73114 is well above the median of 154.83669. Large values in Texas, Florida, Pennsylvania, and several other states pull the arithmetic average upward. The median and quartiles therefore provide useful context for what a more typical jurisdiction looks like.
Hawaii is the single official zero
Hawaii has the lowest 2025 observation at 0. Vermont follows at 0.00882, District of Columbia at 0.99958, Montana at 13.29655, and Nebraska at 17.81566. The 51-row dataset contains exactly 1 official zero and no missing values.
| State or jurisdiction | 2025 value (million MMBtu) |
|---|---|
| Hawaii | 0.00000 |
| Vermont | 0.00882 |
| District of Columbia | 0.99958 |
| Montana | 13.29655 |
| Nebraska | 17.81566 |
| South Dakota | 20.68441 |
| North Dakota | 24.19019 |
| Alaska | 25.30039 |
| West Virginia | 32.27743 |
| Delaware | 36.44517 |
A reported zero is not the same as missing data. Hawaii is explicitly reported as zero in this series and remains zero in the comparison. All 50 states and the District of Columbia are present, so no jurisdiction needs to be imputed or assigned a value that the source did not report.
The zero also does not mean Hawaii has no natural-gas activity anywhere in its economy. The observation belongs to one EIA electricity operational series with a specific fuel grouping and electricity-generation heat-input field. Other sectors and other natural-gas measures answer different questions.
The top ten account for 59.6%
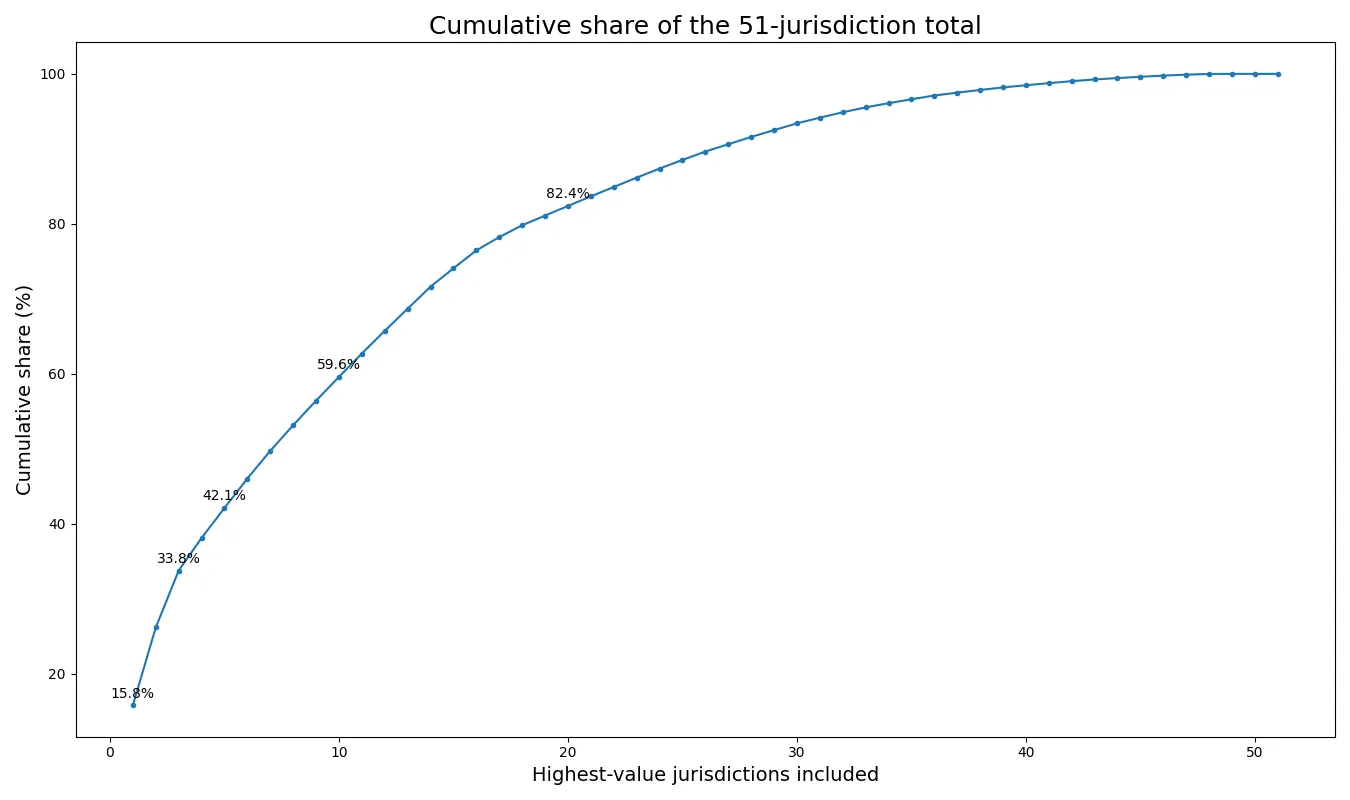
Texas contributes 15.8% of the total, the top three 33.8%, the top five 42.1%, and the top ten 59.6%. The cumulative curve rises quickly at first, confirming concentration in a leading group, while the remaining 41 jurisdictions still provide roughly two-fifths of the total.
This share calculation is descriptive. It is not a measure of utility ownership, wholesale power-market concentration, or market power. It simply shows how much of the summed state heat input is contained in the largest observations.
California ranks sixth and New York seventh
California records 544.46978 million MMBtu and ranks 6th. New York records 511.13473 and ranks 7th. Alabama, Virginia, and North Carolina also appear in the top ten.
Differences among states can reflect electricity demand, gas-fired capacity, the share of combined-cycle generation, competition from nuclear, coal, hydro, wind, and solar, fuel prices, weather, outages, maintenance, and plant dispatch. The state values reveal the outcome of these systems but do not isolate a single causal factor.
Million MMBtu measures heat input, not gas volume
MMBtu is a heat-content unit. The million MMBtu values measure the energy content of the fuel consumed, not a physical volume such as million cubic feet. Physical volume and heat content are related through average fuel quality, but they are different metrics and can vary somewhat independently.
A physical-unit EIA series should be used when the question is gas volume. The Btu-based series is better when the question is fuel energy input to electricity generation. Mixing physical volume and heat content in a state share or growth calculation would combine unlike quantities.
Electricity-generation consumption is narrower than electricity plus useful heat
EIA operational data contain several similarly named consumption measures. Fuel assigned to electricity generation is narrower than total consumption when combined heat and power facilities also produce useful thermal output. The distinction can change both state values and the share attributed to a leading state.
That is why another 2025 article about natural gas & other gases used for electricity and useful heat can report a different Texas share. The fuel grouping and year can match while the statistical field does not. The two series should be treated as related but separate measures.
Rank positions near the middle need context
The gap between Texas and Florida exceeds 750 million MMBtu, but many mid-ranked states are separated by much smaller amounts. Ranking is useful for sorting observations, yet a few places in a table do not necessarily represent a large structural difference. Absolute gaps, quartiles, and value bands provide more context than rank alone.
The values are also totals, not per-capita or per-unit-of-generation measures. Larger states and larger electricity systems can naturally produce larger heat-input totals. A comparison of intensity would require a denominator such as population, electricity generated, or gas-fired capacity.
A single year cannot establish a trend
The 2025 values are a cross-section. They do not show whether Texas, Florida, or any other state is increasing or decreasing natural-gas heat input over time. A valid trend requires the same consumption-for-eg-btu field, NGO fuel grouping, state geography, annual frequency, and million MMBtu unit across multiple years.
Using total-consumption-btu in one year and consumption-for-eg-btu in another would create an invalid growth comparison even if the titles look similar. Consistency of field, fuel, geography, and unit is essential for time-series analysis.
Source and the main 2025 pattern
The values come from U.S. Energy Information Administration electricity data. The EIA Open Data documentation explains the fields and facets used to retrieve annual state observations. This comparison is limited to 2025 natural gas & other gases consumed for electricity generation on a million-MMBtu basis.
The main pattern is a right-skewed distribution led by Texas. Texas represents 15.8% of the total and the top ten 59.6%. The median is 154.83669, compared with a mean of 271.73114, and Hawaii is the one official zero. A relatively small group of large gas-fired electricity systems sits above a much broader set of medium and small state values.
Frequently Asked Questions
What is the unit of this series?
The unit is million MMBtu, representing the heat content of natural gas & other gases consumed for electricity generation.
Is this the same as total consumption for electricity and useful heat?
No. This series uses consumption-for-eg-btu and is narrower than total-consumption-btu.
Is Hawaii’s zero a missing value?
No. Hawaii is an official reported zero in the 2025 series, and all 51 jurisdictions are present.
Why is the mean higher than the median?
Large values in Texas, Florida, Pennsylvania, and other states raise the average. The mean is 271.73114 and the median is 154.83669.
Related Articles
Green Map creates custom-edited map images using open geographic data sources such as geoBoundaries, Natural Earth, OpenStreetMap, and government open data. These maps are edited visual materials, not raw data files, and are provided for education, documents, presentations, and graphic reference.