The U.S. Energy Information Administration data for 2025 show an unusually concentrated state distribution when the electricity operational dataset is restricted to `generation`, fueltypeid `TSN` (estimated total solar), and sectorid `1` (Electric Utility). All 50 states plus the District of Columbia are present, so the file contains 51 observed rows and no missing values. Their simple sum is 42,944.19 thousand MWh. Florida alone reports 22,416.80 thousand MWh, followed by Indiana at 3,678.14, Wisconsin at 3,555.17, and Virginia at 2,916.93 thousand MWh.
The sector filter is essential to interpreting those numbers. This is not a ranking of total solar generation from every producer type in each state. It is the Electric Utility slice of the EIA operational dataset. Independent power producers and other sector categories are represented by different EIA facets and can produce very different state totals. A state that appears low here can still have large solar generation outside the Electric Utility sector, so the article keeps the API identity attached to every comparison.
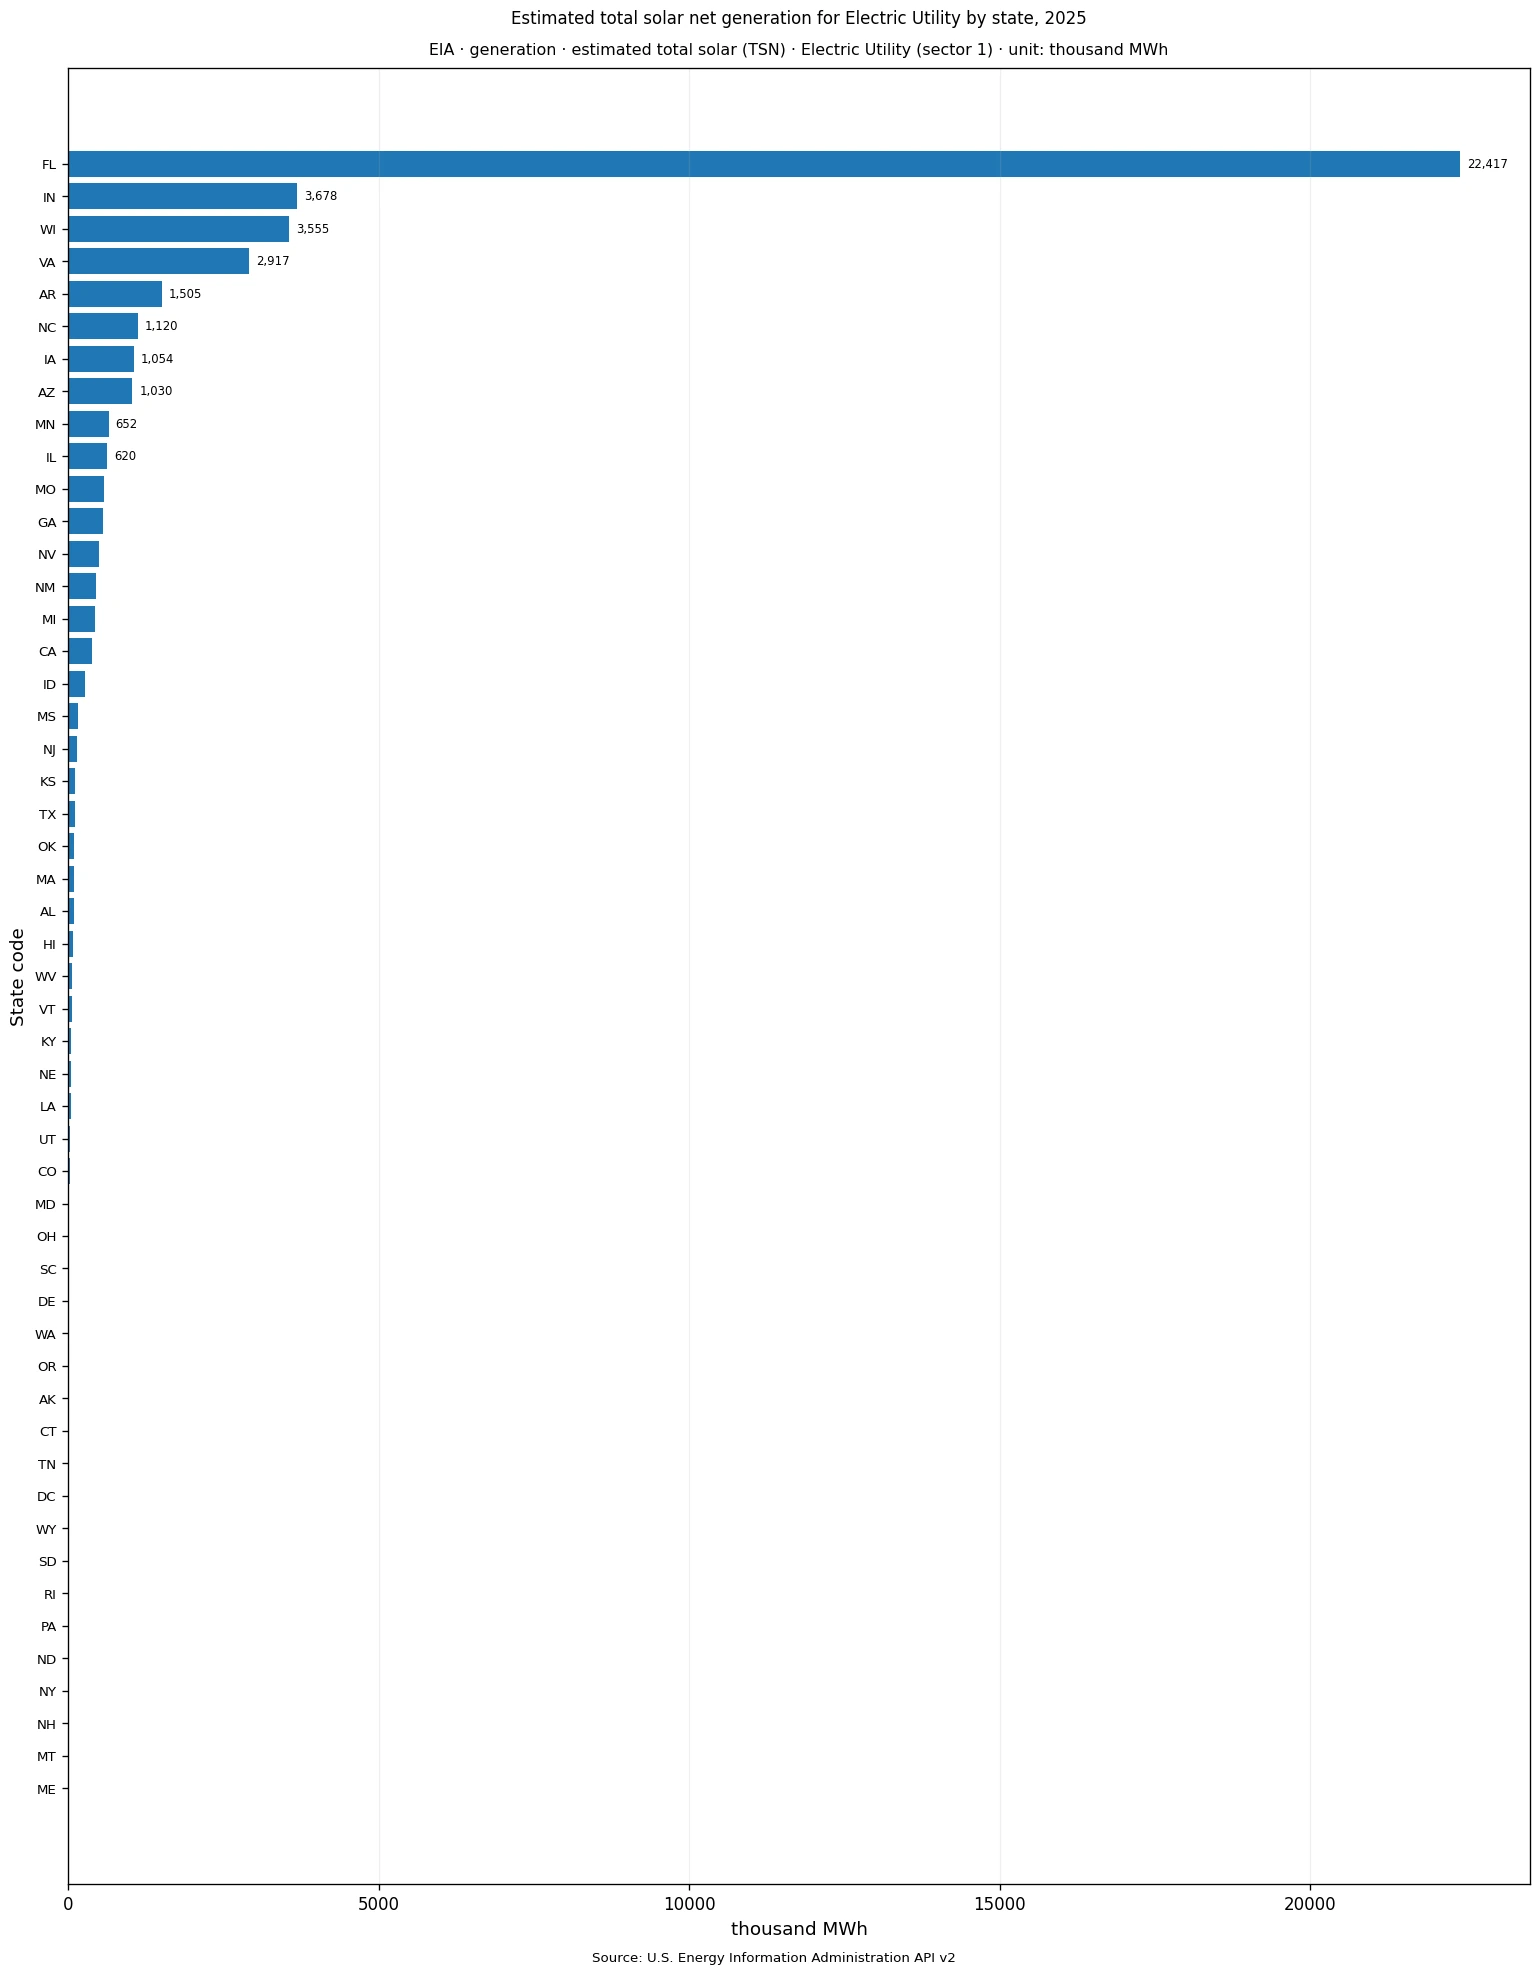
Table of Contents
Florida accounts for 52.20% of the 51-row sum
Florida represents 52.20% of the simple sum of the 51 state and D.C. observations. Indiana contributes 8.56% and Wisconsin 8.28%. The top three therefore account for 69.04%, the top five for 79.34%, and the top ten for 89.76%. That is a highly concentrated distribution. The median is only 62.53 thousand MWh while the mean is 842.04, showing how strongly Florida and a small number of high observations pull the average upward.
The 52.20% figure should not be described as Florida’s share of all U.S. solar generation. Its denominator is only the sum of this specific 51-row Electric Utility slice. Changing sectorid while keeping the same solar fuel category creates a different statistical population. The percentage is useful for measuring concentration within the file, not for replacing a broader national solar total published under a different EIA series.
Indiana, Wisconsin and Virginia form the next tier
After Florida, Indiana records 3,678.14 thousand MWh, Wisconsin 3,555.17 and Virginia 2,916.93. Arkansas follows at 1,504.71, while North Carolina, Iowa and Arizona each exceed 1,000 thousand MWh. Minnesota and Illinois complete the top ten. The leading states span the Southeast, Midwest and Southwest, so the upper end is not confined to one geographic region even though Florida dominates the level.
This ordering is not expected to match state rankings for solar capacity, all-sector solar output or distributed rooftop generation. Generation is an energy-flow measure, capacity is a power measure, and sector classification determines which reporting entities are included. A broader question such as “Which state generated the most solar electricity in total?” requires a broader EIA sector definition or additional datasets.
| Rank | State / area | Code | 2025 value (thousand MWh) | Share of 51-row sum |
|---|---|---|---|---|
| 1 | Florida | FL | 22,416.80 | 52.20% |
| 2 | Indiana | IN | 3,678.14 | 8.56% |
| 3 | Wisconsin | WI | 3,555.17 | 8.28% |
| 4 | Virginia | VA | 2,916.93 | 6.79% |
| 5 | Arkansas | AR | 1,504.71 | 3.50% |
| 6 | North Carolina | NC | 1,120.06 | 2.61% |
| 7 | Iowa | IA | 1,054.12 | 2.45% |
| 8 | Arizona | AZ | 1,029.98 | 2.40% |
| 9 | Minnesota | MN | 651.87 | 1.52% |
| 10 | Illinois | IL | 620.21 | 1.44% |
The median of 62.53 is far below the mean of 842.04
The first quartile is 4.77 thousand MWh and the third quartile is 472.14. Half of the observations therefore lie between roughly 4.8 and 472 thousand MWh, a range that is much more representative of the middle of the distribution than the mean. Eight observations reach at least 1,000 thousand MWh, 12 reach 500 or more, and 20 reach 100 or more. Nineteen observations are below 10 thousand MWh.
Because values range from zero to 22,416.80 thousand MWh, a linear chart necessarily gives Florida a very long bar while many smaller states appear compressed near the origin. That visual pattern reflects the data rather than a plotting error. Using a logarithmic scale would make small values easier to separate, but it would also complicate the treatment of the nine observed zeros, so the chart keeps a straightforward linear axis.
Nine states have observed zeros, not missing data
Maine, Montana, North Dakota, New Hampshire, New York, Pennsylvania, Rhode Island, South Dakota and Wyoming each have a reported value of 0.00000 thousand MWh in this 2025 slice. The dataset contains no missing values. Those zeros therefore remain in the ranking and in the coverage count. Replacing them with “no data” would change the meaning of the source.
At the same time, an observed zero in this slice should not be generalized into the claim that the state had no solar generation of any kind. The filter is limited to estimated total solar within the Electric Utility sector. Generation attributed to a different sector, including independent power producers or other reporting categories, is outside this particular table. The precise statement is that EIA reports zero for this metric-facet combination.
California’s 379.80 thousand MWh illustrates why sector scope matters
California appears 16th with 379.80 thousand MWh in the Electric Utility slice. That result does not imply that California ranked 16th in total statewide solar generation. A substantial amount of solar generation can be associated with producer categories other than Electric Utility, and distributed resources can be captured in separate statistical products. The value is valid for the selected EIA dimensions but cannot be expanded beyond them without additional evidence.
The same caution applies to Florida’s first-place position. It is first within this selected field, fuel category, sector and year. The safest interpretation is: among 2025 state observations in EIA’s Electric Utility sector for estimated total solar net generation, Florida is by far the largest value. Keeping the qualifier in the sentence prevents a correct number from becoming an overly broad conclusion.
The middle of the distribution contains many moderate values
Missouri records 572.02 thousand MWh, Georgia 562.07, Nevada 499.85, New Mexico 444.44, Michigan 433.17 and California 379.80. These observations are small compared with Florida but important for describing the center of the distribution. Nevada sits just above the third quartile, while New Mexico and Michigan fall just below it. The data therefore have a substantial middle range between the cluster of tiny values and the handful of very large ones.
That middle group also shows why a binary “solar versus no solar” framing is not useful here. State values vary continuously from a few thousand MWh to several hundred and then several thousand. The EIA slice is better read as a magnitude distribution among a fixed producer class than as a simple presence-or-absence indicator.
Small positive values remain distinct from the observed zeros
The smallest positive observation is the District of Columbia at 2.34 thousand MWh, followed by Tennessee at 2.78, Connecticut at 2.97, Alaska at 3.66, Oregon at 5.88, Washington at 7.37 and Delaware at 7.40. South Carolina, Ohio and Maryland also remain below 10 thousand MWh. These small positive values are not rounded to zero in the calculations because doing so would erase the distinction between low generation and the nine true zero observations.
The coverage count remains 51 even though nine values contribute nothing to the numerical sum. Coverage describes which jurisdictions are represented in the dataset, while the sum describes the magnitude of the recorded generation values. Keeping those concepts separate is especially important for state-level energy datasets with many zero or near-zero observations.
| Low-end order | State / area | Code | 2025 value (thousand MWh) | Share of 51-row sum |
|---|---|---|---|---|
| 1 | Maine | ME | 0.00 | 0.00% |
| 2 | Montana | MT | 0.00 | 0.00% |
| 3 | New Hampshire | NH | 0.00 | 0.00% |
| 4 | New York | NY | 0.00 | 0.00% |
| 5 | North Dakota | ND | 0.00 | 0.00% |
| 6 | Pennsylvania | PA | 0.00 | 0.00% |
| 7 | Rhode Island | RI | 0.00 | 0.00% |
| 8 | South Dakota | SD | 0.00 | 0.00% |
| 9 | Wyoming | WY | 0.00 | 0.00% |
| 10 | District of Columbia | DC | 2.34 | 0.01% |
One year of data does not establish a trend
These observations describe only 2025. They cannot show whether Florida increased from 2024, whether Indiana recently overtook Wisconsin, or whether zero-valued states have been stable over time. A trend analysis would need multiple annual observations with the field `generation`, fueltypeid `TSN`, sectorid `1`, and the same state geography held constant.
Historical EIA data can also be revised. A reproducible time series should retain extraction dates and rerun the same API request when updates occur. The numbers in this article describe the verified 2025 dataset supplied for this comparison rather than a claim about an unchanging historical record.
The 42,944.19 thousand MWh sum is an analytical denominator
Adding the 51 rows produces 42,944.19 thousand MWh, which is useful for computing the state shares shown in the tables. It should not automatically be equated with an official national solar total. A national series can use different reporting populations, aggregation rules or sector coverage. The article therefore labels the denominator as the “51-row sum” rather than simply calling it U.S. total solar generation.
The top-ten share of 89.76% is a strong descriptive sign of concentration, but this file alone cannot explain the cause. Utility ownership structures, reporting classifications, plant commissioning, resource availability and contractual arrangements may all matter. Those hypotheses require additional data and are not inferred from the single metric presented here.
Four dimensions define the meaning of this EIA series
The unit is thousand MWh, the field is generation, the fuel category is TSN (estimated total solar), and the sector is Electric Utility (sectorid 1). The frequency is annual and the year is 2025. Any change to those dimensions can create a different series even when the public-facing title still contains words such as solar, utility or generation.
The most accurate summary is therefore not “2025 U.S. solar generation by state,” but “2025 estimated total solar net generation by state within EIA’s Electric Utility sector.” Within that scope, Florida is the dominant observation, the distribution is strongly right-skewed, and nine jurisdictions have observed zeros.
Frequently Asked Questions
Which state had the largest 2025 Electric Utility estimated total solar net generation?
Florida was the largest observation at 22,416.80 thousand MWh, about 52.20% of the simple sum of the 50 states and District of Columbia values.
Is this a ranking of total solar generation from all producers in each state?
No. The EIA slice uses fueltypeid=TSN and sectorid=1, Electric Utility. Independent power producers and other sectors are outside this specific comparison.
Are the nine zero values missing data?
No. Maine, Montana, North Dakota, New Hampshire, New York, Pennsylvania, Rhode Island, South Dakota and Wyoming have observed values of 0.00000 in this slice, while the dataset has no missing rows.
Related Articles
Green Map creates custom-edited map images using open geographic data sources such as geoBoundaries, Natural Earth, OpenStreetMap, and government open data. These maps are edited visual materials, not raw data files, and are provided for education, documents, presentations, and graphic reference.