The 2025 World Bank series for GNI growth contains reported values for 104 countries and separately reported economies. GNI, or gross national income, starts from domestic production and then adjusts for primary income received from and paid to the rest of the world. The annual growth indicator is based on a constant-price series, so it is designed to track a real year-to-year change rather than a rise in income caused only by higher prices. That distinction also makes it different from a ranking of GNI in current US dollars or GNI per person.
The middle reported economy grew by 4.03% in 2025, while the unweighted mean across reported observations was 4.22%. Guinea recorded the highest value at 16.53%, followed by Burkina Faso at 14.77%, Armenia at 12.52%, the Kyrgyz Republic at 12.31%, and Nicaragua at 11.47%. At the other end, Iran was at -8.88%, Venezuela at -7.56%, The Gambia at -6.31%, Gabon at -6.08%, and the Republic of the Congo at -5.96%. The range therefore spans more than 25 percentage points, making a single global summary inadequate on its own.
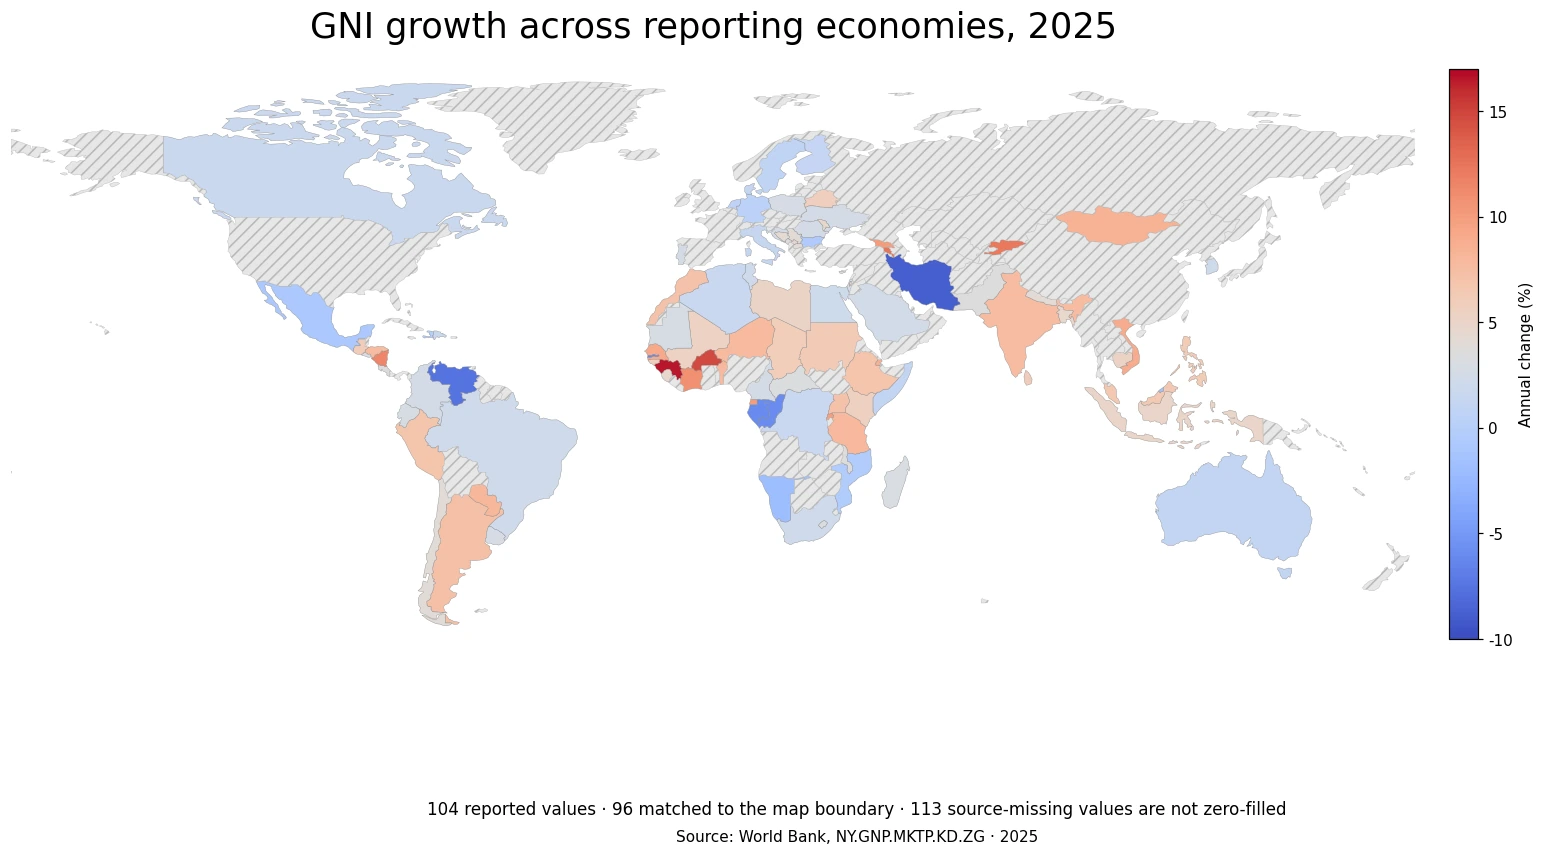
Table of Contents
Seven reported economies exceeded 10% GNI growth
There are 7 observations at or above 10%: Guinea, Burkina Faso, Armenia, the Kyrgyz Republic, Nicaragua, Sao Tome and Principe, and Cote d’Ivoire. Expanding the threshold to 8% raises the count to 15. These high-growth cases are spread across West Africa, the Caucasus and Central Asia, Central America, and island Africa rather than forming one single geographic block. The map therefore points to several separate clusters and outliers rather than a uniform continental pattern.
A double-digit annual rate should not be read as a direct measure of living standards or economic size. Growth percentages are sensitive to the previous year’s level. A rebound after a weak base can generate a large percentage increase, while a much larger economy may add more real income in absolute terms with a smaller percentage change. Explaining why an individual country recorded a high rate would require additional evidence on domestic production, terms of trade, primary income from abroad, investment, and other country-specific factors.
| Economy | GNI growth, 2025 |
|---|---|
| Guinea | 16.53% |
| Burkina Faso | 14.77% |
| Armenia | 12.52% |
| Kyrgyz Republic | 12.31% |
| Nicaragua | 11.47% |
| Sao Tome and Principe | 11.07% |
| Cote d'Ivoire | 10.85% |
| Equatorial Guinea | 9.97% |
| Georgia | 9.96% |
| Rwanda | 9.92% |
Most reported values sit in the middle single-digit range
The distribution is much denser near its center than the extreme values suggest. There are 12 economies between 0% and 2%, 39 between 2% and 5%, and 35 between 5% and 10%. The first quartile is 2.14% and the third quartile is 6.58%, so half of all reported values lie inside that interval. The median of 4.03% is therefore a useful reference when comparing an individual country with the wider set of available 2025 observations.
This is an unweighted cross-country distribution. Every reporting economy counts as one observation, regardless of whether its GNI is very large or very small. It must not be confused with the growth rate of world GNI, which would require an aggregate constructed from the underlying income levels. The average reported here answers a different question: what is the simple mean of the available national and territorial growth rates?
West Africa combines some of the highest values with a sharp nearby decline
Several West African observations are near the top of the 2025 distribution. Guinea is at 16.53%, Burkina Faso at 14.77%, Cote d’Ivoire at 10.85%, Senegal at 9.29%, Benin at 7.98%, and Niger at 7.79%. Yet The Gambia is at -6.31%. The contrast within a relatively compact region illustrates why neighboring economies cannot be assumed to move together. GNI can respond differently to domestic output, cross-border income flows, commodity exposure, and the previous year’s base.
Central Africa shows another strong local contrast. Equatorial Guinea is close to 10%, while Gabon and the Republic of the Congo are both near -6%. A continental average would hide those opposing movements. For this indicator, a country-level map is especially useful because it exposes adjacent high and low values that disappear when the data are summarized only by broad region.
The Caucasus, Central Asia, and Central America also show local gaps
Armenia at 12.52% and Georgia at 9.96% stand out around the Caucasus, while the Kyrgyz Republic reaches 12.31% in Central Asia. In contrast, a group of Balkan and Eastern European observations are closer to the middle of the global distribution: Moldova 4.61%, Bosnia and Herzegovina 4.28%, Serbia 4.03%, North Macedonia 4.02%, and Montenegro 3.06%. These differences do not identify causes by themselves, but they show that regional labels are too coarse to describe the 2025 pattern.
Central America provides a similar example. Nicaragua records 11.47%, Honduras 7.66%, Guatemala 6.12%, Costa Rica 3.59%, and El Salvador 3.20%. The economies are geographically close, yet their annual GNI changes differ substantially. That is consistent with the indicator’s construction: it measures each economy’s own year-over-year income change, not a regional business-cycle index.
Eleven observations are negative rather than missing
Among the 104 reported 2025 values, 11 are below zero. In addition to Iran, Venezuela, The Gambia, Gabon, and the Republic of the Congo, the negative group includes Namibia, Brunei Darussalam, Mexico, Bulgaria, Mozambique, and Haiti. A negative value means constant-price GNI was lower than in the previous year. It is an observed result and should be visually and statistically separated from a missing value.
Negative GNI growth is also not automatically the same as an official recession classification. Recession analysis usually considers GDP and often higher-frequency activity, employment, and other evidence. Because GNI adjusts GDP for cross-border primary income, GNI can weaken even when domestic production is more resilient, or move more strongly than GDP when external income changes. The two series are related but not interchangeable.
| Economy | GNI growth, 2025 |
|---|---|
| Iran, Islamic Rep. | -8.88% |
| Venezuela, RB | -7.56% |
| Gambia, The | -6.31% |
| Gabon | -6.08% |
| Congo, Rep. | -5.96% |
| Namibia | -1.88% |
| Brunei Darussalam | -1.30% |
| Mexico | -0.82% |
| Bulgaria | -0.53% |
| Mozambique | -0.30% |
GNI growth and GDP growth answer different questions
GDP measures production generated within an economy. GNI shifts the focus toward income accruing to residents by adding primary income receivable from abroad and subtracting primary income payable abroad. Wages earned across borders, investment income, and profits attributed to foreign or resident owners can therefore create a gap between the two measures. Economies with substantial international income flows may show a more noticeable divergence between GDP growth and GNI growth.
The indicator also differs from GNI per capita and GNI at current prices. Per-capita measures divide an income level by population, while current-price values are useful for nominal scale but are affected by price changes and, depending on the unit, exchange rates. The annual GNI growth series used here asks a narrower question: by what percentage did real GNI change from the previous year? Keeping those concepts separate avoids treating a growth-rate ranking as a ranking of prosperity.
Coverage is the main limitation of the 2025 comparison
The source table contains 217 country and separately reported economy rows for 2025, but only 104 have a usable value. The remaining 113 are explicitly preserved as source-missing. They are not observations of 0% growth. Replacing those missing entries with zero would create false data, lower the apparent distribution, and incorrectly color countries on a map.
The map has a second, purely geographic coverage limit. Its low-resolution Natural Earth boundary layer matches 96 of the 104 reported values (92.3%). Several small island or city economies are absent as separate polygons at this resolution, including Comoros, Cabo Verde, Malta, Mauritius, Singapore, Sao Tome and Principe, Seychelles, and Samoa. Their data remain in every numerical calculation and in the rankings where applicable; only the simplified map boundary cannot draw them as separate filled areas.
A one-year growth rate should be separated from income level and long-run trend
Fast GNI growth does not imply that an economy has a high income level. A lower-income economy can expand rapidly from a smaller base, while a high-income economy can post modest growth and still have a much larger GNI per person. Growth rate, total income, and income per person are different dimensions. A complete comparison should use the indicator that matches the question being asked rather than collapsing all three into one league table.
The 2025 result is also a single-year snapshot. Base effects, temporary shocks, commodity prices, changes in external earnings, and one-off movements can materially influence an annual rate. A structural growth assessment would be stronger with several consecutive years, GDP growth, real GNI per capita, population, investment, trade, and the composition of external income. This map is best used to identify where 2025 changes were unusually high, moderate, or negative and then guide deeper investigation.
Source and interpretation
The source is the World Bank World Development Indicators series NY.GNP.MKTP.KD.ZG, “GNI growth (annual %).” The World Bank defines GNI as GDP plus primary income receivable from abroad minus primary income payable to nonresidents. The growth series represents the percentage change from the previous year in a constant-price series. This comparison uses the official 2025 observations, excludes World Bank regional and income-group aggregates, and leaves unavailable country values as missing.
Accordingly, the central message is about the pace and direction of real national-income change, not the absolute size of an economy. Double-digit increases, a broad middle range around 4%, and a smaller group of declines all appear in the same year, with sharp differences even among neighbors. Reading the map together with the distribution and the coverage limits provides a more accurate picture than relying on the highest and lowest values alone.
Frequently Asked Questions
Is GNI growth the same as GDP growth?
No. GDP measures domestic production, while GNI adjusts GDP for primary income received from and paid to the rest of the world. The two growth rates can diverge when cross-border income flows are important.
Do the 113 missing 2025 values mean 0% growth?
No. They are source-missing observations, not measured zero growth. Treating them as 0% would create false data and distort the distribution.
Does faster GNI growth mean a higher standard of living?
Not by itself. A growth rate measures the pace of change from the previous year. Income level and living standards require measures such as real GNI per capita and other complementary indicators.
Related Articles
Green Map creates custom-edited map images using open geographic data sources such as geoBoundaries, Natural Earth, OpenStreetMap, and government open data. These maps are edited visual materials, not raw data files, and are provided for education, documents, presentations, and graphic reference.