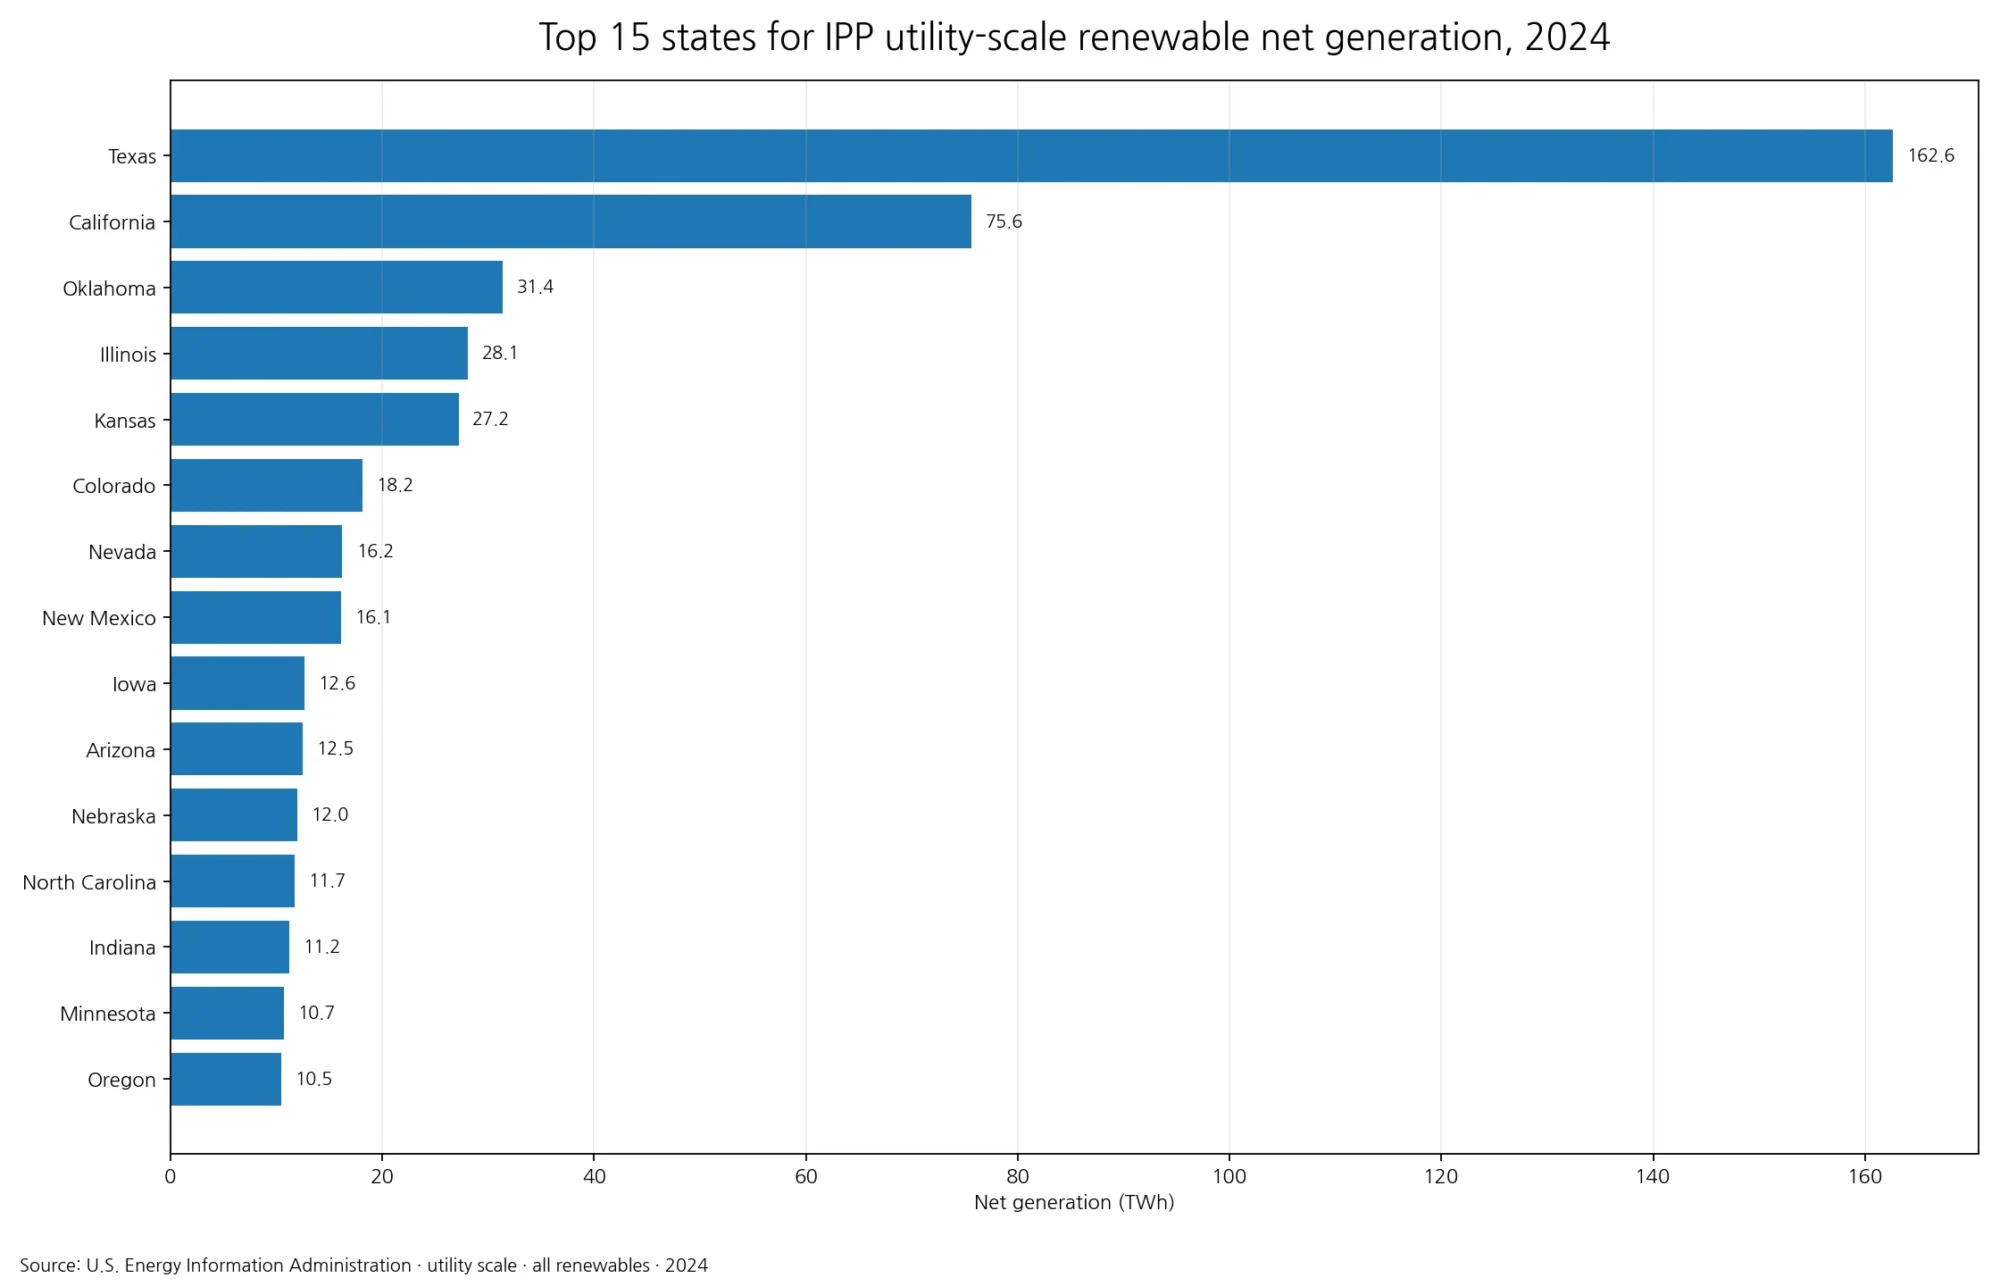
In 2024, Texas recorded the largest state-level value for renewable energy input used in electricity generation under the EIA REN fuel code and All Sectors aggregation. Texas reported 572.818 million MMBtu, followed by California at 431.543 and Washington at 249.839. The 51 state and District of Columbia observations sum to 3,685.686 million MMBtu, so Texas represents 15.54% of this like-for-like comparison. The measure is an energy-input statistic, not electricity output in megawatt-hours.
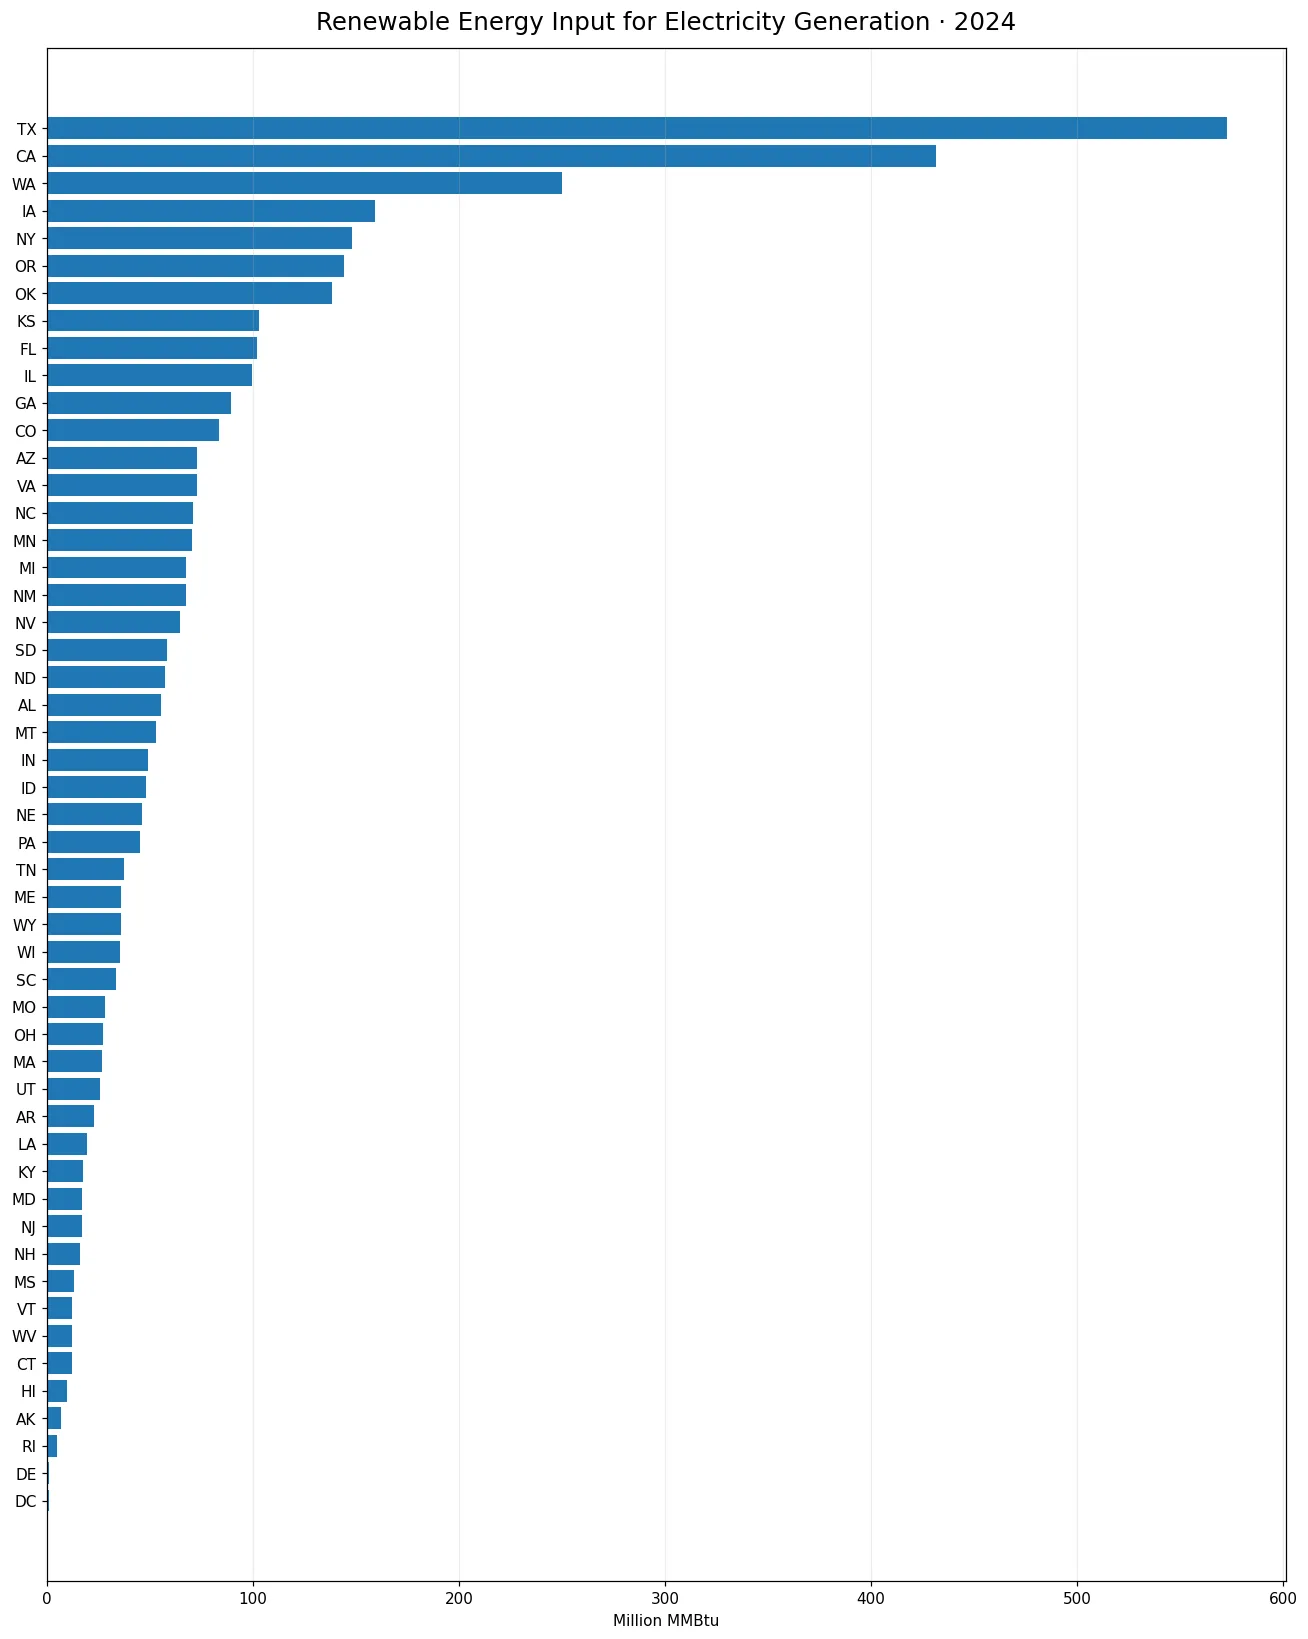
The source is the U.S. Energy Information Administration Electric Power Operational Data. The comparison fixes frequency at annual, year at 2024, fueltypeid at REN, sectorid at 99, and the data field at consumption-for-eg-btu. Every one of the 51 jurisdictions has a positive reported value. No missing observation was converted to zero, and the minimum is the District of Columbia at 0.6658 million MMBtu.
Table of Contents
What this EIA measure actually counts
The consumption-for-eg-btu field expresses energy input associated with electricity generation on a common Btu basis. It should not be read as net generation, installed capacity, renewable share of electricity, or fuel volume. Those measures answer different questions and use different units. A state can rank highly here because a large amount of renewable energy is recorded as input to generation, while its renewable percentage of total electricity may follow a different ordering.
Using a thermal-energy basis allows EIA to place energy sources with unlike physical units on one accounting scale. That makes state comparisons possible, but it does not turn the measure into a score of efficiency or policy performance. Generation technology, resource mix, system size, imports and exports, and operating patterns can all matter. The observations show the measured scale of energy input under one fixed definition; they do not identify a single cause for each state value.
REN is not interchangeable with the AOR fuel facet
A key distinction is the fuel identifier. This comparison uses fueltypeid=REN. EIA also publishes observations under other renewable-related facet values, including AOR in material already covered elsewhere on the site. Even when year, sector, field, and unit look similar, a different fuel facet can produce a different set of values. The REN results therefore should not be treated as a revision of an AOR table or combined with it as though the categories were identical.
The practical lesson is to read the structured identity before comparing two EIA charts. Year and unit are not enough. Fueltypeid, sectorid, and field must also match. In this case, the REN identifier is part of the meaning of every number. Keeping that identifier visible also explains why a superficially similar renewable-energy article can report a different Texas or California value without creating a contradiction.
Texas, California and Washington form the leading group
Texas accounts for 15.54% of the 51-jurisdiction sum. California contributes 11.71% and Washington 6.78%. Together the three states make up 34.03%. Their combined share is substantial but still leaves nearly two thirds of the measured energy input distributed across the rest of the country.
Below the top three, Iowa records 159.068 million MMBtu, New York 147.863, Oregon 144.280, and Oklahoma 138.505. Kansas, Florida, and Illinois complete the top ten. The leading states span several regions rather than one continuous geographic block. That pattern is useful descriptively, but the observations do not by themselves reveal which renewable technologies or market structures created each state total.
Top 10 state-level values
| State | Code | Million MMBtu | Share of 51-jurisdiction sum |
|---|---|---|---|
| Texas | TX | 572.818 | 15.54% |
| California | CA | 431.543 | 11.71% |
| Washington | WA | 249.839 | 6.78% |
| Iowa | IA | 159.068 | 4.32% |
| New York | NY | 147.863 | 4.01% |
| Oregon | OR | 144.280 | 3.91% |
| Oklahoma | OK | 138.505 | 3.76% |
| Kansas | KS | 102.791 | 2.79% |
| Florida | FL | 101.993 | 2.77% |
| Illinois | IL | 99.478 | 2.70% |
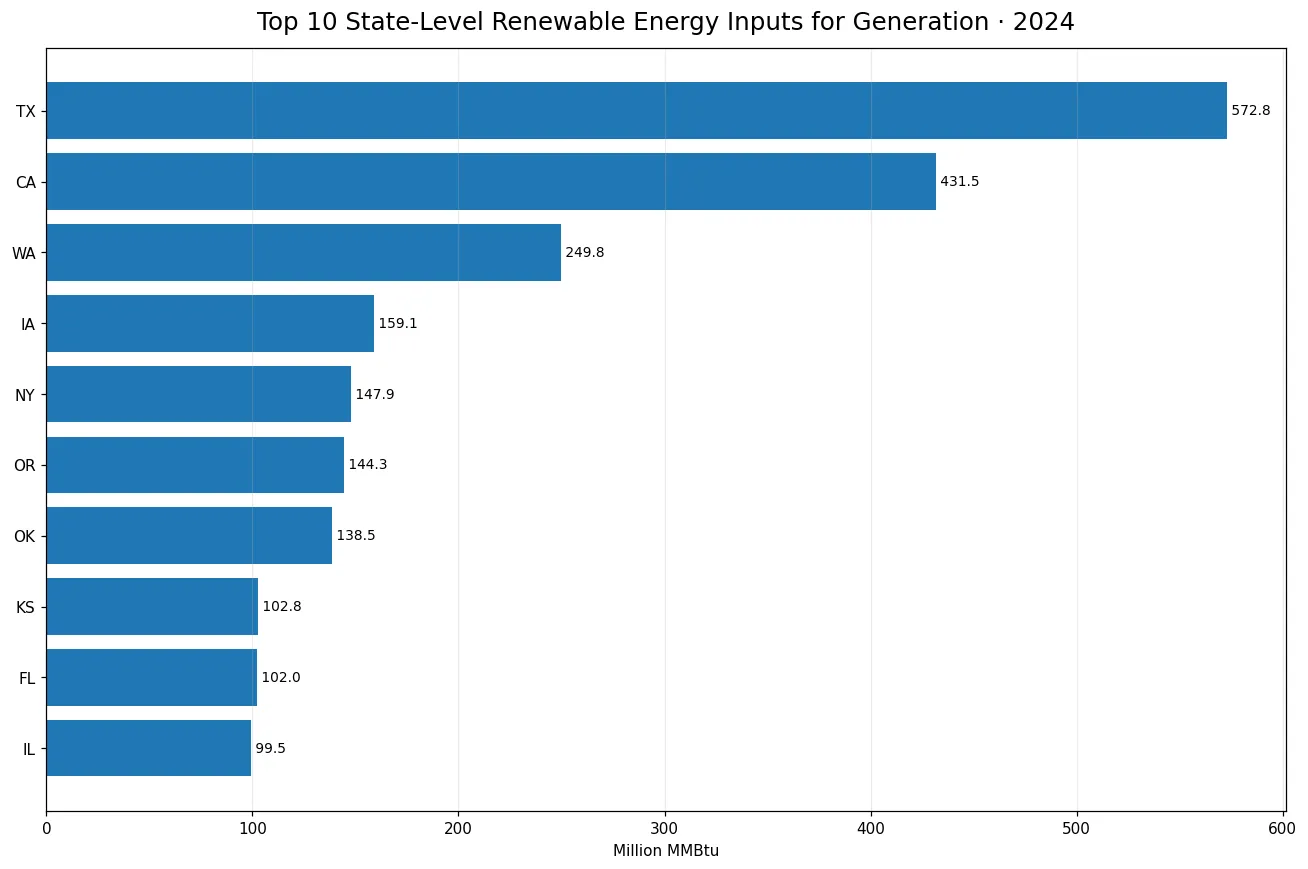
The top ten together represent 58.28% of the total used for this comparison. That is clear concentration, although it is not so extreme that the remaining states become negligible. More than 40% remains outside the top ten. The distribution therefore has two simultaneous features: very large leading observations and a broad tail of meaningful state values.
Mean and median describe a right-skewed distribution
The arithmetic mean is 72.268 million MMBtu, while the median is 46.232. The first quartile is 18.368 and the third quartile is 72.656 million MMBtu. Because the mean sits well above the median, the largest observations pull the average upward. Texas and California are especially influential, so the mean is not a good description of the middle state on its own.
The median provides a useful checkpoint: half of the jurisdictions fall at or below roughly 46.2 million MMBtu and half fall above it. Looking only at the ranking can hide how compressed many middle values are, while looking only at the mean can make a typical jurisdiction appear larger than it is. Rank, quartiles, median, and the top-share measures together give a more balanced view of the distribution.
Small reported values are still observations
The District of Columbia is the minimum at 0.6658 million MMBtu. Other lower-ranked jurisdictions also report positive values. There are no missing entries and no reported zeros in this slice, so all 51 jurisdictions can be included in the same calculations without imputation. A small positive number should not be replaced by zero or classified as unavailable data.
Nor does a low absolute input automatically mean renewable energy has little importance in a jurisdiction. Small electricity systems can have low absolute quantities even when renewables play a meaningful relative role. Power transfers between states and the location of generating assets can also matter. A renewable percentage, per-capita measure, or generation-capacity statistic would answer a different question and may produce a very different ordering.
How to read sector 99 with this field
Sectorid=99 is labeled All Sectors in the EIA operational series. That label should be interpreted inside the electricity dataset rather than expanded into a claim about all final energy consumption in the U.S. economy. The field here is specifically consumption-for-eg-btu, so the subject is energy used for electricity generation. Useful thermal output has its own field, and a total-consumption field can combine electricity-generation and useful-thermal uses.
That field distinction matters when two articles appear almost identical. A total-consumption-btu article can include a broader use definition than consumption-for-eg-btu, even if both use the same fuel and sector. Likewise, a sector code for independent power producers or non-CHP plants describes a narrower producer group than sector 99. Precise comparisons require all of these dimensions to stay aligned.
What the shares in this article mean
The percentages reported here use 3,685.686 million MMBtu—the sum of the 51 matching 2024 observations—as the denominator. Texas at 15.54%, the top three at 34.03%, and the top ten at 58.28% are therefore shares within this specific state comparison. They are not national renewable-electricity shares, shares of total U.S. energy consumption, or shares of electricity sales.
This denominator discipline is important because energy statistics often reuse the same state names across many related measures. Changing the denominator changes the meaning of a percentage. The state shares here are descriptive concentration measures for one EIA facet combination. They should not be copied into a discussion of generation mix or market share unless the denominator is explicitly rebuilt for that separate question.
What can and cannot be inferred
The observations support a straightforward conclusion: under the REN, All Sectors, electricity-generation energy-input definition, Texas and California had the largest absolute values in 2024, Washington ranked third, and the top ten accounted for a little more than 58% of the state total used here. They also show that every jurisdiction had a positive recorded value. Those are direct statements from the measured distribution.
The observations do not establish why one state ranks above another. They do not measure policy quality, cost, emissions, capacity factor, reliability, or household renewable adoption. Any explanation involving resource endowment, investment policy, grid design, or technology mix needs additional evidence. Keeping interpretation close to the published measure prevents an absolute energy-input ranking from turning into a broader claim the data do not support.
Five checks before comparing this series with another EIA chart
First, match the year: 2024. Second, match the unit: million MMBtu. Third, confirm fueltypeid=REN. Fourth, confirm sectorid=99. Fifth, confirm field=consumption-for-eg-btu. If any one of those dimensions changes, the resulting state values may answer a different question. This is especially important for renewable-energy series because similar public labels can conceal different underlying facet codes.
Once those dimensions are fixed, the comparison is internally consistent across all 51 jurisdictions. That consistency is more valuable than forcing the values into a broader narrative. The data are most useful for seeing scale, ranking, concentration, and distribution under a clearly defined EIA measure, while related generation or renewable-share indicators can be consulted separately for other questions.
Frequently Asked Questions
Does this measure renewable electricity generation?
No. consumption-for-eg-btu measures energy input used for electricity generation in million MMBtu. Electricity generation in MWh is a separate EIA measure.
Are REN and AOR the same renewable fuel code?
They should not be treated as identical. This comparison fixes fueltypeid=REN, while AOR is a separate facet used in other renewable-related observations.
Is Texas’s 15.54% the renewable share of U.S. electricity?
No. It is Texas's share of the sum of the 51 matching 2024 state and District of Columbia observations under this specific EIA definition.
Were missing or zero values present?
No. All 51 jurisdictions have positive reported values; the minimum is the District of Columbia at 0.6658 million MMBtu.
Related Articles
Green Map creates custom-edited map images using open geographic data sources such as geoBoundaries, Natural Earth, OpenStreetMap, and government open data. These maps are edited visual materials, not raw data files, and are provided for education, documents, presentations, and graphic reference.