California led the 2024 state-level EIA series for utility-scale solar net generation, with 80,151.829 thousand MWh. Texas followed at 45,514.757 thousand MWh, and Florida ranked third at 23,260.533 thousand MWh. The 51 observations for the 50 states and the District of Columbia sum to 303,751.962 thousand MWh. California alone represents 26.39% of that state-level sum. The underlying series is the U.S. Energy Information Administration annual electricity/electric-power-operational-data route with fueltypeid=TSN, sectorid=99, and field=generation for 2024. EIA labels the TSN fuel facet as “estimated total solar,” so this article treats the measure as utility-scale solar net generation within that operational-data series.
The series identity matters as much as the ranking. The unit is thousand megawatthours, which measures electricity produced over time. It is not megawatts of installed capacity and it is not a Btu measure of fuel energy used as an input. Sector 99 is the All Sectors slice, so the numbers are not limited to a single ownership class such as Independent Power Producers. Another EIA article can legitimately have a similar solar title but report different values if it uses a different sector facet, fuel facet, year, or data field.
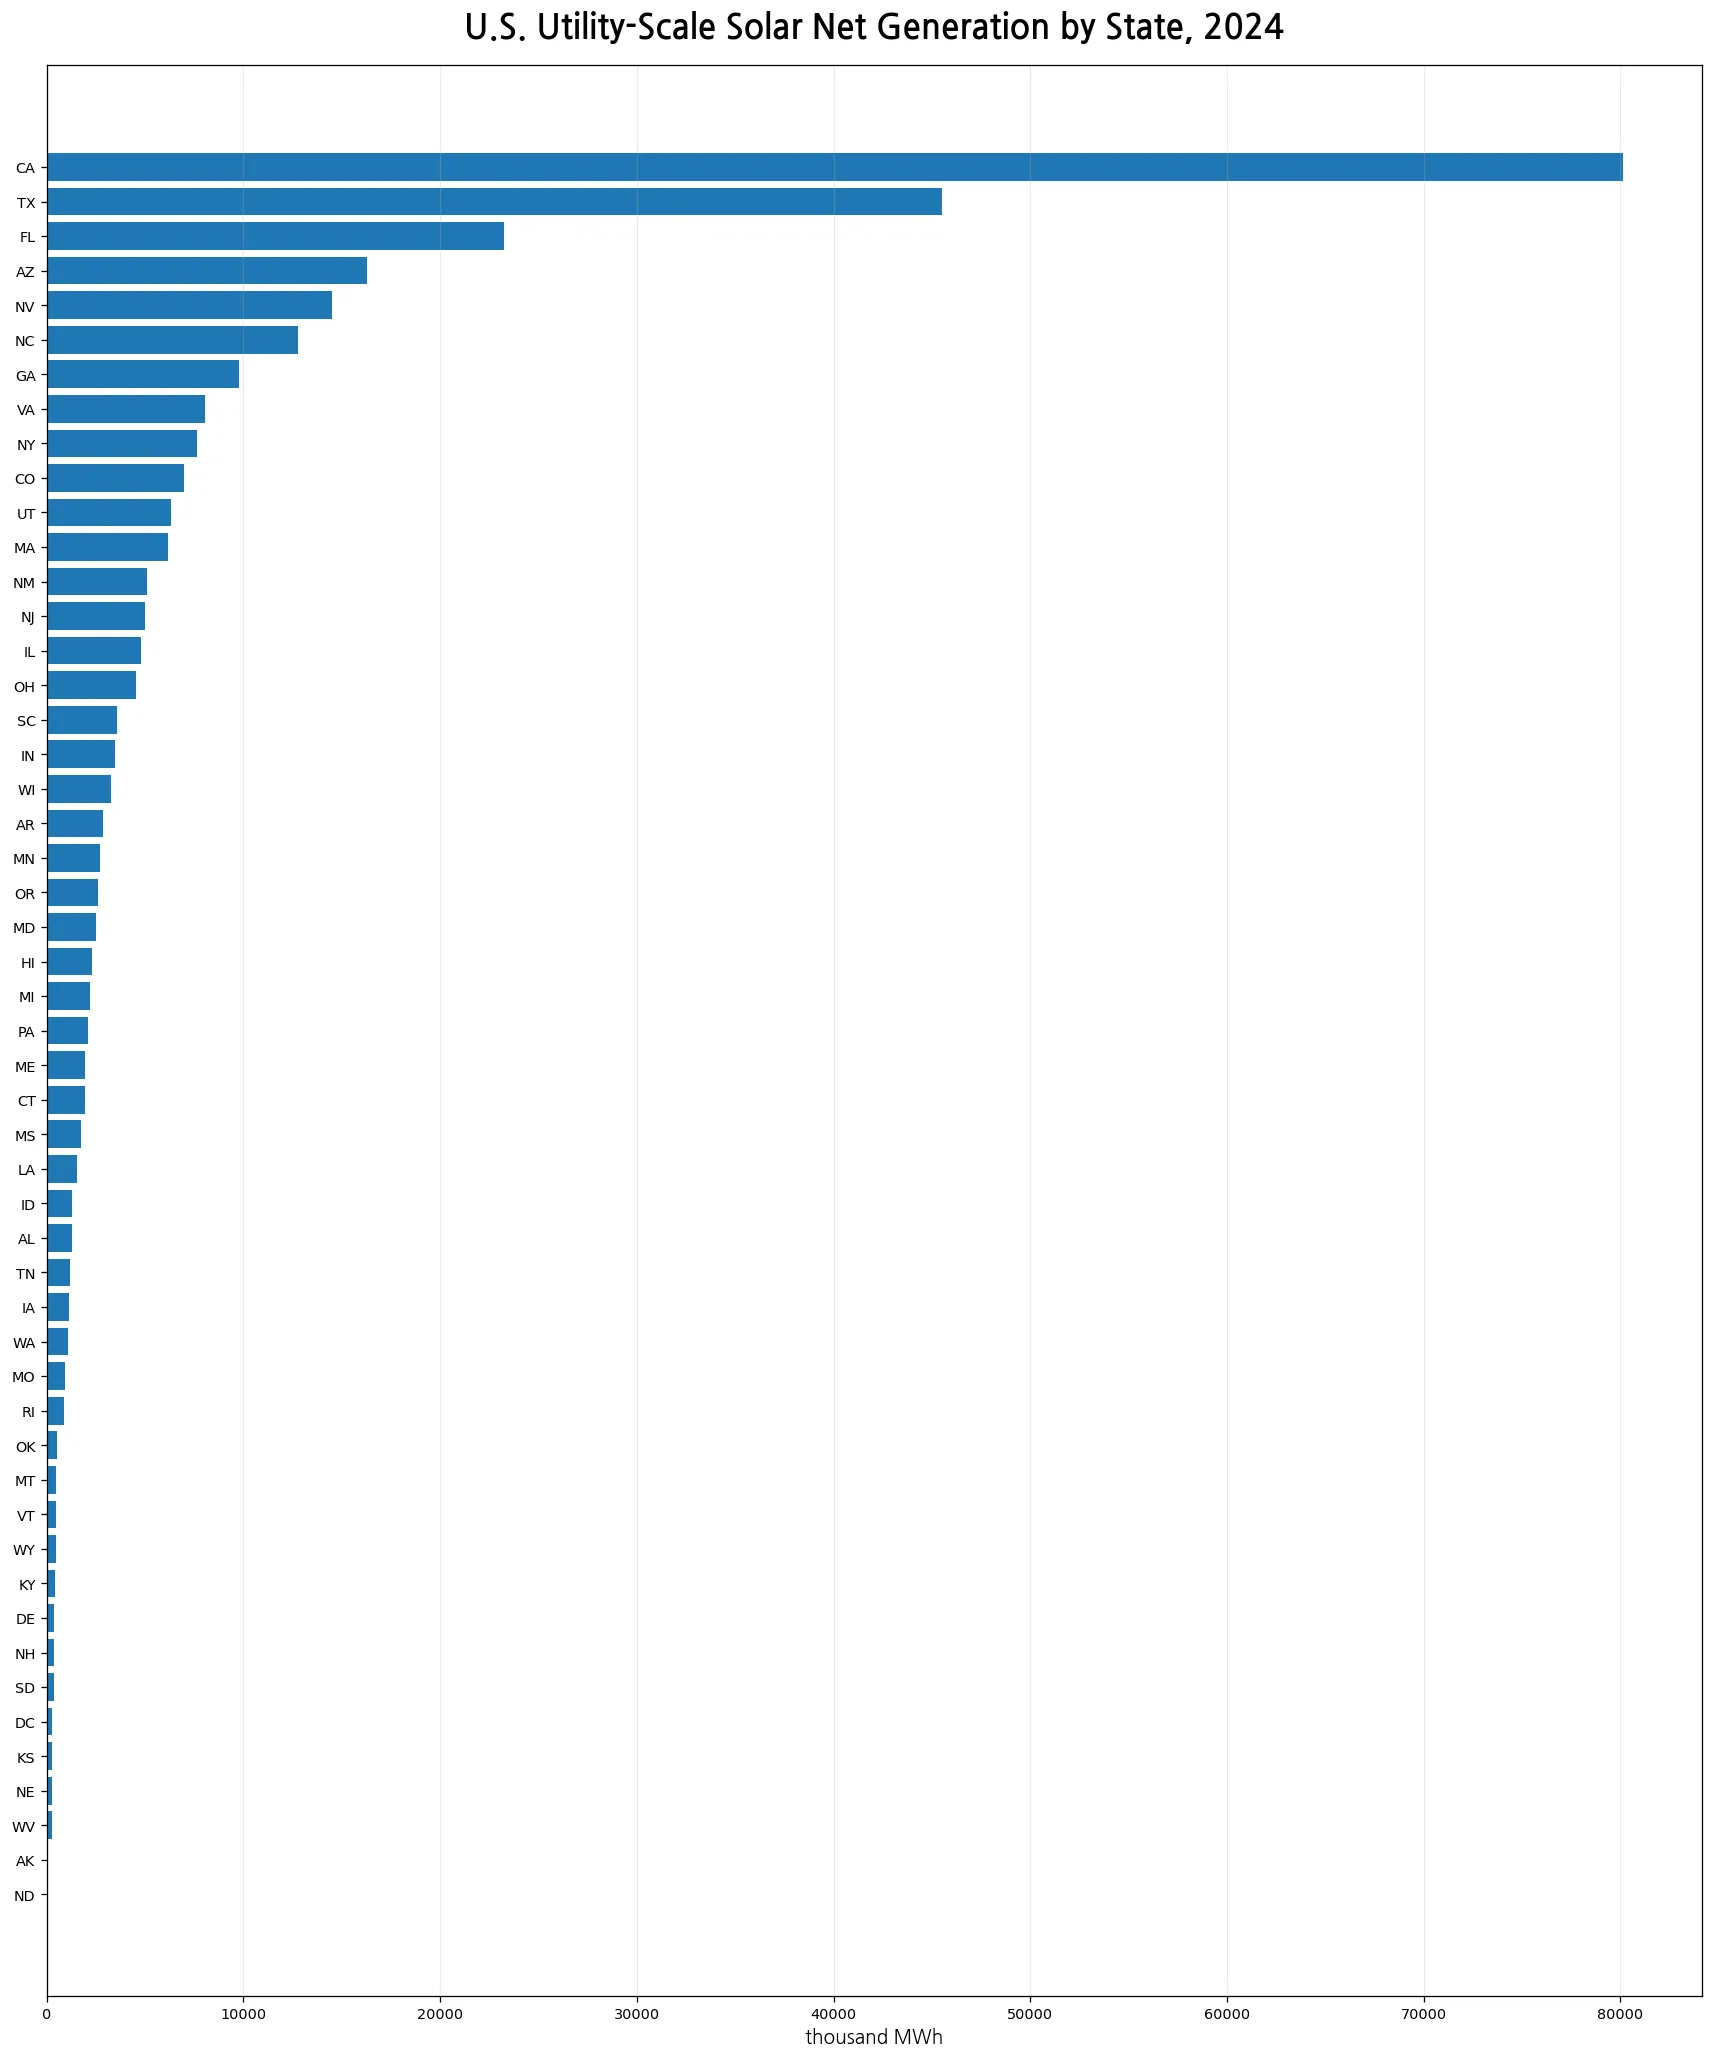
Table of Contents
California and Texas together accounted for more than 41% of the state-level sum
California contributes 26.39% of the 51-observation sum, while Texas contributes 14.98%. Together they account for 41.37%. California produced about 1.76 times the Texas value in this series. Adding Florida raises the top-three share to 49.03%, meaning that almost half of the state-level total is concentrated in just three states. This is the clearest numerical pattern in the 2024 distribution.
The concentration also explains why the mean and median are far apart. The average state-level observation is 5,955.921 thousand MWh, while the median is only 2,069.200 thousand MWh. A few very large observations pull the mean upward. For a reader trying to understand a “typical” state in this dataset, the median is therefore more informative than the mean alone. The full-state chart complements the top-ten chart because it preserves the long lower half of the distribution rather than focusing only on the largest markets.
The top 10 states produced about three-quarters of the 51-state sum
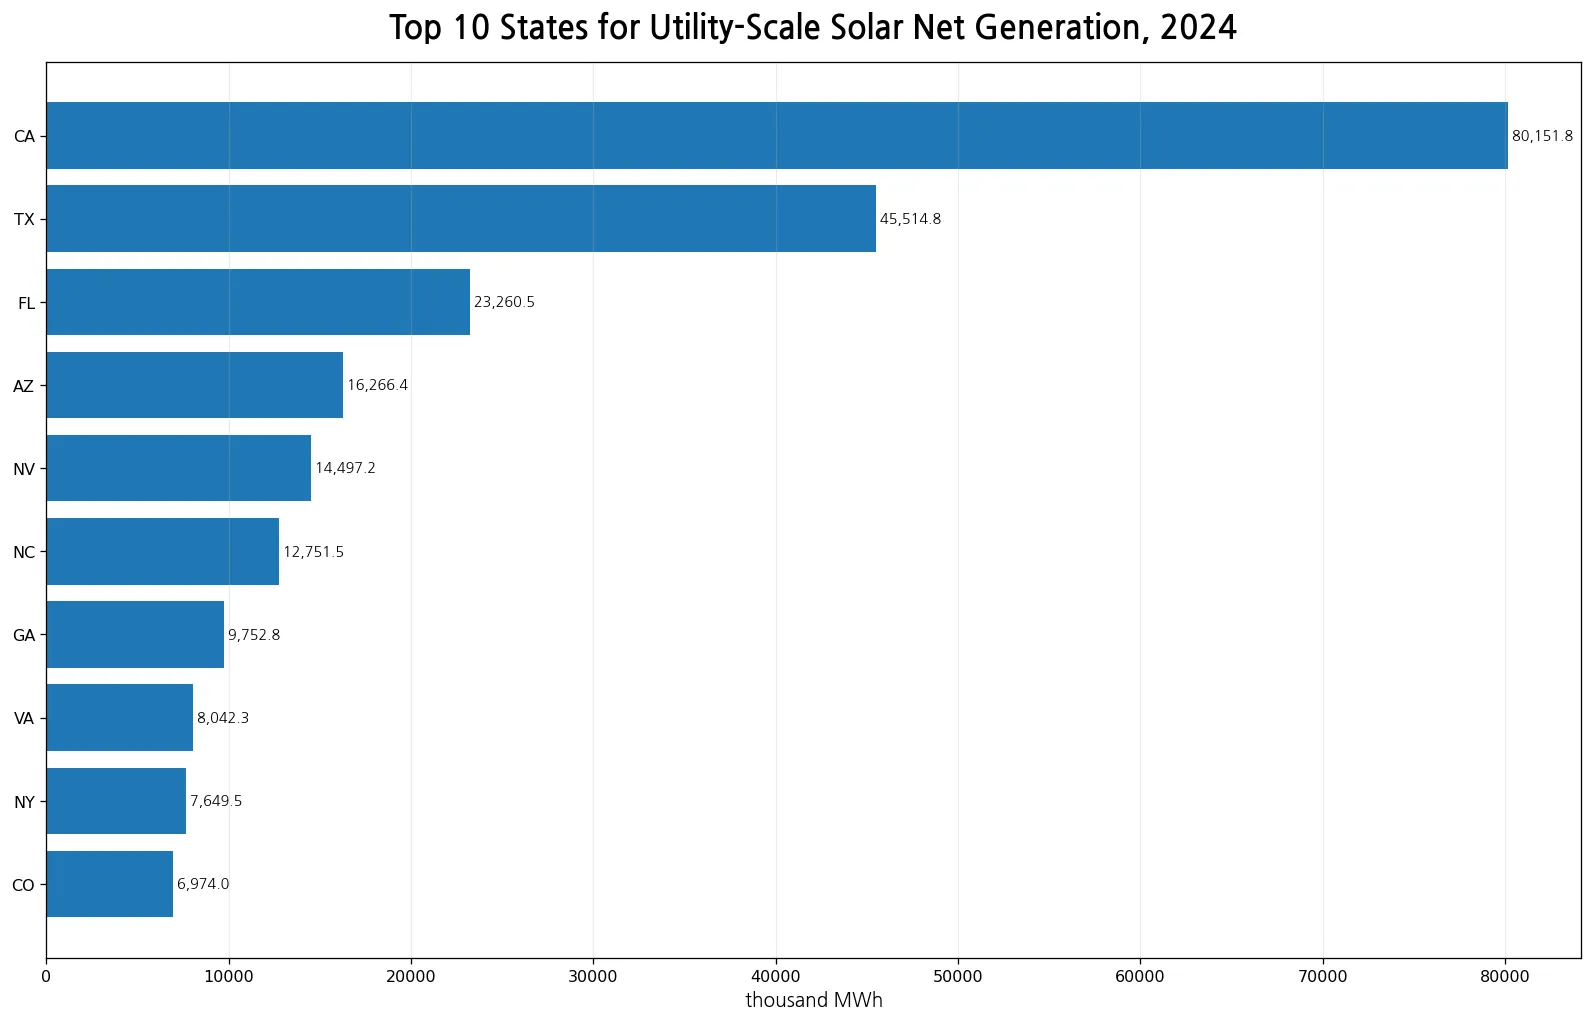
The first five states—California, Texas, Florida, Arizona, and Nevada—account for 59.16% of the sum. Expanding the group to the top ten by adding North Carolina, Georgia, Virginia, New York, and Colorado raises the share to 74.03%. Put differently, ten jurisdictions contain almost three-quarters of the generation represented by these 51 state observations. That does not mean the other states lack utility-scale solar. It means the reported 2024 output is highly uneven across the state-level distribution.
| State | thousand MWh | Share of 51-observation sum |
|---|---|---|
| California | 80,151.829 | 26.39% |
| Texas | 45,514.757 | 14.98% |
| Florida | 23,260.533 | 7.66% |
| Arizona | 16,266.414 | 5.36% |
| Nevada | 14,497.217 | 4.77% |
| North Carolina | 12,751.542 | 4.20% |
| Georgia | 9,752.826 | 3.21% |
| Virginia | 8,042.340 | 2.65% |
| New York | 7,649.526 | 2.52% |
| Colorado | 6,974.011 | 2.30% |
Arizona, Nevada, and North Carolina form a substantial second tier
Arizona recorded 16,266.414 thousand MWh, Nevada 14,497.217 thousand MWh, and North Carolina 12,751.542 thousand MWh. Those figures are well below California and Texas but still clearly above the middle of the distribution. The presence of Florida, Georgia, Virginia, and New York among the leaders also shows that high 2024 output is not confined to one narrow geographic pattern. The data establish where generation was high; they do not, by themselves, establish why.
Possible explanations for state differences can include installed solar capacity, the mix of utility-scale photovoltaic and other solar technologies in the EIA classification, solar resource conditions, plant operating hours, curtailment, transmission conditions, and the timing of new projects. Those are plausible analytical dimensions, not conclusions from this single table. A causal explanation would require matched capacity, generation, resource, and operational data. Keeping that distinction clear prevents a descriptive ranking from being turned into a claim about policy effectiveness or solar-resource quality.
All 51 jurisdictions have positive published values
There are no missing observations in the supplied 2024 state table and no published zero values. All 51 jurisdictions have generation above zero; the smallest observation is 2.975 thousand MWh. No missing row was converted to zero, and no state value was estimated by interpolation in this analysis. That makes the ranking straightforward: every state-level position is based on a published numeric observation from the same annual series.
A small number in this series should still not be interpreted as “almost no solar electricity of any kind.” The dataset is a specific EIA utility-scale operational-data series using the TSN fuel facet. Distributed residential or other solar activity outside the scope of this utility-scale series should not be silently added to the interpretation. The safe statement is that a state recorded a small value in this particular EIA series, not that the state had almost no solar generation across every possible statistical boundary.
Net generation and installed capacity answer different questions
Net generation is an energy-flow measure: it reports how much electricity was produced over a period after the accounting conventions used by the source. Installed capacity is a power rating that describes the potential scale of generating equipment. Two states with similar capacity can produce different annual generation because of resource conditions, technology, plant availability, curtailment, maintenance, and the dates when projects entered service. The 2024 generation values therefore cannot be used as a direct capacity ranking or as a capacity-factor calculation without a compatible capacity dataset.
The same caution applies when comparing this series with EIA fuel-consumption data. Fuel consumption in Btu measures an energy input; generation in MWh measures an electricity output. Calculating efficiency by dividing one article’s Btu values by another article’s MWh values would only be defensible if the fuel, sector, plant scope, and time period matched exactly and the underlying definitions supported that use. The labels may look related, but the fields answer different questions.
This is a 2024 cross-section, not a growth ranking
The figures describe one year. They do not show which state added solar the fastest, which state had the largest year-over-year increase, or which state has the strongest long-run growth trend. Answering those questions requires a multi-year series using the same fuel facet, sector facet, field, frequency, and unit. A state can rank high in absolute generation while growing slowly, and a small state can have a high growth rate while still contributing relatively little electricity in absolute terms.
That distinction is especially important for California and Texas. Their large 2024 values demonstrate scale in this cross-section, but the table alone does not say whether either state accelerated or slowed relative to 2023. Florida’s third-place position likewise describes the 2024 level, not the speed of expansion. Treating levels and growth rates as interchangeable would overstate what the data show.
How to read the lower half of the distribution
The median of 2,069.200 thousand MWh marks the midpoint of the 51 jurisdictions. Half are at or below that figure and half are at or above it. The smallest values are far below the median, while the top five values rise rapidly into the tens of thousands of MWh. This wide range is why a logarithmic scale can sometimes help exploratory analysis, but the charts here retain ordinary values so readers can see the actual magnitude differences directly.
The lower-ranked states are still important for understanding the national state-by-state pattern. They show that utility-scale solar output is present across all 51 jurisdictions in this series but is distributed very unevenly. Looking only at California, Texas, and Florida would capture nearly half of the summed output but would hide the breadth of deployment represented by the remaining observations. Conversely, treating every state equally in a simple unweighted narrative would hide the strong concentration at the top.
Source and calculation method
The source is the U.S. Energy Information Administration annual electricity/electric-power-operational-data series. The query is fixed to year 2024, fueltypeid=TSN, sectorid=99, and field=generation, with values reported in thousand megawatthours. The analysis uses the 50 states and the District of Columbia, for 51 observations. Their arithmetic sum is 303,751.962 thousand MWh, the mean is 5,955.921, and the median is 2,069.200. Each state share is the state value divided by the sum of those same 51 observations.
That denominator should be described precisely as the sum of the published state-level observations used here. It is not independently redefined as a national EIA total. Anyone reproducing the comparison should preserve the full series identity rather than matching only the broad words “solar” and “generation.” A different EIA sector, a different solar fuel code, a different year, or a different field can produce a separate but equally valid dataset.
Frequently Asked Questions
Which state had the most utility-scale solar net generation in 2024?
California ranked first at 80,151.829 thousand MWh, equal to 26.39% of the sum of the 51 state-level observations.
Do these values measure installed solar capacity?
No. The unit is thousand MWh of net generation. Installed capacity is a separate measure usually reported in MW.
What do TSN and sector 99 mean in this EIA series?
EIA labels TSN as estimated total solar, and sectorid=99 is the All Sectors slice in this operational-data route.
Are any states missing or reported as zero?
No. All 50 states and the District of Columbia have published numeric observations above zero in the 2024 table.
Related Articles
Green Map creates custom-edited map images using open geographic data sources such as geoBoundaries, Natural Earth, OpenStreetMap, and government open data. These maps are edited visual materials, not raw data files, and are provided for education, documents, presentations, and graphic reference.