Average heat content for petroleum consumed in the U.S. electric power sector was tightly clustered across most states in 2025, but a few states stood well outside the central range. In the EIA annual state data, Ohio recorded the highest value at 6.5038 million Btu per barrel, followed by Maine at 6.2871 and Hawaii at 6.1357. Michigan was the clear low outlier at 3.9349, while Alaska was second-lowest at 5.0321.
This measure is not petroleum consumption volume. It describes the average energy content of a barrel of petroleum fuel consumed by the electric power sector. A state with a higher value did not necessarily burn more petroleum, generate more electricity, or operate more efficiently. EIA petroleum heat-content tables use million Btu per barrel, which is the scale used for the 2025 values summarized here.
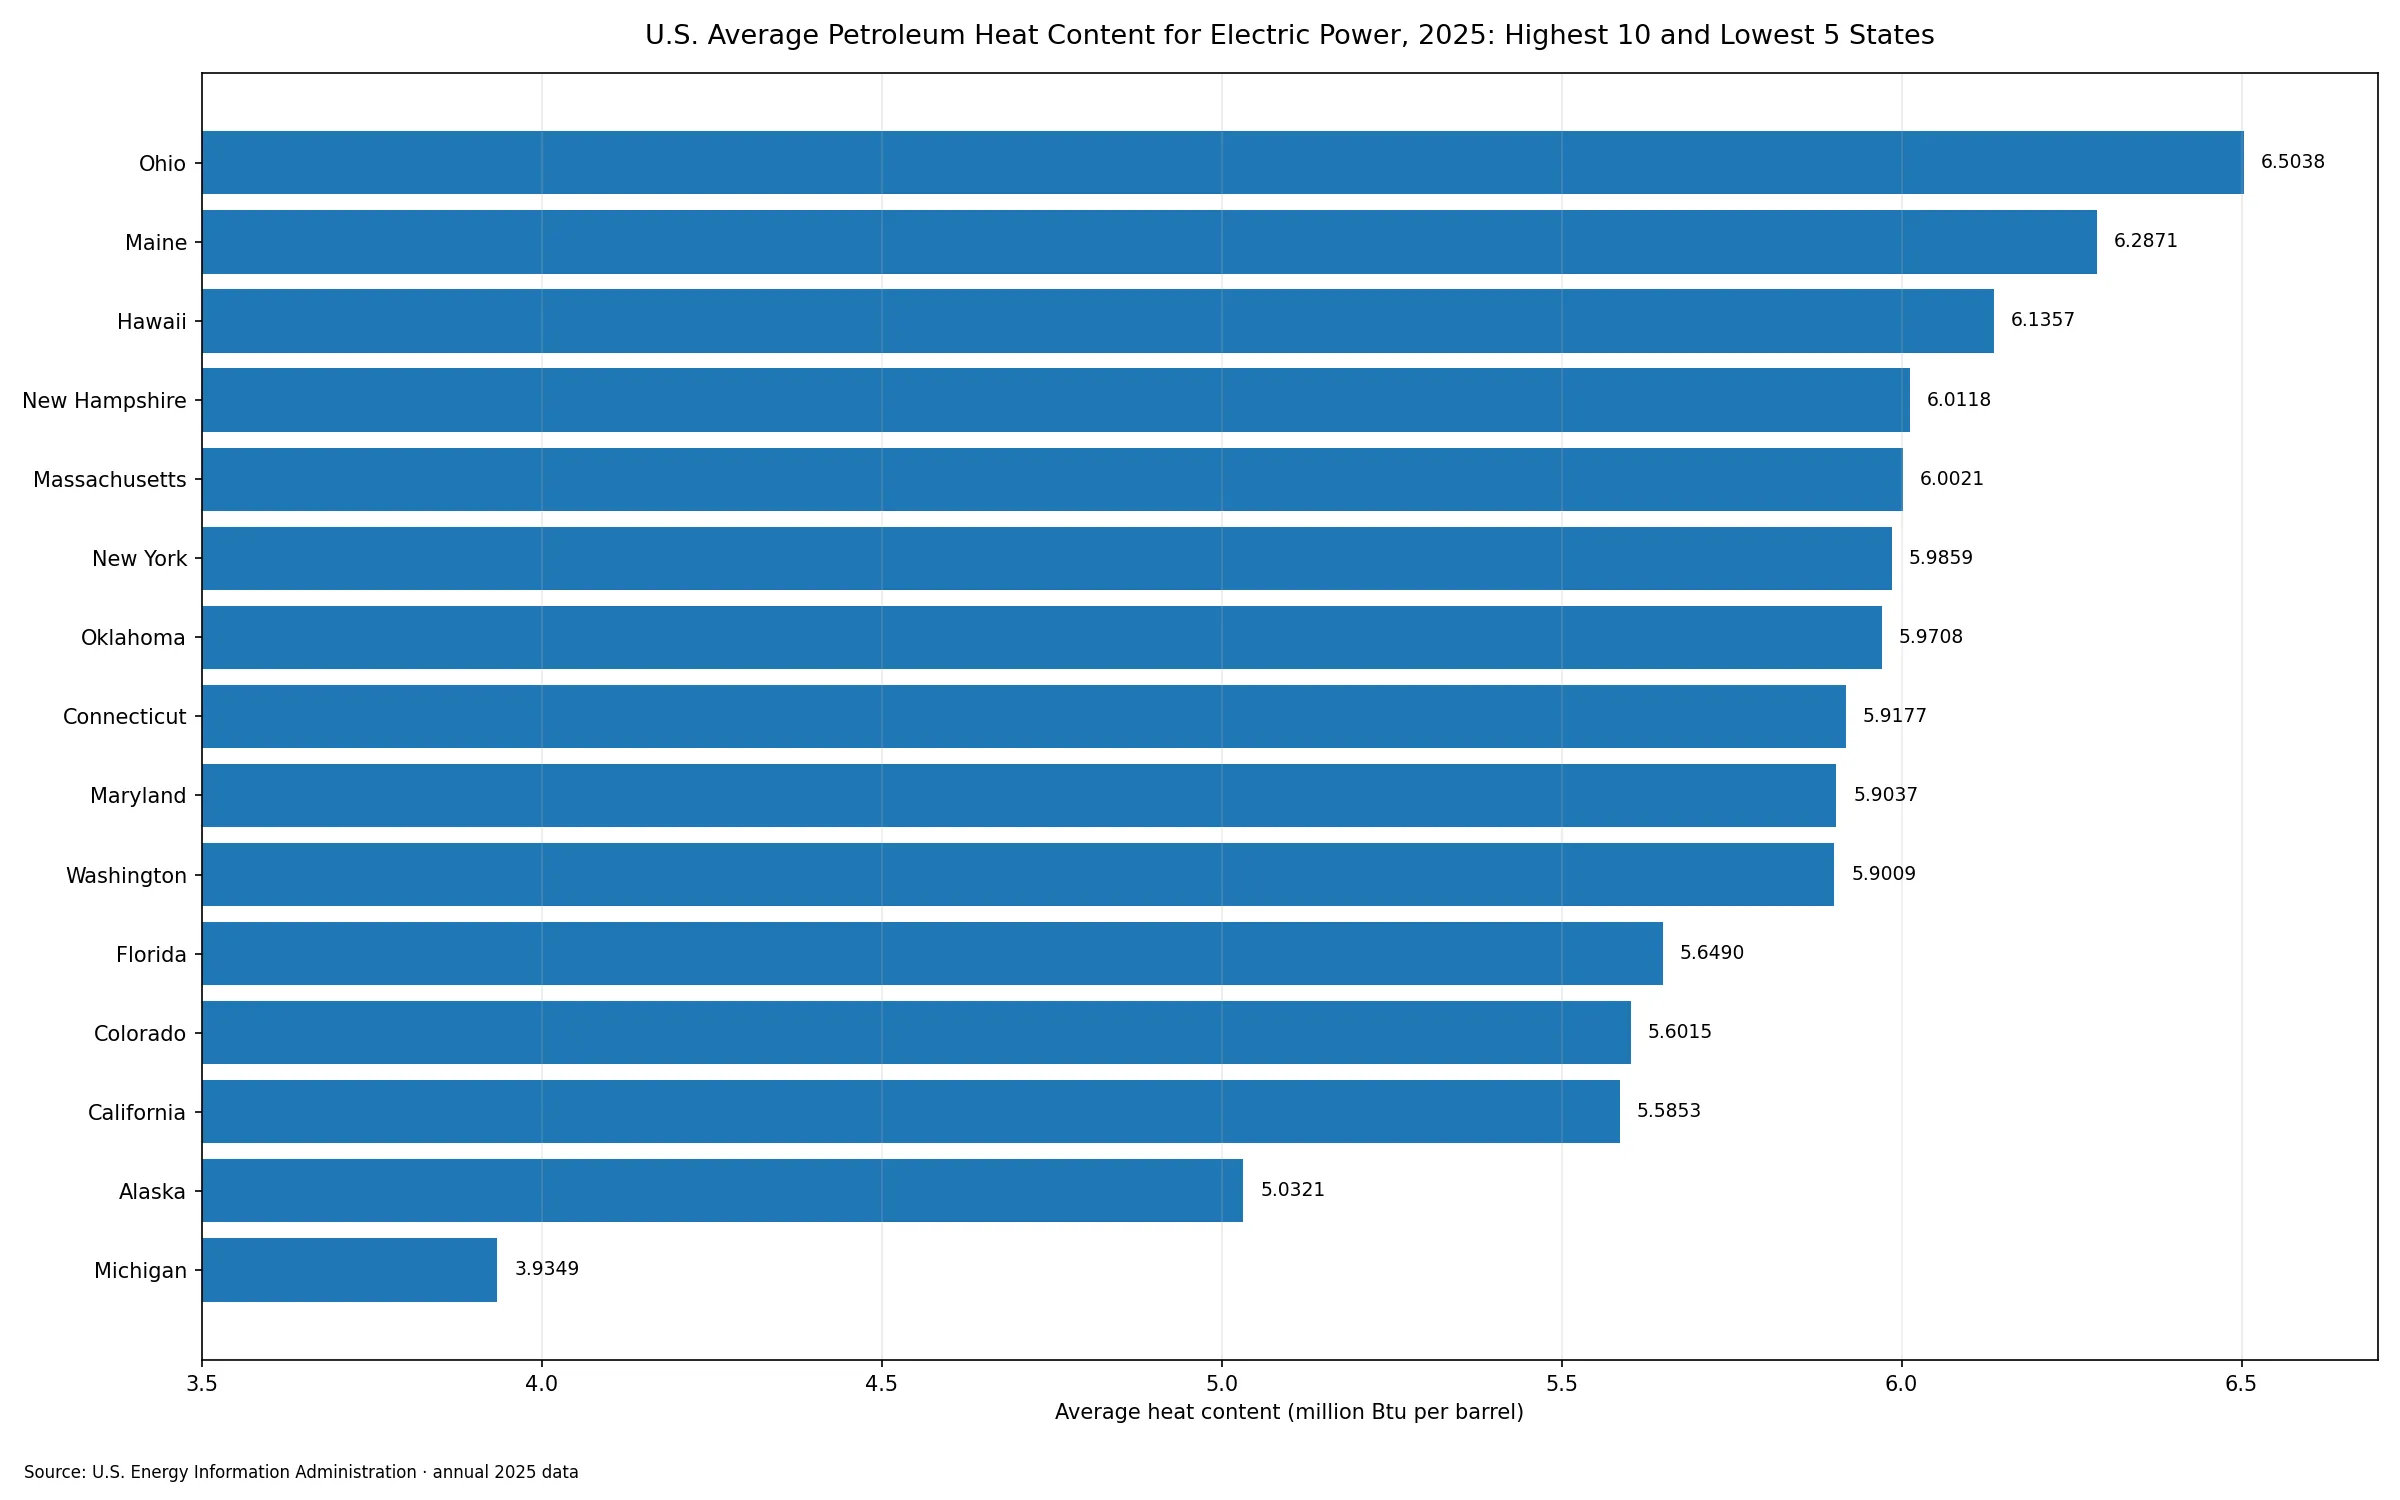
Table of Contents
What average petroleum heat content measures
Heat content converts a physical quantity of fuel into an energy quantity. For petroleum, the comparison can be expressed as the energy contained in an average barrel. If two plants consume the same number of barrels but the fuels have different compositions, their total energy input can differ. Heat-content factors therefore matter when physical fuel quantities are converted into Btu.
The metric should not be confused with power-plant heat rate, which relates fuel energy input to electricity output and is often used in efficiency analysis. It is also different from the number of barrels consumed. This article keeps the EIA filters fixed to petroleum, the electric power sector, annual frequency, and 2025, then compares the resulting state-level average heat-content values.
Ohio and Maine formed the top of the 2025 distribution
Ohio led at 6.5038 million Btu per barrel. Maine followed at 6.2871, Hawaii at 6.1357, New Hampshire at 6.0118, and Massachusetts at 6.0021. Those were the only five states at or above 6.0. New York, at 5.9859, and Oklahoma, at 5.9708, were just below that threshold.
A high position in this ranking should not be read as a quality score. The petroleum category can contain different petroleum products, and a state average can reflect the mixture of fuels actually consumed in that state’s electric-power facilities. The values are therefore better interpreted as state-specific conversion characteristics than as a ranking of better or worse fuels.
The 10 highest state values
| State | Average heat content (million Btu/barrel) |
|---|---|
| Ohio | 6.5038 |
| Maine | 6.2871 |
| Hawaii | 6.1357 |
| New Hampshire | 6.0118 |
| Massachusetts | 6.0021 |
| New York | 5.9859 |
| Oklahoma | 5.9708 |
| Connecticut | 5.9177 |
| Maryland | 5.9037 |
| Washington | 5.9009 |
Eight of the top ten states were at or above 5.9 million Btu per barrel. Washington at 5.9009 and Delaware at 5.9001 were almost identical. The numerical gaps matter: after the two largest values, many states in the upper tier are separated by only a few hundredths of a million Btu per barrel.
Most states were packed into a narrow band
The median across the 50 states was 5.8030 million Btu per barrel, while the simple mean of the 50 state averages was 5.7862. A total of 43 states fell between 5.5 and 6.0, and 45 states were within plus or minus 5% of the median. The broad national picture is therefore one of substantial clustering rather than large differences everywhere.
The first quartile was 5.7706 and the third quartile was 5.8864, an interquartile range of only 0.1157. Half of all states sat inside that very compact interval. Looking only at the maximum and minimum would make the distribution appear much more dispersed than it is for the typical state.
Michigan and Alaska widened the lower tail
Michigan had the lowest value, 3.9349 million Btu per barrel. Alaska was next at 5.0321. The next three states were California at 5.5853, Colorado at 5.6015, and Florida at 5.6490, so the distribution returned quickly to the main cluster after those two lower observations. The full Ohio-to-Michigan range was 2.5689 million Btu per barrel.
The state averages alone do not explain why those observations are low. Differences could reflect the petroleum products consumed, the mix of generating units using those products, operating patterns during the year, or reporting composition. Identifying the reason would require plant-level or more detailed fuel-code data. The state series supports comparison of the outcomes, not a causal diagnosis.
Why the mean is slightly below the median
The simple mean of 5.7862 is a little below the median of 5.8030. The low values for Michigan and Alaska pull the arithmetic average downward. High values in Ohio and Maine push in the opposite direction, but the lower tail is strong enough that the average remains below the midpoint of the ranked states.
For that reason, the median and interquartile range are more useful than the mean alone for describing a typical state. The central half of states occupied only a narrow span around 5.8 million Btu per barrel, even though the full range was much wider.
How this differs from a petroleum-consumption ranking
A petroleum-consumption ranking answers a volume question: where were the most barrels consumed? Heat content answers an energy-density question: how much energy was contained in an average barrel of the petroleum consumed? A state can rank low in consumption but high in heat content, or the reverse. The two measures should not be substituted for one another.
The distinction also matters when converting barrels into energy units. Multiplying a physical fuel quantity by an appropriate heat-content factor yields an energy estimate. If state-specific averages differ, using one national factor for every state can hide some of that variation. Whether the difference is material depends on the analysis and the amount of fuel being converted.
The 2025 slice should not be turned into a year-over-year claim without matching data
A related article on this site covers a 2024 petroleum-liquids heat-content series. The current dataset is a 2025 annual state slice. Because the verified file used here contains only 2025, this article does not calculate year-over-year changes or claim that a state increased or decreased from 2024.
A valid annual comparison requires the same EIA route, fuel definition, sector, unit, and geographic coverage for both years. If one of those filters changes, the numbers may no longer be directly comparable. Keeping the data identity fixed is more important than simply placing two similarly titled series side by side.
What this statistic cannot tell you
- It does not show how many barrels of petroleum a state consumed.
- It does not measure generator efficiency or operating heat rate.
- A higher heat-content value is not automatically better economically or environmentally.
- The state averages do not identify the causal reason for the differences.
- The file contains annual 2025 observations for the 50 states and does not include the District of Columbia.
Source and calculations
The source is the U.S. Energy Information Administration electric power operational data API, filtered to annual 2025 observations, petroleum (fueltypeid=PET), the electric power sector (sectorid=98), and the heat-content field. The cleaned state slice contains 50 observations with no missing state values, and no missing values were replaced with zeros.
The values are presented as million Btu per barrel, consistent with EIA petroleum heat-content reporting. The mean, median, quartiles, ranges, and counts in this article were calculated directly from the same 50 state observations. They summarize the distribution of state averages; they are not a consumption-weighted national heat-content estimate.
The clearest conclusion is that 2025 state petroleum heat content for electric power was broadly similar across most of the country, with a compact center around 5.8 million Btu per barrel. Ohio and Maine stood above the main cluster, while Michigan and Alaska created the most visible lower-tail departures. Reading the metric as energy content rather than fuel volume is essential to interpreting the ranking correctly.
Frequently Asked Questions
Which state had the highest average petroleum heat content for electric power in 2025?
Ohio was highest at 6.5038 million Btu per barrel, followed by Maine and Hawaii.
Does higher heat content mean a state consumed more petroleum?
No. Heat content measures energy per barrel, not the number of barrels consumed or the amount of electricity generated.
Where did most states fall?
Forty-three of the 50 states were between 5.5 and 6.0 million Btu per barrel, and the median was 5.8030.
Related Articles
Green Map creates custom-edited map images using open geographic data sources such as geoBoundaries, Natural Earth, OpenStreetMap, and government open data. These maps are edited visual materials, not raw data files, and are provided for education, documents, presentations, and graphic reference.