The 2025 EIA state slice for fossil fuels used to support useful thermal output in the Electric Power sector is unusually concentrated. Across the 50 states in the verified file, fuel-energy input totals 420.47 million MMBtu. Texas alone accounts for 183.89 million MMBtu, or 43.7% of the total. Michigan, the second-ranked state, reports 30.56 million MMBtu. Texas is therefore about 6.0 times Michigan on this specific measure.
This is a combined-heat-and-power (CHP) metric, not a general ranking of electricity generation. The U.S. Energy Information Administration defines useful thermal output as thermal energy from a CHP system that is made available for industrial or commercial processes, heating, cooling, or other end uses rather than electrical generation. The field used here, consumption-uto-btu, measures the fuel energy consumed for that useful-thermal-output function. It does not directly report the thermal output delivered, electricity produced, or CHP efficiency.
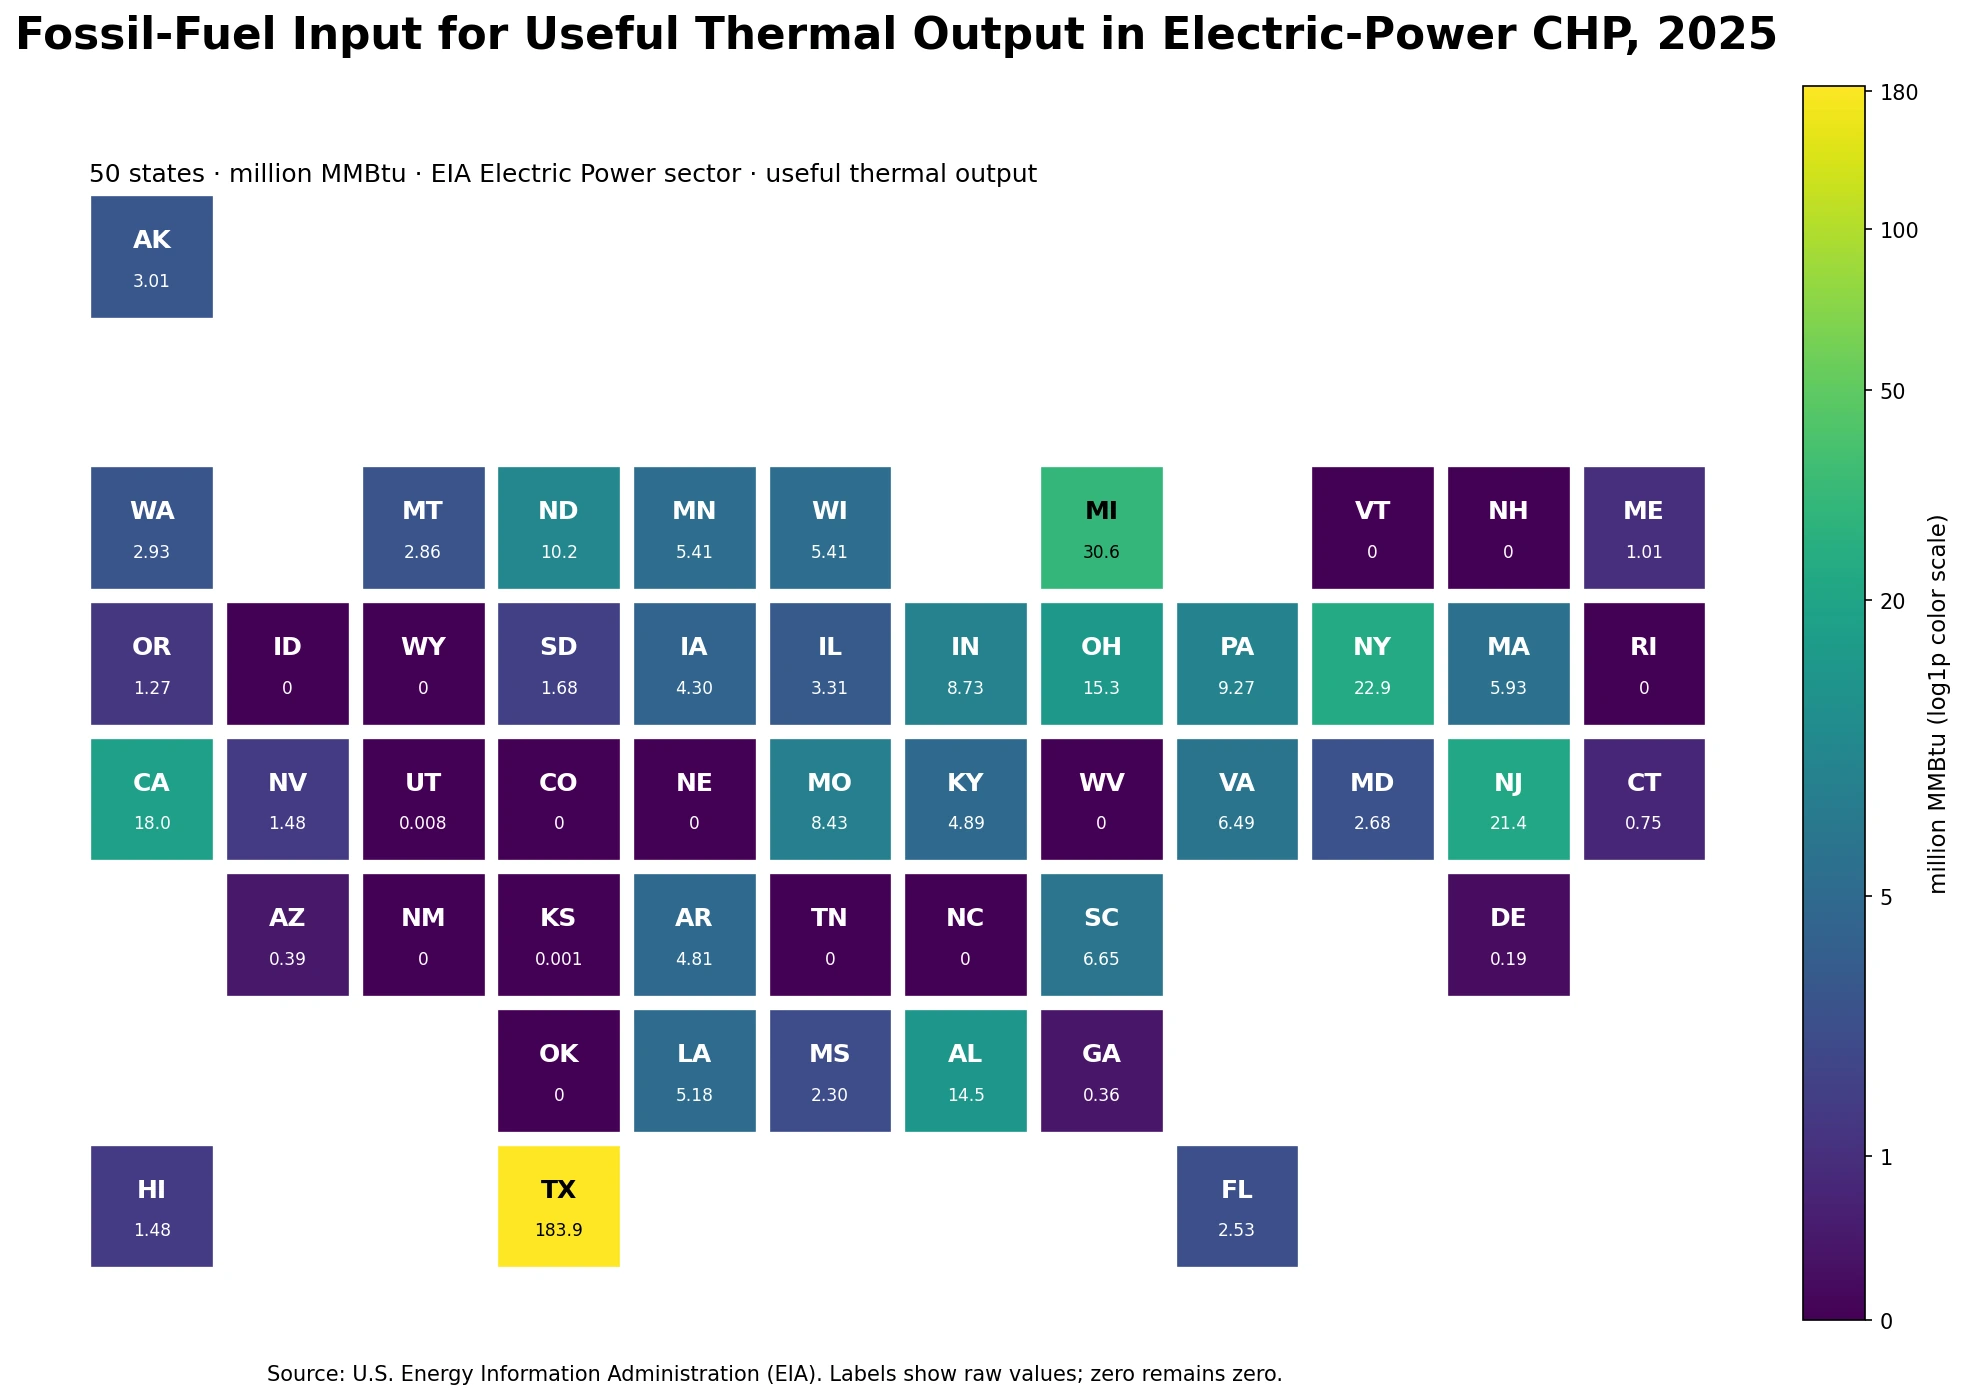
Table of Contents
The top five states supplied 65.8% of the 50-state total
After Texas, the largest observations are Michigan at 30.56, New York at 22.91, New Jersey at 21.36, and California at 18.01 million MMBtu. Together, those five states represent 65.8% of the total. Expanding the group to ten states raises the share to 79.6%. That concentration is the clearest pattern in the data: useful-thermal-output fossil-fuel input within the Electric Power sector is not distributed evenly across the country.
| State | 2025 fossil-fuel input (million MMBtu) | Share of 50-state total |
|---|---|---|
| Texas | 183.89 | 43.7% |
| Michigan | 30.56 | 7.3% |
| New York | 22.91 | 5.4% |
| New Jersey | 21.36 | 5.1% |
| California | 18.01 | 4.3% |
| Ohio | 15.31 | 3.6% |
| Alabama | 14.50 | 3.4% |
| North Dakota | 10.18 | 2.4% |
| Pennsylvania | 9.27 | 2.2% |
| Indiana | 8.73 | 2.1% |
The other 49 states combined total 236.58 million MMBtu. Texas alone equals roughly 77.7% of that non-Texas amount. That comparison is useful for scale, but it should not be turned into a judgment about efficiency. A large absolute input can reflect the size of CHP operations, hours of operation, thermal demand, plant configuration, or fuel mix. The state-level aggregate does not isolate those drivers.
A median of 2.60 million MMBtu tells a different story from the mean
The unweighted mean across the 50 states is 8.41 million MMBtu, while the median is only 2.60. The first quartile is 0.0029 and the third quartile is 6.35. The large gap between the mean and median reflects the long upper tail created by Texas and a smaller group of other high-input states. For a reader asking what a middle-ranked state looks like, the median is far more representative than the mean.
The tile map uses equal visual area for every state precisely because geographic area would not help answer this question. A conventional geographic map can make large western states visually dominant even when their values are small. The tile layout keeps attention on the measured quantity. The color transformation is only a display device: the printed labels retain the original figures, including exact zeros.
Twelve states are reported as exactly zero, and that is not the same as missing
The verified 2025 file contains all 50 states, and 12 of them have an EIA value of exactly 0.00000: Idaho, Colorado, Nebraska, New Hampshire, New Mexico, North Carolina, Oklahoma, Rhode Island, Tennessee, Vermont, West Virginia, Wyoming. Those records remain zero in the calculations. They are not replaced with estimates and are not treated as missing. The District of Columbia is different: it is not a row in this 50-state slice, so the article does not invent a D.C. value or add it to the denominator.
There are 38 states with positive observations. Some are tiny but nonzero, including Kansas at 0.00113 and Utah at 0.00816 million MMBtu. Preserving those small positive numbers matters because rounding them to zero would erase the distinction between reported zero consumption and a very small reported amount. The chart therefore gives additional decimal precision for values below 0.1.
Sector 98 keeps this article separate from the all-sector useful-heat total
The EIA operational dataset contains closely named series that differ only by facets. This article uses the Electric Power sector slice identified in the package as sectorid=98. A total-across-all-sectors series uses a different sector facet and can include commercial and industrial CHP activity in addition to the electric-power component. Even when year, fossil-fuel grouping, field name and units are identical, changing the sector facet changes the statistical question.
The same distinction appears in EIA’s Electric Power Annual, where “Useful Thermal Output by Energy Source: Electric Power Sector Combined Heat and Power” is presented separately from “Total Combined Heat and Power (All Sectors).” Keeping that boundary explicit prevents a duplicate-content problem and, more importantly, prevents an analytical error. This page answers where Electric Power-sector CHP fossil-fuel input for useful heat was concentrated, not where all U.S. CHP fuel use was concentrated.
FOS is a combined fossil-fuel category, not a fuel-mix breakdown
The fuel facet is FOS, a fossil-fuel aggregate. The 183.89 million MMBtu reported for Texas therefore should not be read as natural gas alone, coal alone, or petroleum alone. The state total can be produced by different combinations of fossil fuels. Determining the composition requires additional EIA slices by individual fuel type. This article intentionally stops at the aggregate because that is what the verified dataset measures.
The same limitation applies to emissions. One MMBtu of different fossil fuels does not imply the same carbon dioxide emissions, and CHP systems can differ in how effectively they use both electricity and heat. A map of aggregate fuel input is therefore not a carbon-intensity map. State emissions would require fuel-specific consumption and appropriate emissions factors, while CHP performance would require output as well as input.
Fuel consumed for useful thermal output is an input, not an output
The wording of the field can be misleading because “useful thermal output” appears in its name. The quantity reported here is the Btu content of fuel consumed for the useful-heat function. It is not the amount of useful heat actually delivered to a process or customer. A state with a high input may also have high thermal output, but the ratio between those two quantities cannot be recovered from this table alone.
It also should not be combined casually with fuel consumed for electricity generation. CHP plants produce electricity and recover useful heat, so the two functions are related operationally, but EIA reports separate measures. Electricity-generation fuel input answers one question; useful-thermal-output fuel input answers another. Combining them is appropriate only when the objective and definitions explicitly call for total CHP fuel consumption.
What the state ranking can and cannot tell you
The ranking is well suited to a spatial-scale question: where was the absolute fossil-fuel energy input associated with useful thermal output in Electric Power-sector CHP largest in 2025? It is not normalized by population, electricity sales, industrial output, CHP capacity, or thermal demand. A small state can rank high if it hosts large CHP operations, while a populous state can rank low if its Electric Power-sector CHP useful-heat activity is limited.
A single year also cannot establish a trend. To determine whether Texas, Michigan or another state increased or decreased structurally, the same sector, fuel group, field and unit would need to be retrieved for multiple years. Changing any one of those facets would create a different series. The safest interpretation is therefore cross-sectional: this is the 2025 distribution under one fixed EIA definition.
- All 50 observations use the same year, 2025.
- The unit is million MMBtu of fuel-energy input.
- Twelve states are reported as exactly zero; those are not missing values.
- D.C. is outside this verified 50-state slice and is not assigned a synthetic zero.
- Color uses a log1p display scale; rankings, shares and summaries use raw values.
Source and calculation method
U.S. Energy Information Administration, Electric Power Operational Data is the primary dataset. The verified facets are annual 2025, fueltypeid=FOS, sectorid=98 and field=consumption-uto-btu. Interpretation follows the EIA definition of useful thermal output and the agency’s separate CHP tables for the Electric Power sector and all sectors.
Using the 50 published state observations without imputation gives a total of 420.47, a mean of 8.41, and a median of 2.60 million MMBtu. Texas contributes 43.7% of the total. The top five states contribute 65.8% and the top ten 79.6%. No other year or sector was mixed into those calculations.
Frequently Asked Questions
Which state had the largest fossil-fuel input for Electric-Power CHP useful heat in 2025?
Texas ranked first at 183.89 million MMBtu, equal to 43.7% of the total across the 50 states in the verified dataset.
Does consumption-uto-btu measure useful thermal output itself?
No. It measures the fuel-energy input consumed for the useful-thermal-output function. Delivered useful heat and CHP efficiency require output measures in addition to fuel input.
Are the 12 state zeros missing data?
No. Twelve states are published as exactly 0.00000 in the verified 2025 file. D.C. is different because it is not a row in this 50-state slice and is not assigned a synthetic zero.
How is this different from the all-sector fossil-fuel useful-heat series?
This article uses the Electric Power sector facet, sectorid=98. An all-sector CHP aggregate includes additional sector categories, so it is a separate series even when the fuel group, year and unit are the same.
Related Articles
Green Map creates custom-edited map images using open geographic data sources such as geoBoundaries, Natural Earth, OpenStreetMap, and government open data. These maps are edited visual materials, not raw data files, and are provided for education, documents, presentations, and graphic reference.