Open defecation is an internationally defined sanitation condition in which people defecate in fields, forests, bushes, open bodies of water, beaches or other open spaces, or dispose of feces with solid waste rather than using a sanitation facility. Country-level prevalence is now very low in many places, but the latest available observations still show large gaps between countries and areas.
The World Bank series SH.STA.ODFC.ZS contains 214 latest non-missing country and area observations in the supplied dataset. 184 observations are from 2024; the other 30 use the latest available value from 2014 through 2023. This is therefore a latest-observation comparison through 2024, not a single-year 2024 table for all 214 economies.
Across the 214 latest observations, the median is 0.13% and the simple unweighted mean is 5.06%. Exactly 86 observations are reported as 0%, while 135 are below 1%. Only 6 are at or above 40%. The large gap between the mean and median reflects a strongly right-skewed distribution with a small number of very high values.
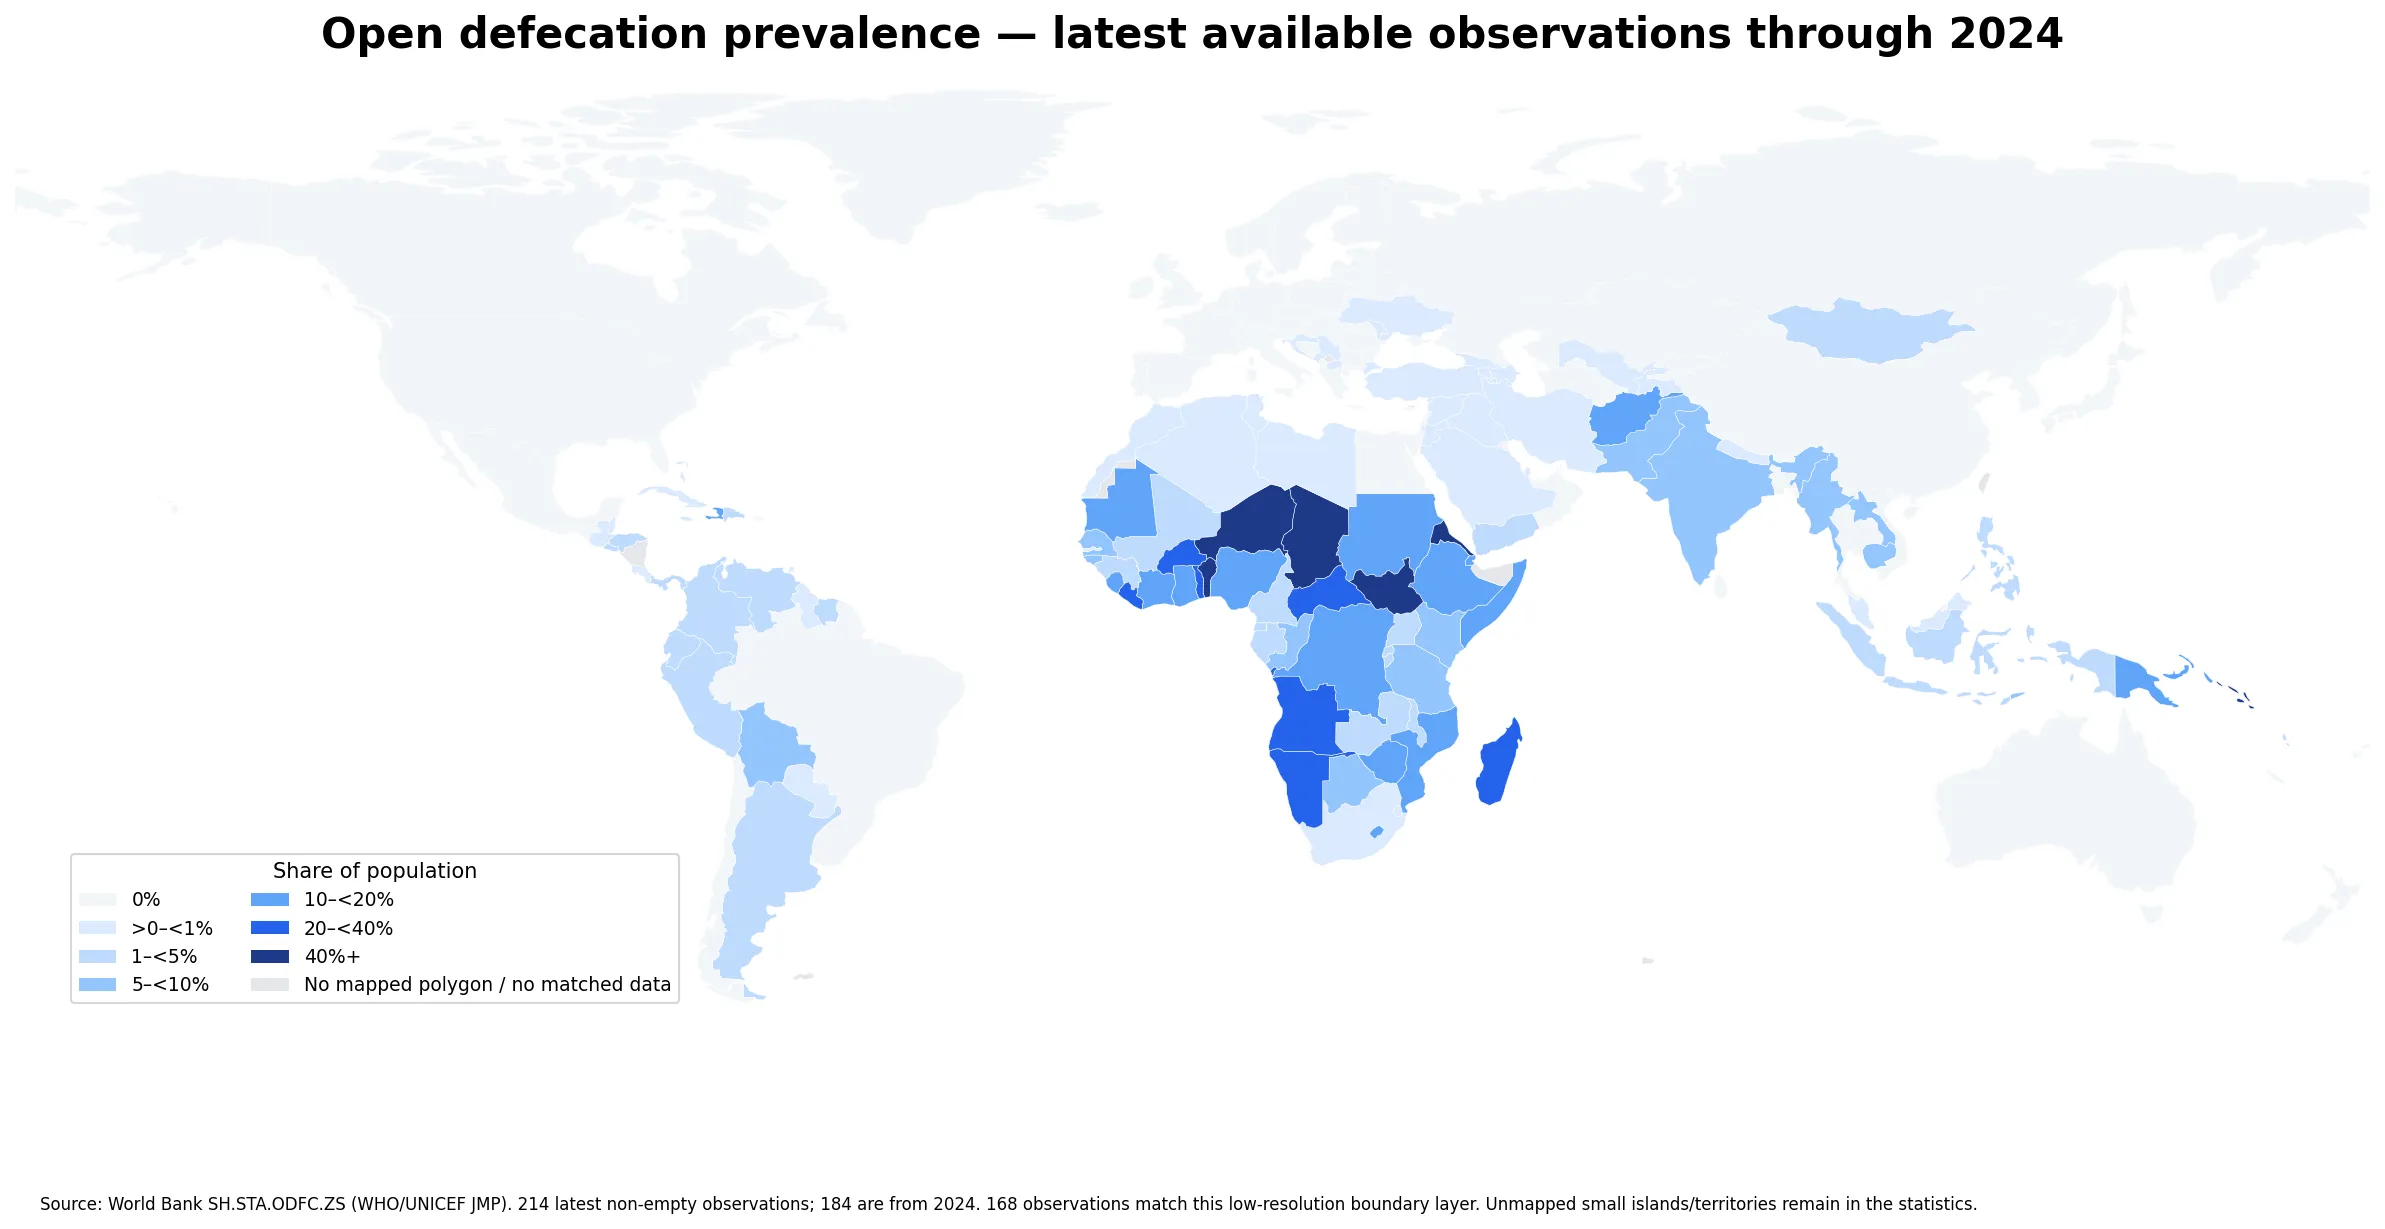
Table of Contents
What this indicator actually measures
The denominator is total population. The numerator is the population estimated to practice open defecation under the definition used by the WHO/UNICEF Joint Monitoring Programme for Water Supply, Sanitation and Hygiene (JMP), which the World Bank cites as the source. A value of 20% means that about one fifth of the population is estimated to fall into the open-defecation category for that observation year. It is not a direct count of households with a particular toilet type, sewer connection, or septic system.
The series should also be read as an internationally harmonized estimate rather than a single identical survey question administered everywhere at the same time. JMP compiles national surveys, censuses and other sources to produce comparable WASH service estimates. That improves cross-country consistency, but it also means that small differences should not automatically be treated as exact head counts or as proof of a particular local cause.
The 214 observations do not all refer to the same year
The year distribution is concentrated in 2024 but not uniform: 184 observations are from 2024, four from 2023, four from 2022, three from 2021, one from 2019, two from 2018, six from 2017, six from 2016, one from 2015 and three from 2014. Each row preserves the most recent non-missing value available for that country or area.
This matters when reading a ranking. Eritrea has the highest value in the full latest-observation table at 67.00%, but that observation is from 2016. Niger at 65.98%, South Sudan at 62.80%, and Chad at 62.22% are all 2024 observations. Treating Eritrea and the 2024 countries as if they were measured at the same moment would hide an important timing difference, so the year should stay attached to any value that is discussed.
Most latest observations are below 1%, but the upper tail is long
The distribution is highly concentrated near zero. There are 86 observations at exactly 0%, another 49 above 0% but below 1%, 31 from 1% to under 5%, and 17 from 5% to under 10%. Sixteen observations are between 10% and 20%, nine between 20% and 40%, and only six are at or above 40%. In total, 135 of 214 observations, or about 63.1%, are below 1%.
| Latest-observation band | Countries/areas | Share of 214 |
|---|---|---|
| 0% | 86 | 40.2% |
| >0 to <1% | 49 | 22.9% |
| 1 to <5% | 31 | 14.5% |
| 5 to <10% | 17 | 7.9% |
| 10 to <20% | 16 | 7.5% |
| 20 to <40% | 9 | 4.2% |
| 40%+ | 6 | 2.8% |
This shape explains why the 5.06% mean is far above the 0.13% median. A majority of observations sit at or close to zero, while a small group in the 30% to 60% range pulls the arithmetic mean upward. The mean in this article is not the official global population prevalence: it weights every country or area equally. A true population-weighted global rate requires population denominators aligned to the same reference periods.
Where the highest latest observations appear
Eritrea has the highest latest value in the table at 67.00%, but its year is 2016. Among 2024 observations, the highest values are Niger at 65.98%, South Sudan at 62.80%, Chad at 62.22%, Benin at 47.04%, and Solomon Islands at 45.34%. Namibia is 34.68%, Liberia 33.92%, Sao Tome and Principe 33.35%, Kiribati 32.36%, and Togo 32.19%.
| Country/area | Observation year | People practicing open defecation |
|---|---|---|
| Eritrea | 2016 | 67.00% |
| Niger | 2024 | 65.98% |
| South Sudan | 2024 | 62.80% |
| Chad | 2024 | 62.22% |
| Benin | 2024 | 47.04% |
| Solomon Islands | 2024 | 45.34% |
| Namibia | 2024 | 34.68% |
| Liberia | 2024 | 33.92% |
| Sao Tome and Principe | 2024 | 33.35% |
| Kiribati | 2024 | 32.36% |
Many of the highest values are in the Sahel and other parts of Sub-Saharan Africa, but high observations are not confined to one continent. Solomon Islands and Kiribati are notable Pacific examples. Country differences within the same continent can also be very large: South Africa is 0.28% in 2024, Kenya 5.91%, Tanzania 6.76%, Nigeria 17.96%, and Niger 65.98%. A continent label is therefore too broad to substitute for country-level data.
Selected large countries show very different prevalence
Among 2024 observations, India is 6.73%, Pakistan 8.17%, and Indonesia 2.29%. Nigeria is 17.96%, Ethiopia 16.23%, the Democratic Republic of the Congo 11.66%, and Ghana 17.79%. China, Brazil, Mexico, the United States and Bangladesh are reported at 0% in this latest table. These comparisons describe the reported share of total population; they do not rank sanitation systems as a whole.
An exact 0.0% value is different from missing data. The source table contains a numeric zero for those observations, and the zeros are retained in the calculations. However, 0.0% should not be expanded into the claim that literally no individual in the country practices open defecation. International estimates are based on surveys and modeling and can be reported with finite precision. Very small prevalence can therefore appear as zero in the published series even while local or vulnerable populations still require more detailed investigation.
A percentage and the number of people affected answer different questions
This indicator is a percentage of total population. The same 5% prevalence can correspond to very different numbers of people in a country with tens of millions of residents and in a small island economy. Estimating the absolute number of people affected requires population data aligned to the observation year and, ideally, the methodology used by the official global estimates. The 214-row table alone does not provide that second denominator.
National prevalence also hides subnational inequality. Urban and rural conditions, income groups, informal settlements, regions and infrastructure networks can differ sharply within a country. The indicator shows where national-level prevalence is high or low, but it cannot by itself identify why people lack sanitation facilities or which intervention would be most effective. Questions about infrastructure, affordability, settlement patterns, conflict, disasters or service reliability require separate evidence.
Low open defecation does not mean every person has safely managed sanitation
Open defecation is one position on the JMP sanitation service ladder, not a complete score for the sanitation system. People who do not practice open defecation may still use unimproved facilities or improved facilities shared with other households. Those situations are different from having at least basic sanitation.
The “at least basic sanitation” indicator measures the population using an improved sanitation facility that is not shared with other households. “Safely managed sanitation” adds requirements for excreta to be safely disposed of in situ or removed and treated offsite. Looking at these indicators together can distinguish elimination of open defecation from progress toward higher service levels. A country can have a very low open-defecation rate while still facing gaps in basic or safely managed sanitation coverage.
Grey or blank places on the map are not automatically 0%
The statistical table contains numeric observations for all 214 rows, but the low-resolution Natural Earth boundary layer used for the map can represent only 168 of them as filled polygons. Aruba, Guam, Hong Kong, Macao, Singapore and many small Caribbean and Pacific islands or territories may not have a separate polygon at this scale or may use a different geographic coding scheme. Their values remain in the statistics even when they are not visibly colored on the map.
Kiribati is a useful example. Its 2024 value is 32.36%, one of the higher observations, yet it is not represented as an independent filled polygon in this low-resolution boundary layer. A blank spot therefore must not be interpreted as zero prevalence or missing source data. The map is best for broad spatial patterns, while tables and the underlying country rows are better for very small islands and territories.
Data source and calculation method
The country and area values come from the World Bank World Development Indicators series SH.STA.ODFC.ZS. World Bank metadata identifies the WHO/UNICEF Joint Monitoring Programme for Water Supply, Sanitation and Hygiene as the underlying source. The unit is percent of total population.
The median, unweighted mean, distribution bands and ranking tables were calculated directly from the 214 latest non-missing observations. No missing value was converted to zero, and numeric 0.0 observations were preserved as reported. Because the observation years are mixed, the text keeps year information with values when timing matters. The map joins ISO-3 country codes to a low-resolution Natural Earth boundary layer and fills 168 matched polygons; unmatched small islands and territories stay in the statistical summaries.
Frequently Asked Questions
Are all 214 observations from 2024?
No. Of the 214 latest non-missing observations, 184 are from 2024 and 30 use the latest available value from 2014 through 2023. The full comparison is therefore latest available data through 2024.
Does a reported 0% mean the data are missing?
No. A 0% row is a numeric observation in the source table. It is different from missing data, although a published 0.0% estimate should not be expanded into a literal claim that no individual is affected.
Is the 5.06% mean the global population prevalence?
No. It is a simple unweighted mean across 214 country and area observations. A population-weighted global prevalence is a different statistic and requires aligned population denominators.
Does low open defecation mean safely managed sanitation is universal?
No. People who do not practice open defecation may still use unimproved or shared facilities. At least basic and safely managed sanitation are higher service levels measured by separate indicators.
Related Articles
Green Map creates custom-edited map images using open geographic data sources such as geoBoundaries, Natural Earth, OpenStreetMap, and government open data.
These maps are edited visual materials, not raw data files, and are provided for education, documents, presentations, and graphic reference.