How much of public education-institution spending is used for costs that recur within the year, rather than for capital outlays that create longer-lived assets? The World Bank indicator SE.XPD.CTOT.ZS answers that narrower question. It measures current education expenditure as a percentage of total expenditure in public institutions. Current expenditure is consumed within the current year and generally has to be renewed if the same service is needed again. It includes staff compensation and other recurring costs such as teaching materials, ancillary services, and administration. The indicator therefore describes the composition of institutional spending; it does not measure how much an economy spends on education overall or how effective that spending is.
The verified dataset contains the most recent non-empty observation for 175 economies. Although 2024 is the headline source year, only 17 observations are actually from 2024. The observation years span 1999 to 2024, with 92 observations from 2021–2024 and 83 from 2020 or earlier. Calling this a “2024 ranking of 175 countries” would therefore be misleading. The article treats the values as latest available through 2024 and keeps the observation year visible whenever individual economies are compared.
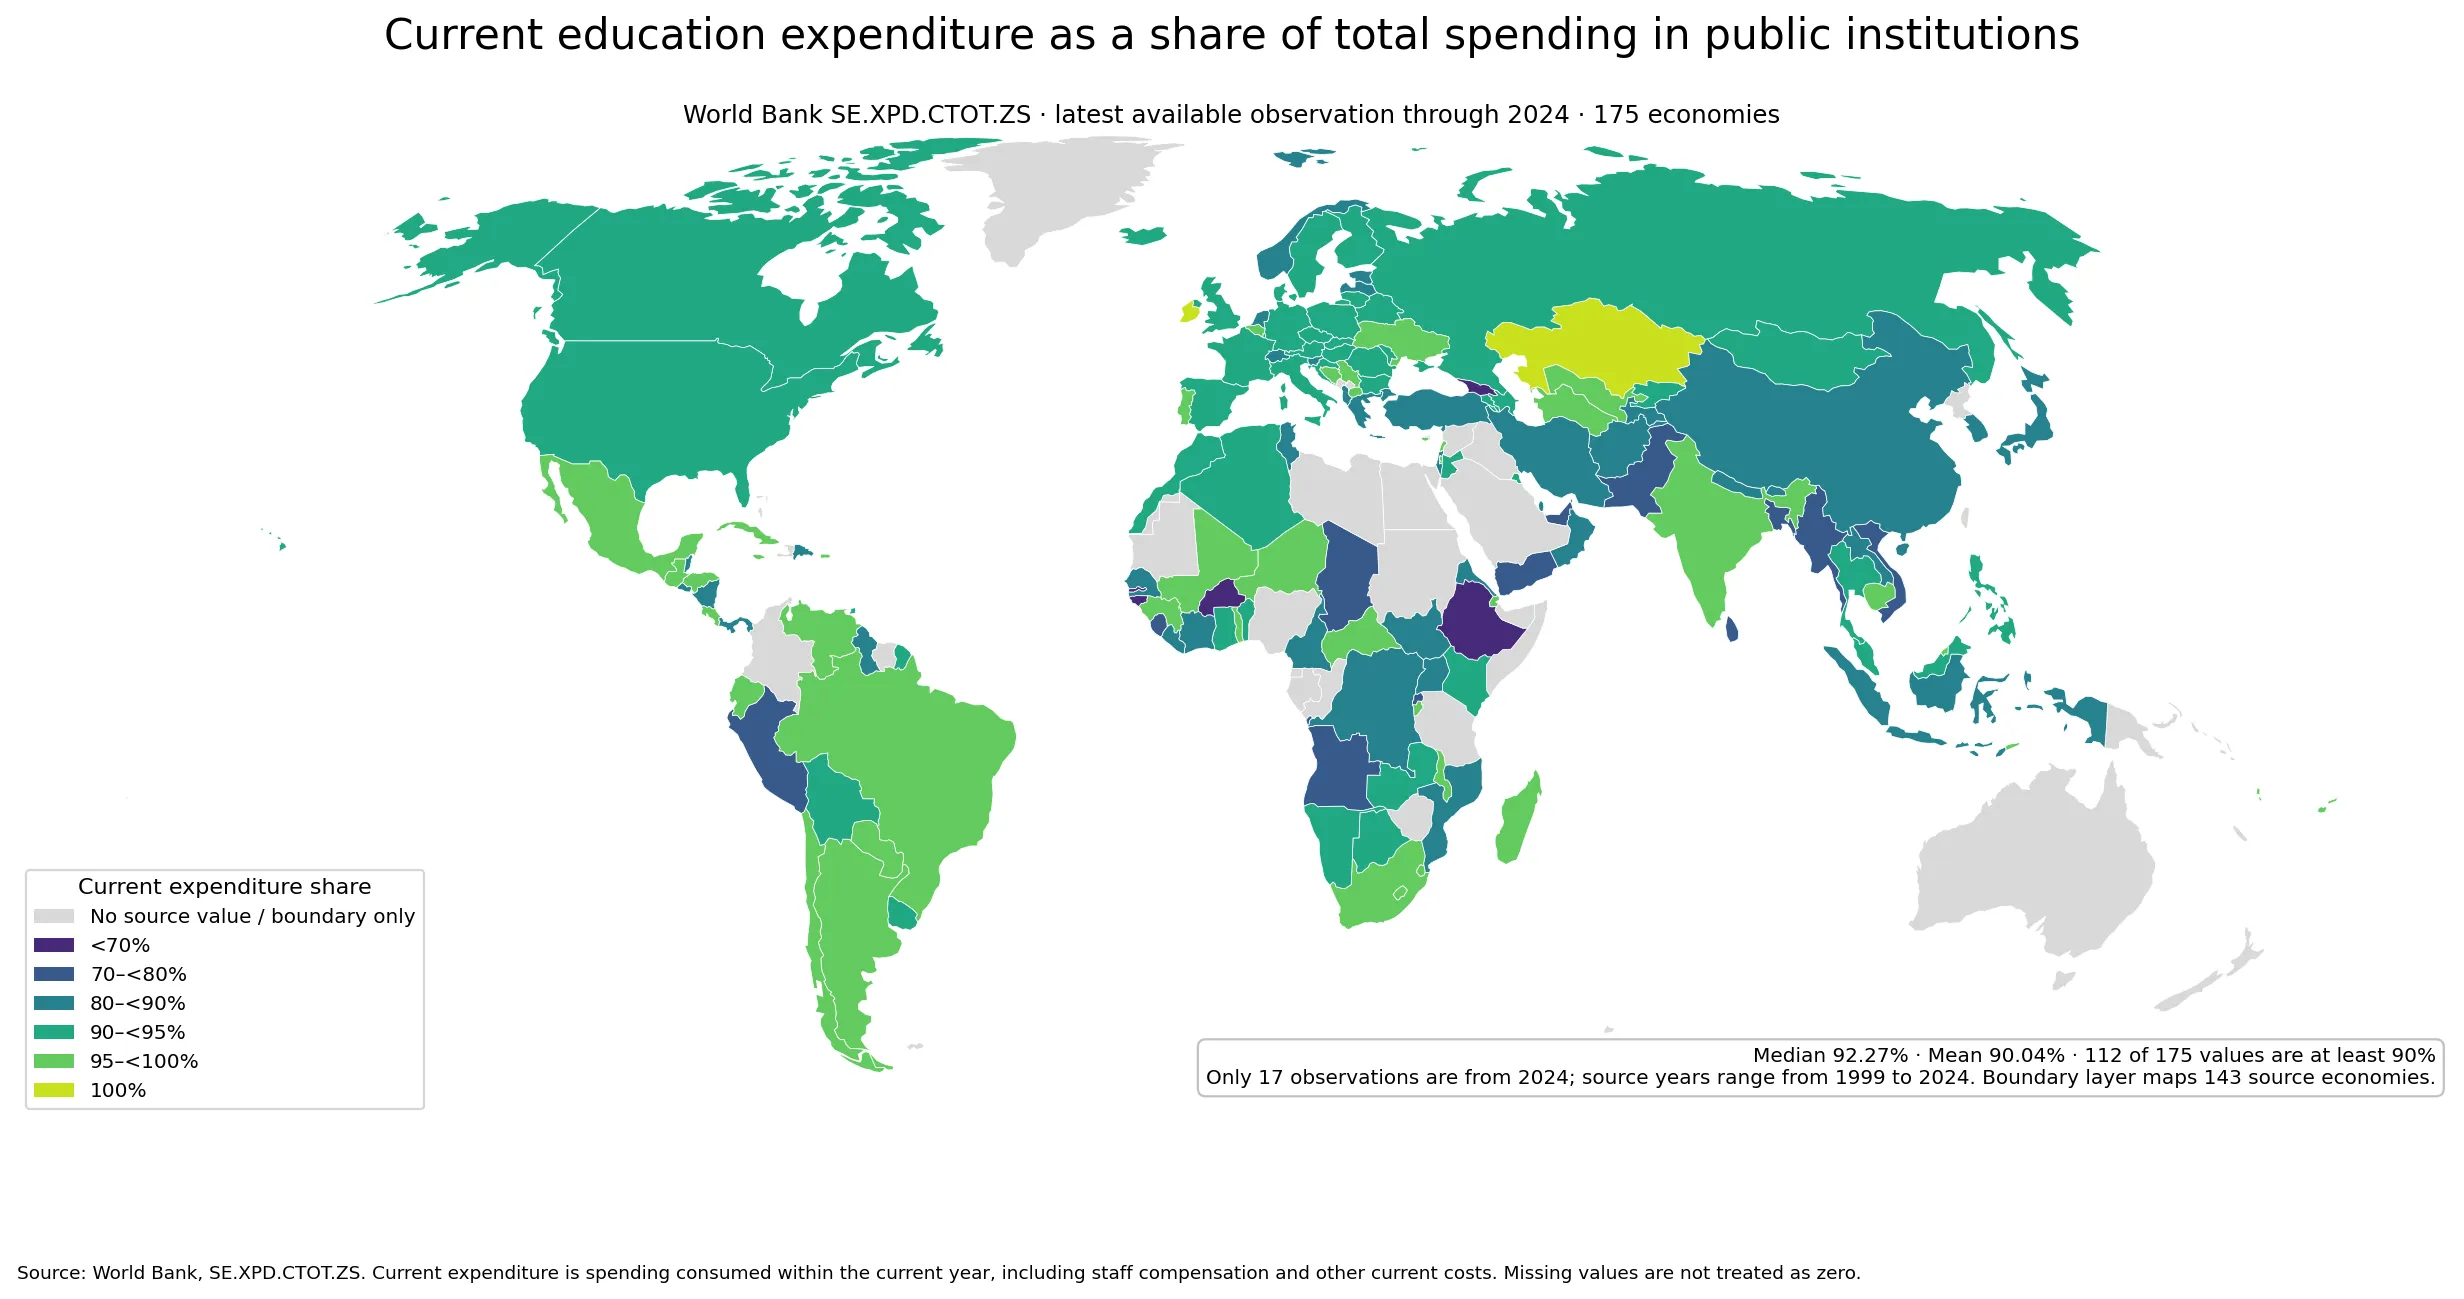
Table of Contents
What the indicator actually measures
The numerator is current expenditure in public education institutions and the denominator is total expenditure in those same public institutions. A value of 95% means that about 95% of the reported institutional spending in that observation year was classified as current expenditure. The remaining share is associated with non-current spending, including capital expenditure. This is different from saying that 95% of the government education budget was spent on salaries. Staff compensation is an important component of current expenditure, but current expenditure also contains other recurring costs, and the denominator is institutional expenditure rather than every item in a government education budget.
That distinction matters for interpretation. A high current-spending share can be entirely consistent with an education system that has large recurring payroll and operating needs. A lower share may coincide with a year in which buildings, renovations, equipment, or other capital items are relatively large, but this indicator alone does not identify the cause. It also cannot tell whether spending is efficient, whether teachers are adequately paid, whether facilities are sufficient, or whether students are learning more. It is a financing-composition measure, not a performance score.
Most observations are concentrated above 90%
The distribution is heavily concentrated at high percentages. The median across 175 observations is 92.27% and the arithmetic mean is 90.04%. 112 economies have a latest available value of at least 90%, and 61 are at or above 95%. Exactly 8 observations are 100%. By contrast, only 20 are below 80% and just 7 are below 70%. The broad picture is therefore one in which recurring expenditure accounts for most reported spending in public education institutions in many economies.
The clustering near the top of the scale also means tiny ranking differences should not be overemphasized. A value of 98.8% and one of 99.3% may be statistically visible but does not by itself establish a meaningful difference in policy, service quality, or efficiency. Accounting classifications, reporting practices, timing of capital projects, and the age of the observation can all matter. For this reason the map uses broad percentage bands rather than a continuous color scale that might visually exaggerate small decimal differences.
The low end of the distribution is more distinctive
Georgia has the lowest latest available observation at 38.20% in 2023. Guinea-Bissau follows at 49.23% in 2013, Monaco at 53.46% in 2024, and The Gambia at 57.84% in 2012. Ethiopia is at 61.70% in 2014, Burkina Faso at 64.67% in 2007, and St. Kitts and Nevis at 65.17% in 2021. These values are far below the dataset median, but they do not represent a common year. Some are recent and others are more than a decade old, so they should not be read as a synchronized league table.
| Economy | Observation year | Current expenditure share |
|---|---|---|
| Georgia | 2023 | 38.20% |
| Guinea-Bissau | 2013 | 49.23% |
| Monaco | 2024 | 53.46% |
| Gambia, The | 2012 | 57.84% |
| Ethiopia | 2014 | 61.70% |
| Burkina Faso | 2007 | 64.67% |
| St. Kitts and Nevis | 2021 | 65.17% |
| Bangladesh | 2019 | 71.04% |
| Yemen, Rep. | 2008 | 74.25% |
| Myanmar | 2019 | 74.56% |
| Sri Lanka | 2018 | 74.66% |
| Pakistan | 2013 | 75.44% |
| Sierra Leone | 2022 | 75.55% |
| Angola | 2006 | 75.65% |
| Cayman Islands | 2023 | 75.83% |
Mathematically, a lower current-expenditure share means that non-current expenditure represents a larger share of total institutional spending in that observation. It is tempting to label that remainder as school construction or infrastructure investment, but the single indicator does not provide enough detail to make that causal claim. A proper explanation would require the underlying capital-expenditure components, comparable accounting definitions, and preferably a time series showing whether the value is a one-year spike or a persistent pattern. The table therefore reports the measured composition without inventing a reason for it.
A 2024-only subset removes the year mismatch
For a cleaner same-year comparison, the 17 economies with 2024 observations can be examined separately. Jamaica has the highest value in this subset at 99.52%, followed by Kiribati at 99.04%, South Africa at 97.13%, Ecuador at 96.88%, Paraguay at 96.49%, and Guatemala at 96.31%. At the other end, Monaco is at 53.46%, Peru at 78.46%, and Rwanda at 79.00%. The range is wide even when the year is held constant, showing that public-institution spending composition can differ substantially across reporting economies.
| Economy | 2024 current expenditure share |
|---|---|
| Jamaica | 99.52% |
| Kiribati | 99.04% |
| South Africa | 97.13% |
| Ecuador | 96.88% |
| Paraguay | 96.49% |
| Guatemala | 96.31% |
| Bolivia | 94.25% |
| Belarus | 93.39% |
| Algeria | 91.03% |
| Jordan | 90.49% |
| South Sudan | 89.28% |
| El Salvador | 88.01% |
| Oman | 85.87% |
| Cote d’Ivoire | 84.43% |
| Rwanda | 79.00% |
| Peru | 78.46% |
| Monaco | 53.46% |
This subset improves temporal comparability but reduces coverage. Seventeen economies cannot be assumed to represent the world as a whole, and the set of economies that reported a 2024 value may differ systematically from those whose latest available observations are older. The full latest-value map maximizes geographic coverage but mixes years; the 2024 table aligns the year but covers far fewer economies. Those are different analytical tradeoffs, so the two views should complement rather than replace each other.
How to interpret observations at 100%
Aruba, Curaçao, Tuvalu, the British Virgin Islands, the Marshall Islands, Kazakhstan, Ireland, and St. Vincent and the Grenadines each have a latest available observation of exactly 100%. At face value, that means all reported expenditure in public institutions for the relevant observation was classified as current expenditure. Their observation years, however, range from 2010 to 2023. A 100% value should therefore be treated as a reported annual composition value, not as proof that capital expenditure is structurally absent from the education system in every year. Reporting conventions, rounding, and the timing of investment can matter.
The same caution applies to values just below 100%. The dataset contains many observations in the 95–100% range, so fine-grained rankings among them are less useful than understanding the larger composition bands. A country at 99.8% is not necessarily “better” or “worse” than one at 97%. Both indicate that current costs dominate the reported expenditure mix. Any evaluation of whether that mix is appropriate requires other evidence about infrastructure needs, teacher staffing, enrollment, learning outcomes, and the broader financing environment.
Observation-year differences are the main limitation
The latest-value extraction includes 17 observations from 2024, 23 from 2023, 38 from 2022, and 14 from 2021. Many others are older, and the earliest observation in the file is from 1999. Older data are not automatically invalid, but they should not be assumed to describe the current financing structure. Capital-investment cycles, teacher compensation reforms, decentralization, accounting practices, and institutional arrangements can change over time. A ten-year-old value and a 2024 value therefore carry different information about the present.
A latest-available map is best used to answer a coverage question: what is the most recent reported composition value available for each economy? It is less suitable for a strict cross-sectional policy comparison. If the analytical goal is to compare economies at one moment, a common-year panel should be used even if that reduces the number of economies. If the goal is to study change, annual time series are better because they show whether the current-spending share is stable or moves sharply when capital projects are undertaken. Keeping the year beside each value prevents the convenience of a map from hiding this limitation.
What the world map shows—and what it omits
The source table contains 175 economies, while the low-resolution Natural Earth boundary layer used for the visual has matching polygons for 143. The unmatched source codes are mostly microstates, islands, or territories such as Andorra, Monaco, Singapore, Bahrain, and several Caribbean and Pacific economies. Those places remain in the statistics and tables; they are simply not assigned a polygon in this particular map. Treating an absent polygon as 0% would create a false data point, so the map leaves boundary-only or unmatched areas separate from reported values.
This cartographic limitation is especially relevant because several 100% or near-100% observations belong to small island economies that are difficult to display on a low-resolution world map. The visual is useful for seeing broad patterns among larger economies, but it should be read together with the numeric tables. Maps compress geography well; they are less reliable for microstates and for variables whose observation years differ. The statistics therefore remain the authoritative basis for the article, with the map serving as a geographic summary.
What this percentage cannot tell you
The current-expenditure share does not indicate the overall size of education spending. Two economies can both report 95% while spending very different amounts per student, very different shares of GDP, or very different shares of total government expenditure on education. The indicator also does not directly measure teacher numbers, class size, enrollment, attainment, school quality, equity, or learning outcomes. It says how institutional expenditure is divided between current and non-current categories, not whether the total amount is sufficient or well targeted.
For a fuller financing picture, this measure can be paired with education expenditure as a share of GDP, government expenditure on education, spending per student, staff-compensation shares, and explicit capital-expenditure data. Outcome indicators such as enrollment, completion, attainment, and learning results answer different questions again. Using several measures prevents a common mistake: interpreting a high recurring-cost share as evidence of strong education performance or interpreting a lower share as evidence of waste. The percentage is most informative when its narrow definition is kept intact.
Frequently Asked Questions
What is included in current education expenditure?
It covers costs consumed within the current year, including staff compensation and other recurring spending such as teaching materials, ancillary services, and administration. Capital expenditure is a separate category.
Are all 175 observations from 2024?
No. Only 17 observations are from 2024. The latest available observation years range from 1999 to 2024, so the dataset should be read as latest available through 2024.
Does a higher current-expenditure share mean better education financing?
No. The indicator describes the composition of public-institution spending. It does not directly measure efficiency, education quality, learning outcomes, or whether total spending is adequate.
What does a value of 100% mean?
It means all reported expenditure in public institutions for that observation was classified as current expenditure. It should not be generalized to every year or interpreted as proof that capital spending is always absent.
Related Articles
Green Map creates custom-edited map images using open geographic data sources such as geoBoundaries, Natural Earth, OpenStreetMap, and government open data.
These maps are edited visual materials, not raw data files, and are provided for education, documents, presentations, and graphic reference.