Taxes tied to cross-border trade account for very different shares of government revenue across countries. Restricting the World Bank series to observations actually reported for 2024 leaves 68 countries. Namibia records the highest value in that same-year group at 32.72% of revenue, followed by The Bahamas at 23.63% and the Philippines at 20.76%.
The measure should not be read as a tariff rate. It asks how much of total government revenue is represented by taxes on international trade. The World Bank definition covers taxes that become payable when goods cross national or customs frontiers and taxes connected with certain service transactions between residents and non-residents. A country can therefore have a low value even if trade is economically important, because the denominator includes the rest of government revenue.
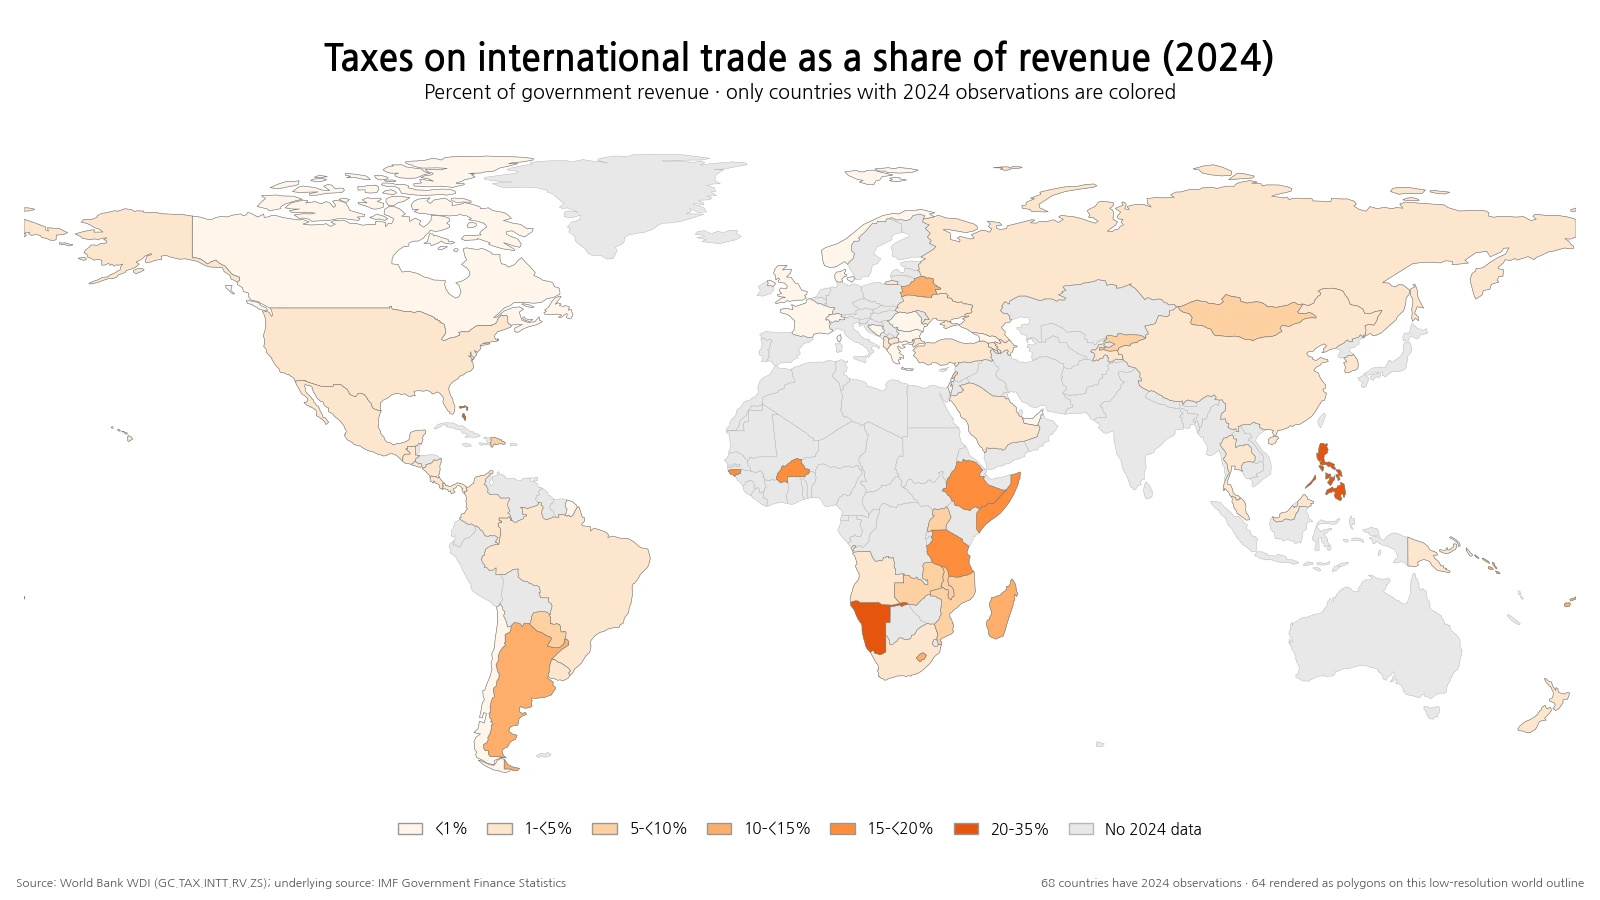
The broader World Bank series contains recent values for more economies, but the observation years are not uniform. To keep the main comparison time-consistent, the map colors only 2024 records. Andorra, Mauritius, Nauru and San Marino also have 2024 values, but the low-resolution world outline used for this overview does not render them as filled country polygons; they remain included in the tables and summary statistics.
Table of Contents
Countries with the highest 2024 shares
The upper end of the 2024 distribution is concentrated in a relatively small group. Namibia stands above 30%. The Bahamas and the Philippines exceed 20%, while Somalia and Ethiopia are both close to 18.5%. Tanzania, Burkina Faso and Guinea-Bissau are in the 16% range, and Argentina and Madagascar are around 15%.
| Country | Share of revenue |
|---|---|
| Namibia | 32.72% |
| Bahamas, The | 23.63% |
| Philippines | 20.76% |
| Somalia, Fed. Rep. | 18.50% |
| Ethiopia | 18.50% |
| Tanzania | 16.92% |
| Burkina Faso | 16.64% |
| Guinea-Bissau | 16.01% |
| Argentina | 14.99% |
| Madagascar | 14.57% |
These rankings are not rankings of trade intensity or import dependence. The numerator is a category of government revenue linked to international trade, and the denominator is total revenue. A country with large receipts from other taxes or non-tax revenue can show a low share even when it collects substantial customs-related revenue in absolute terms.
At the low end, many values are close to zero
Fifteen of the 68 countries with 2024 observations are below 1%. Bosnia and Herzegovina, Romania, France, Greece and the United Arab Emirates are all extremely close to zero in this series for 2024. Denmark and Norway are also well below 1%. That does not mean those economies have no international trade or no border taxes; it means the recorded international-trade-tax category makes up a very small part of total government revenue.
| Country | Share of revenue |
|---|---|
| Bosnia and Herzegovina | 0.000% |
| Romania | 0.000% |
| France | 0.003% |
| Greece | 0.007% |
| United Arab Emirates | 0.013% |
| Bulgaria | 0.033% |
| Denmark | 0.043% |
| Norway | 0.151% |
| Israel | 0.264% |
| San Marino | 0.298% |
How wide is the 2024 distribution?
The median across the 68 available 2024 observations is 3.60%. The first quartile is 1.19% and the third quartile is 8.53%. There are 15 countries at or above 10%, while 15 are below 1%. The distance between the median and the 32.72% maximum shows why a few very high values should not be treated as representative of the typical country in the dataset.
The map also makes a second point visible: missing 2024 observations are common. A gray country is not a zero-value country. Treating missing data as zero would artificially create clusters of low values and would misstate the fiscal structure of countries that simply do not have a 2024 observation in the series.
Regional medians are useful, but coverage is uneven
Among countries with a 2024 observation that can be linked to the world boundary layer, the median is 13.76% for 14 African countries, 8.33% for four countries in Oceania, 3.78% for ten in North America, 2.75% for six in South America, 2.38% for sixteen in Asia, and 0.33% for fourteen in Europe.
| Region | Countries with 2024 data | Median |
|---|---|---|
| Africa | 14 | 13.76% |
| Oceania | 4 | 8.33% |
| North America | 10 | 3.78% |
| South America | 6 | 2.75% |
| Asia | 16 | 2.38% |
| Europe | 14 | 0.33% |
Those regional numbers are descriptive summaries of the available observations, not complete continental estimates. Coverage differs by region, and the small Oceania group is especially sensitive to the values of individual countries. The safest use is to identify broad contrasts that may deserve closer investigation rather than to claim that an entire region has one fixed fiscal model.
What the indicator measures
The World Bank indicator code is GC.TAX.INTT.RV.ZS. Its long definition describes taxes that become payable when goods cross the national or customs frontiers of an economy, as well as taxes on relevant service exchanges between residents and non-residents. The result is expressed as a percentage of revenue.
The World Development Indicators metadata identifies the underlying source as the IMF Government Finance Statistics Yearbook and data files. The indicator is annual, and the World Bank metadata lists a reference period from 1972 through 2024. Government finance data follow international statistical frameworks, but country reporting and availability are not identical, which is one reason the observation year needs to be checked before making cross-country comparisons.
Why this is not the same as a tariff rate
A value of 15% in this series does not mean that imports face a 15% tariff. It means that taxes classified under international trade make up 15% of total government revenue. Tariff indicators use different numerators and denominators, often focusing on rates applied to products or on trade-weighted averages rather than on the composition of government revenue.
It is also different from “Customs and other import duties (% of tax revenue).” That related World Bank series uses tax revenue as the denominator, whereas this article uses the broader revenue denominator. Similar-looking percentages can therefore answer different questions. Before comparing them, check whether the denominator is total revenue, tax revenue, imports, product value, or another base.
What can drive differences between countries?
The indicator by itself does not identify a single cause. Differences can reflect the design and scope of trade-related taxes, the size of other tax bases, non-tax revenue, the structure of trade, economic conditions in the reporting year, and national government-finance reporting. The map is therefore best used as a fiscal-structure comparison rather than as a shortcut for judging trade policy.
A near-zero share does not automatically mean that a country has zero tariffs, and a high share does not prove that average tariffs are high. A policy-focused analysis would need additional measures such as applied tariff rates, import values, customs-duty receipts, tax composition and the institutional coverage of the government finance data.
Observation year matters more than a “latest value” label suggests
Collecting the most recent non-missing observation for every economy produces 159 rows in the supplied World Bank extract, but those observation years range from 1979 to 2024. Only 68 are from 2024; 88 are from 2023 or 2024, and 116 are from 2020 or later. A map that colors all of those “latest” values together would therefore compare fiscal structures from different periods.
For that reason, the headline map and ranking in this article use only the 2024 slice. Older latest observations remain useful for historical research, but they should not be visually presented as if they described the same year.
Source and interpretation notes
The official series is World Bank World Development Indicators: GC.TAX.INTT.RV.ZS. The World Bank metadata credits the IMF Government Finance Statistics Yearbook and data files as the underlying source. The map, tables and summary statistics here use the 2024 observations without replacing missing values with zero.
For cross-country interpretation, always check the year, the denominator, and the government-finance coverage. This indicator is a measure of revenue composition; it is not a direct measure of the overall tax burden, trade openness, customs efficiency, or the average tariff faced by importers.
Frequently Asked Questions
Does a high international-trade-tax share mean tariffs are high?
Not necessarily. This indicator measures the share of total government revenue coming from taxes on international trade. It is not an average tariff rate applied to imported products.
Why are many countries gray on the map?
The main map uses only observations reported for 2024 so that countries are compared for the same year. Gray means no comparable 2024 observation, not a value of zero.
Is this the same as customs duties as a share of tax revenue?
No. The numerator and denominator can differ. This series uses taxes on international trade as a share of total revenue, while customs-duty indicators may use tax revenue or other bases.
Related Articles
Green Map creates custom-edited map images using open geographic data sources such as geoBoundaries, Natural Earth, OpenStreetMap, and government open data.
These maps are edited visual materials, not raw data files, and are provided for education, documents, presentations, and graphic reference.