Bourbon County occupies the eastern side of Kansas, and the supplied maps make Fort Scott the clearest place to begin. The city sits near the eastern side of the county where U.S. 69 runs north and south and U.S. 54 reaches westward across the interior. Bronson and Uniontown provide western references, Mapleton and Fulton mark the north, and Redfield lies between the larger communities. The four map views on this page can be downloaded as high-resolution JPG originals in one ZIP, so the web preview can be used for quick orientation while the larger files are available for closer reading or printing.
The county becomes easier to understand when the roads are compared with the river valleys rather than viewed alone. The Little Osage River traces the northern part of the county, while the Marmaton River crosses the central and eastern interior near Fort Scott. Smaller streams branch through nearly every part of the map. Those valleys also appear on the elevation view, which reports terrain from about 231 to 340 meters with a mean near 281 meters. Higher ridges are much more common toward the west, while lower green corridors follow the major waterways in the east and north.
Settlement is uneven as well. Fort Scott is visibly larger than the other mapped cities, yet the rest of the county is not empty space: Bronson, Uniontown, Mapleton, Fulton, and Redfield form useful location anchors in different directions. Looking at those towns alongside the water and relief maps makes it possible to tell not only where places are, but also whether they sit near a broad river valley, a higher ridge, or one of the many smaller tributary cuts.
Table of Contents
Fort Scott as the Road Reference for the County
The general county map places Fort Scott near the east-central side of Bourbon County. U.S. 69 passes through the city on a north-south line, and U.S. 54 approaches from the west before continuing through the Fort Scott area. Kansas 7 follows part of the same east-west corridor farther west. This makes Fort Scott a practical reference for reading the rest of the road network: Redfield is west of the city, Uniontown lies farther west, and Bronson is close to the western boundary.
North of the main east-west corridor, Mapleton sits near the northern edge and Fulton appears in the northeast. Route shields for 31 and 65 are visible in the northern part of the map, while the southern half includes Kansas 3 and 39. The smaller rural roads create a strong rectangular grid, but the blue stream lines cut across that geometry at many angles. The contrast is useful because it shows why the county is not simply a flat road lattice even though the transportation pattern can look very regular at first glance.
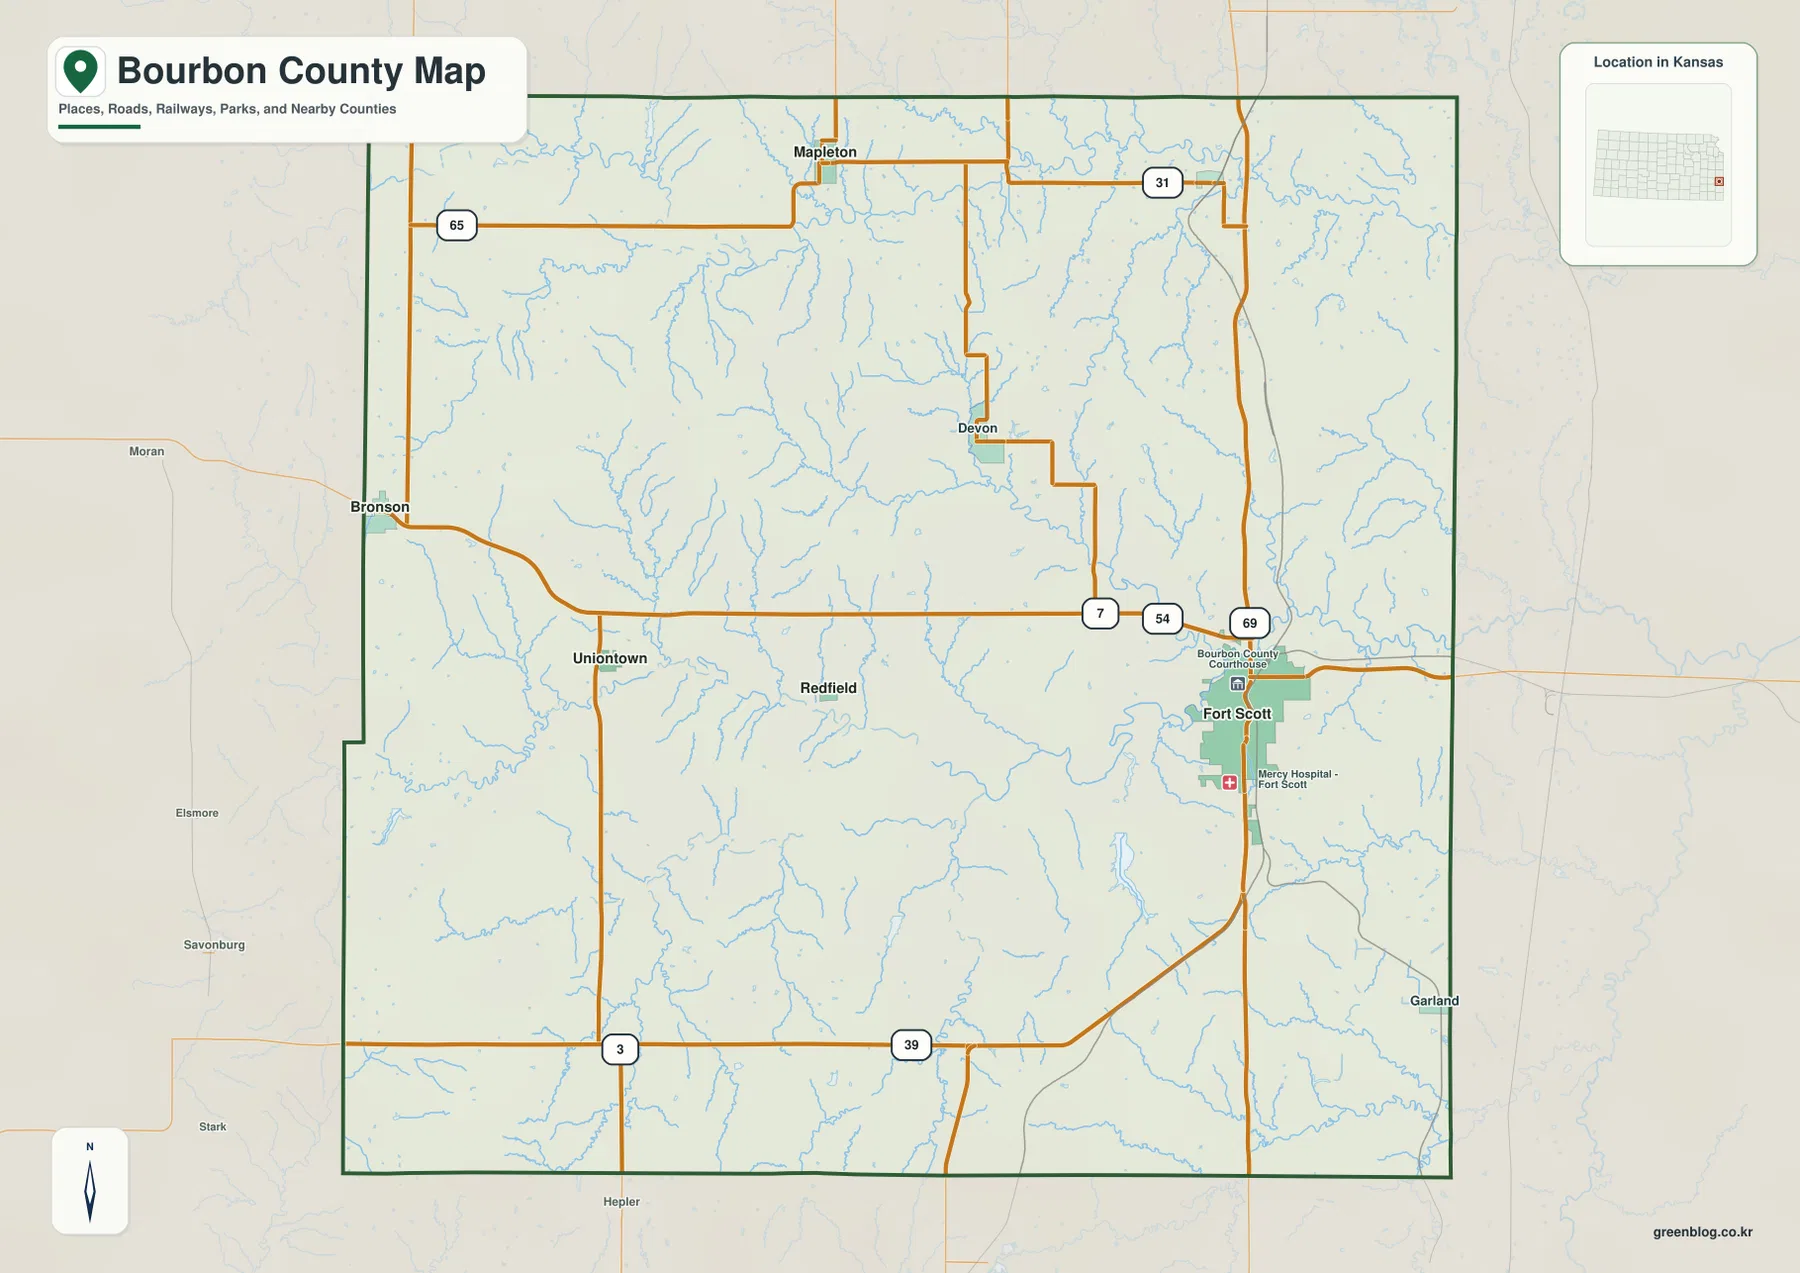
The western boundary has a small offset rather than forming one unbroken vertical line, and numerous creeks descend through the interior toward the larger rivers. Near Fort Scott the map also identifies the county courthouse and a hospital, giving the city a stronger visual presence than the smaller communities. Those civic labels are useful orientation points, but they do not change the map’s main purpose: showing how cities, roads, streams, and the county outline relate to one another.
This general map is best treated as an overview rather than a navigation product. It can show which large roads serve Fort Scott, whether a community is near a county edge, and how the rural grid relates to surrounding drainage. Current construction, closures, travel times, and local road conditions can change, so an actual trip should still be checked against a current transportation source. The map is most valuable as a stable geographic frame for the more specialized city, water, and elevation views below.
Six Mapped Communities with Fort Scott Clearly Dominant
The ranked city map highlights six communities. The index printed on the supplied map lists Fort Scott at 7,555, Bronson at 537, Uniontown at 467, Mapleton at 133, Fulton at 93, and Redfield at 71. Those figures belong to the map and are useful for visual comparison, but they should not be treated as a substitute for the newest official population estimate. What matters geographically is the large size gap between Fort Scott and the other mapped places, combined with the broad spacing of those smaller towns.
Bronson stands near the western county line, while Uniontown lies farther southeast and deeper inside the county. Redfield occupies the interior between the western towns and Fort Scott. Mapleton and Fulton provide northern references, with Fulton shifted farther east. This arrangement makes the city map especially helpful for readers who want to distinguish the west, center, north, and east without the distraction of every local road and stream.
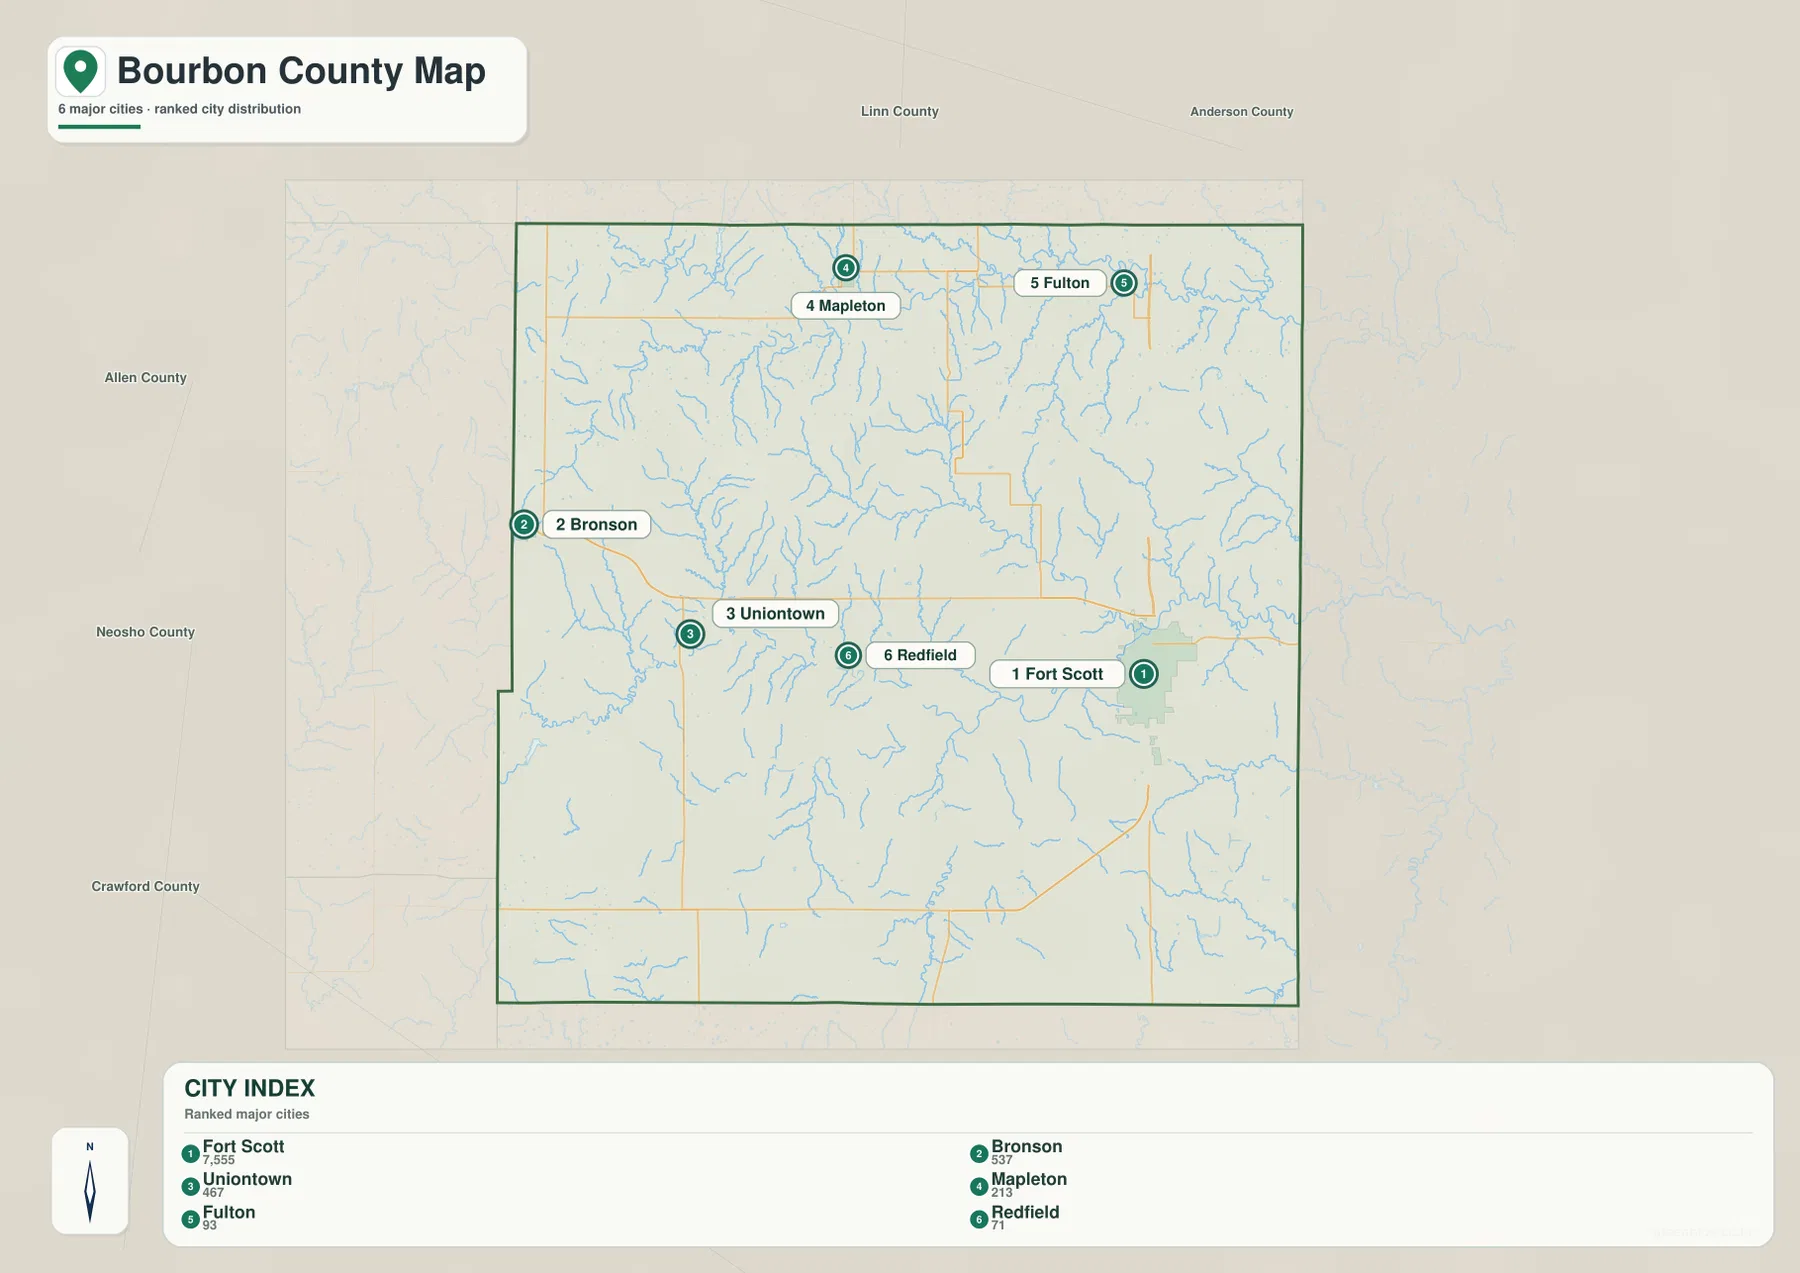
The city view also labels neighboring counties around the outside of Bourbon County. Linn and Anderson counties appear to the north, Allen and Neosho to the west, and Crawford County to the southwest. These labels are not meant for measuring precise boundary distances, but they make the relative position of the smaller towns easier to understand. Bronson is naturally associated with the Allen County side, while Mapleton and Fulton sit closer to the northern county line.
Because the city map intentionally simplifies the transportation network, apparent spacing should not be read as driving mileage. A short gap on the page may still involve a different route choice on the ground. For travel planning, the most useful sequence is to identify the towns on this ranked view and then return to the general map to see the numbered roads and local network. The city view is about settlement pattern first, not turn-by-turn routing.
Little Osage River in the North and Marmaton River through the Interior
The water-and-terrain map divides Bourbon County into several recognizable drainage areas. Across the north, the Little Osage River forms the most prominent line. Limestone Creek approaches it from the northwest, and Elm Creek is labeled farther east. Numerous smaller tributaries feed the same northern system, creating a dense branching pattern that is easy to miss on the simpler city map.
The Marmaton River is the other major feature. It runs through the central and eastern part of the county and bends near the Fort Scott area, with Mill Creek and several smaller channels entering the system. The river’s broad course is especially useful for connecting the human geography of Fort Scott with the physical geography around it. What looks like a straightforward road intersection on the general map sits within a landscape cut by many small valleys.
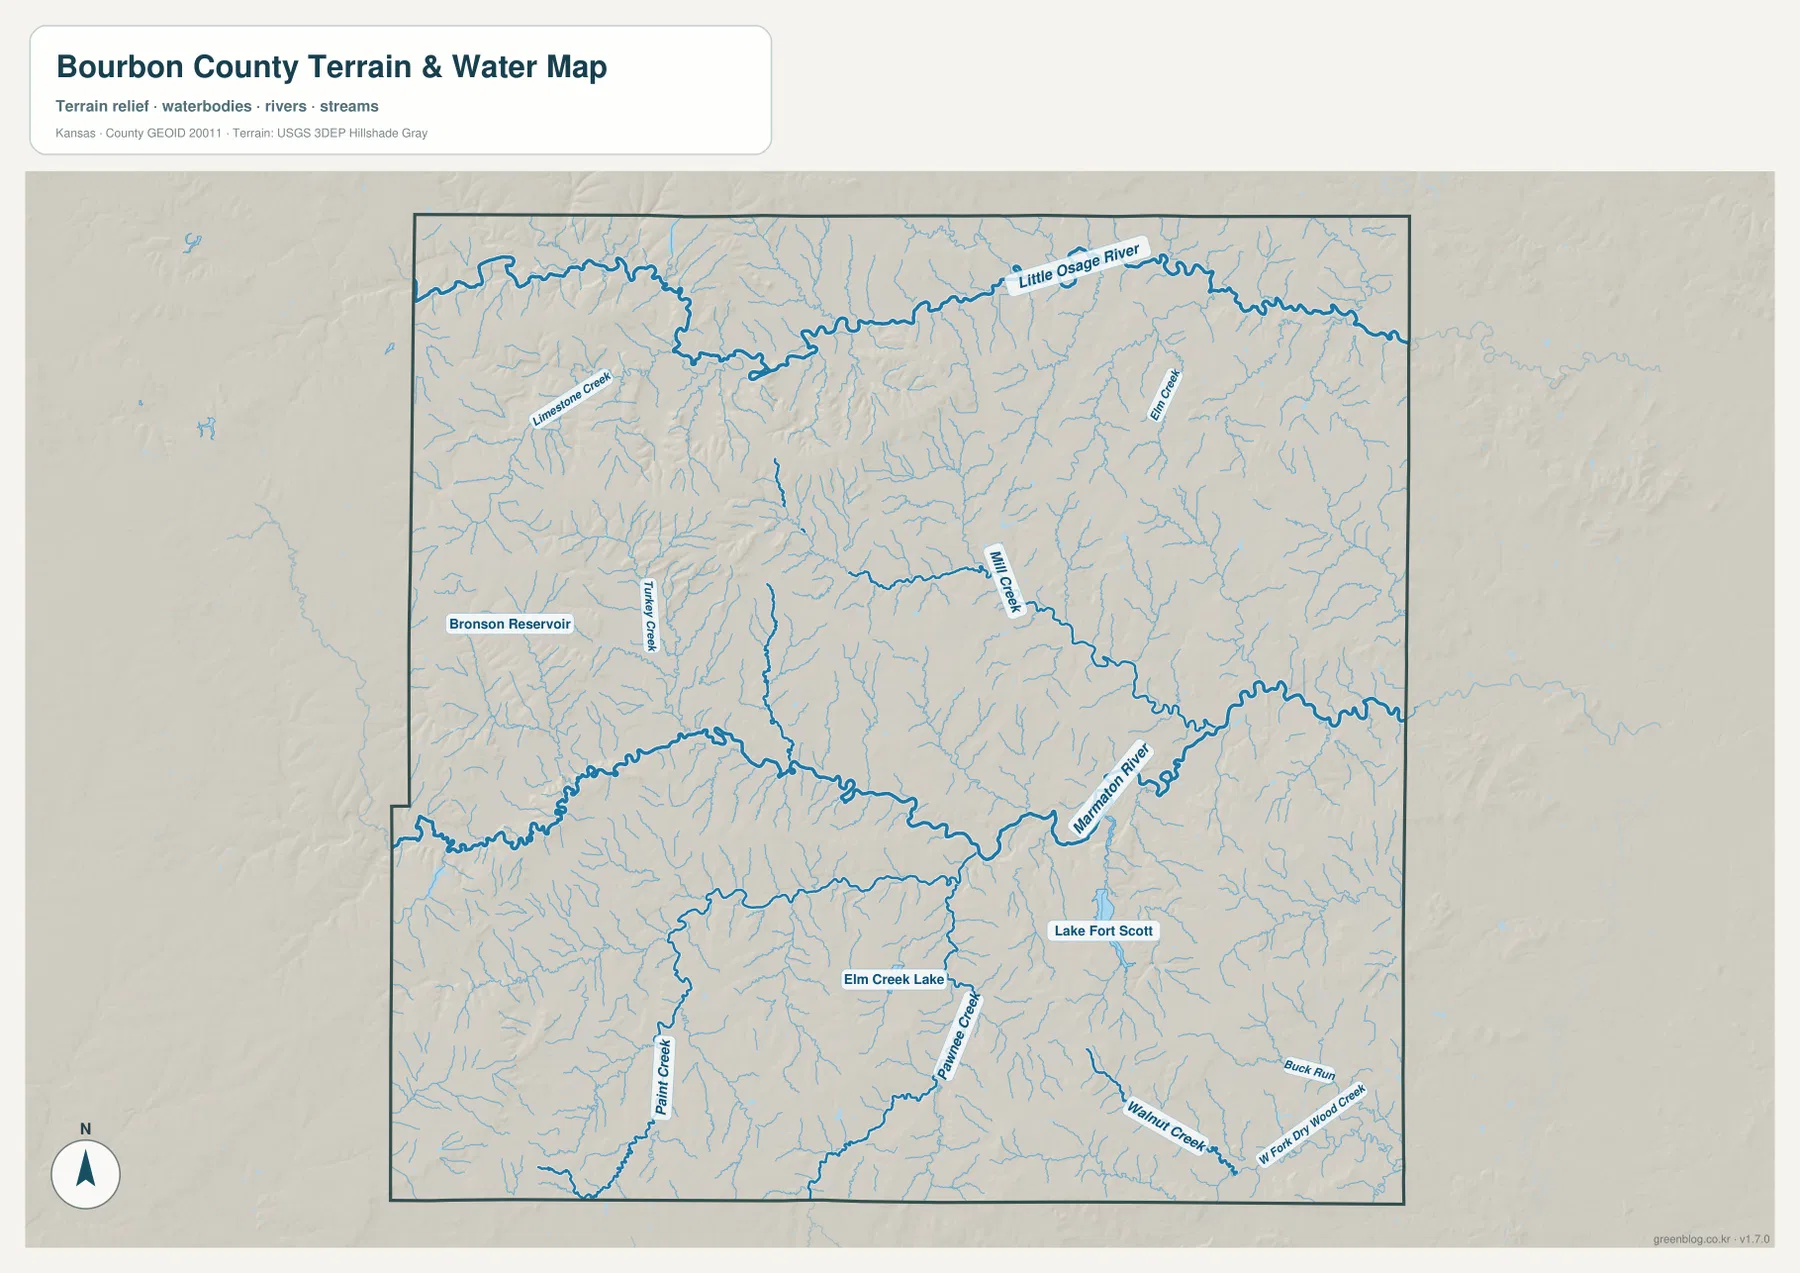
Several named water bodies give additional reference points. Bronson Reservoir appears in the western part of the county south of Bronson. Elm Creek Lake is marked in the south-central interior, and Lake Fort Scott lies farther east. Paint Creek and Prairie Creek run through the southern half, while Walnut Creek, Buck Run, and West Fork Dry Wood Creek appear toward the southeast. These names are useful for orientation, but the map does not establish current water levels, public access, ownership, fishing rules, or water quality.
This map should therefore be read as a county-scale hydrographic reference, not as a live flood map, legal drainage document, parcel product, or navigation chart. River stages and road flooding can change quickly after heavy rain. For geographic study, however, the view clearly explains why the road grid is crossed by so many irregular blue lines and why the terrain surface becomes more deeply cut in some parts of the county than in others.
Relief from about 231 to 340 Meters
The supplied elevation map reports an actual range of roughly 231 to 340 meters and a mean of about 281 meters. The strongest brown and orange colors occupy much of the western side, especially the northwest and southwest. Lower greens become more common toward the east and along the major river corridors. The result is a clear west-to-east contrast, although the pattern is broken by many narrow tributary valleys rather than forming one smooth slope.
Around Bronson and farther north, high ridges are repeatedly cut by stream valleys. The Little Osage corridor produces a lower band across the north, and the Marmaton River creates another conspicuous low route through the central and eastern interior. Near Fort Scott, green relief colors are more extensive than on the western edge. The elevation view therefore provides a physical explanation for the branching waterways seen on the water map.
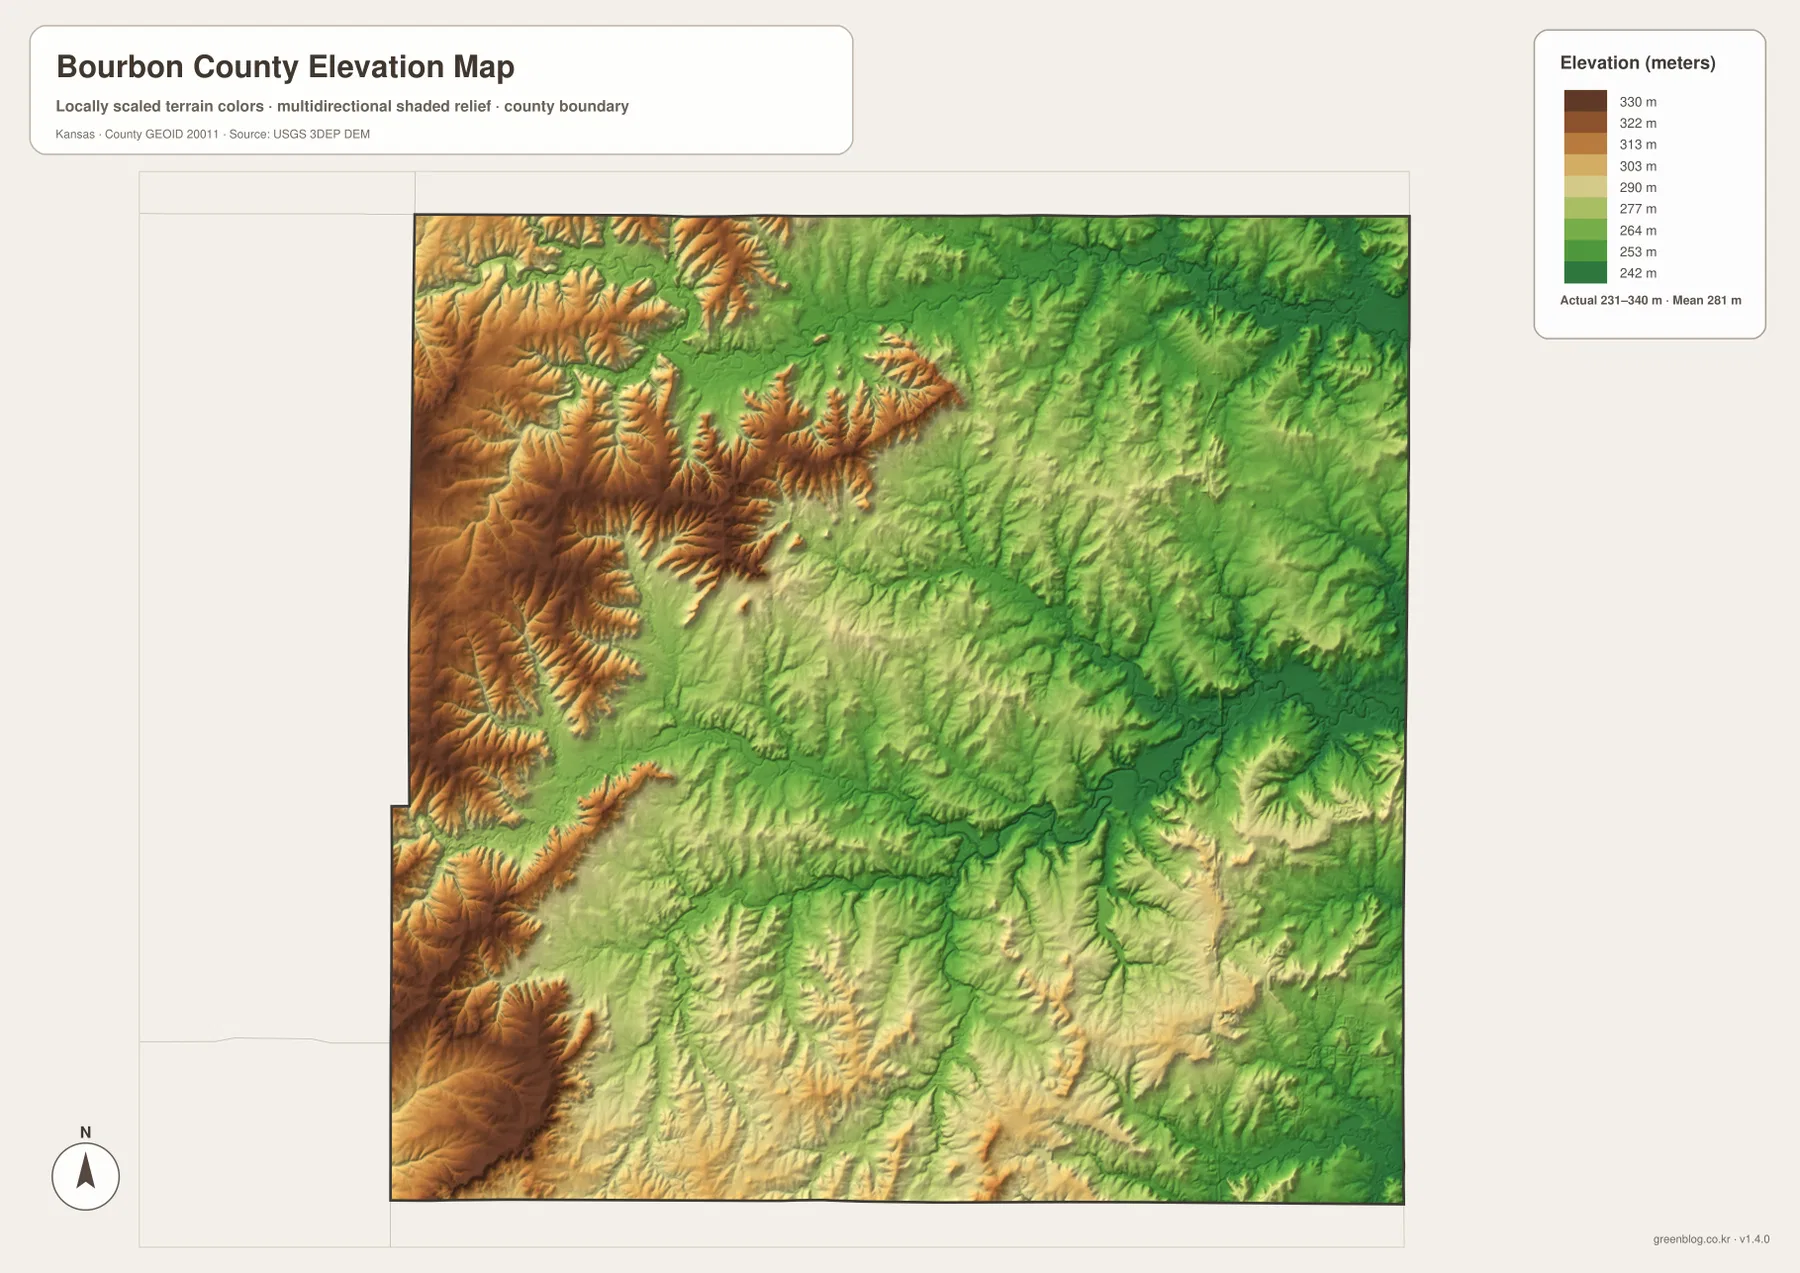
The west is not a single flat high platform. The shaded relief reveals ridges, small hollows, and branching cuts that repeat over short distances. In the northwestern corner, high ground approaches the Little Osage valley through a series of descending ridges. Similar patterns appear south of Bronson and across the southwestern interior. The county’s road grid may look regular, but the terrain beneath it has a much more complex texture.
This elevation layer is a generalized countywide surface rather than a survey. It is appropriate for comparing broad high and low areas, locating major valleys, and understanding why some streams occupy deeply defined corridors. It should not be used to determine a building-pad elevation, parcel slope, drainage design, or engineering grade. Those tasks require more precise source data and professional measurement.
How Fort Scott Links the Human and Physical Maps
Fort Scott works especially well as a cross-map reference because roads, settlement, river valleys, and relief all meet nearby. On the road map, U.S. 69 and U.S. 54 make the city easy to find. On the water map, the Marmaton River and its tributaries define low ground around the same area. The elevation layer then shows that those river corridors are lower than many of the western ridges. Reading the same place across three views turns separate map symbols into a coherent geographic picture.
The western towns create a useful contrast. Uniontown lies inside the county among a dense network of small streams, while Bronson stands much closer to the western edge and higher terrain. Both are far smaller than Fort Scott on the ranked city map, yet their surrounding landscapes differ noticeably on the relief view. This comparison is a reminder that settlement size and terrain are different questions and should not be inferred from one another.
The northern pair of Mapleton and Fulton offers another comparison. Both help orient the Little Osage side of the county, but they occupy different positions along the northern drainage system. Following the river and its tributaries on the water map and then checking the corresponding relief colors reveals repeated transitions between ridge tops and lower stream corridors. The pattern is more informative than describing the northern half as simply high or low.
Choosing the Most Useful Map for a Specific Question
For county boundaries, major roads, and overall orientation, the general map is the strongest starting point. It keeps Fort Scott, Bronson, Uniontown, Redfield, Mapleton, numbered routes, and the county outline together in one frame. When the question is mainly about where the principal settlements lie relative to one another, the ranked city map removes much of the background clutter and makes the spacing much easier to compare.
The water-and-terrain view is the better choice for the Little Osage River, Marmaton River, lakes, reservoirs, and named creeks. It is also the easiest place to see how densely the county is dissected by small drainage channels. The elevation map answers a different question: where the land is broadly higher or lower. Using the water and elevation views together makes the western ridges and the lower northern and eastern valleys much more understandable than either layer by itself.
A classroom or regional report can become more county-specific by choosing several contrasting examples rather than describing every map in the same generic way. Fort Scott can illustrate the relationship between a city, major roads, and the Marmaton River. Bronson can represent the higher western side, while Mapleton and Fulton provide northern references close to the Little Osage drainage. Lake Fort Scott and Prairie Creek add useful southern examples. These locations make the page about Bourbon County rather than about county maps in general.
Details Worth Checking in the High-Resolution Files
The web previews are convenient for understanding the overall pattern, but the original JPG files are better for small labels and close comparison. Each source image is 3638 by 2572 pixels. The ZIP includes the general county map, ranked city map, terrain-and-water map, and elevation map. A practical way to explore them is to locate Fort Scott first, trace U.S. 54 westward, and then compare the Marmaton River and elevation colors around the same corridor.
Readers interested in the west can enlarge Bronson, Uniontown, and the surrounding tributaries, then compare those locations with the stronger brown relief in the elevation layer. In the north, the Little Osage River, Limestone Creek, Mapleton, and Fulton make another useful cluster. The southern half offers Elm Creek Lake, Lake Fort Scott, Paint Creek, Prairie Creek, and the routes crossing that terrain. High resolution is especially helpful where small stream names overlap a dense network of local roads.
These maps are intended for geographic reference, learning, presentation, and ordinary printing. They are not substitutes for legal boundary records, current road-control notices, parcel ownership documents, flood determinations, or professional survey information. The downloadable originals simply provide a clearer version of the same geographic content shown on the page, allowing users to zoom in without depending on the smaller web preview.
Frequently Asked Questions
Which map best shows Fort Scott in relation to the Marmaton River?
Start with the general county map to locate Fort Scott, U.S. 69, and U.S. 54, then use the water-and-terrain map to follow the Marmaton River and nearby tributaries. The river occupies lower ground around the east-central part of the county, and the elevation map confirms that much of this corridor is lower than the western uplands. Using the three views together gives a more complete answer than relying on the city map alone.
Why does western Bourbon County look higher than the Fort Scott area?
The elevation map shows broad areas of brown and orange on the western side, while the Marmaton and Little Osage river corridors are mainly greener and lower. Western ridges are still cut by many small tributary valleys, so the terrain is not uniformly high. The displayed range of about 231 to 340 meters is useful for countywide comparison but is not precise enough for parcel, construction, or surveying work.
What is included in the Bourbon County download ZIP?
The archive contains four high-resolution JPG files corresponding to the maps shown on the page: the general county map, ranked city map, water-and-terrain map, and elevation map. Each original is 3638 by 2572 pixels. They are suitable for zooming, ordinary printing, classroom use, and geographic reference, but they do not replace legal, engineering, or live emergency information.
Map File Information
Download the high-resolution JPG originals corresponding to the Bourbon County general map, city map, water-and-terrain map, and elevation map shown on this page.
- File Type: ZIP containing 4 JPG files
Related Maps
Sources and References
For authoritative background data, see the U.S. Census Bureau TIGER/Line Shapefiles, USGS National Hydrography, and USGS 3D Elevation Program. County history and the identification of Fort Scott as the county seat can be checked through the Kansas Historical Society Bourbon County profile. The geographic descriptions on this page are centered on features visible in the supplied maps.
Green Map creates custom-edited map images using open geographic data sources such as geoBoundaries, Natural Earth, OpenStreetMap, and government open data.
These maps are edited visual materials, not raw data files, and are provided for education, documents, presentations, and graphic reference.