Tama County sits in east-central Iowa, where a network of small cities, numbered highways, creeks, and the Iowa River gives the county a more varied layout than a quick statewide view suggests. This Tama County Map page is designed to make those relationships easy to see. The reference map places towns and roads together, the city map emphasizes the leading population centers, the water map traces the named streams and lakes, and the elevation map shows how the river valleys sit below the surrounding uplands. Full-resolution JPG copies of the maps can be downloaded from the file box near the end of the article. High-resolution map files are available for download in the section below.
A useful way to orient yourself is to start in the southern part of the county with Tama and Toledo. They sit close together near US 30, while a north-south route runs through Toledo and continues toward the northern communities. Farther north, Traer, Dysart, and Gladbrook form a broad line of towns, with Garwin positioned between the northern group and the Tama–Toledo area. The maps also label smaller places such as Clutier, Vining, Elberon, Chelsea, Montour, Le Grand, and Lincoln, so the page works as a county-wide reference rather than a map of only the largest cities.
Table of Contents
Following US 30 through the Tama–Toledo area
The county reference map gives the clearest overall picture of roads, communities, waterways, and the county outline. US 30 is the most obvious east-west route in the southern half of the map. It passes through the Tama–Toledo area and provides an immediate anchor for finding the rest of the county. Route 63 meets this area from the north and south, making Toledo especially easy to locate. Once those two roads are identified, Chelsea can be found to the east, Montour to the west, and Garwin farther northwest. The map also marks routes 96, 8, 21, and 146, which help separate the northern, eastern, and southwestern edges of the county.
The settlement pattern is not dominated by one compact urban area. Tama and Toledo form the strongest southern concentration, but a second line of communities stretches across the north. Gladbrook appears toward the northwest, Traer lies farther east near a road junction, and Dysart sits close to the eastern side of the county. Smaller towns fill the spaces between these larger reference points. Tama County’s official community page lists thirteen cities, and the reference map labels a wide spread of them. That broader set of place names is useful when you are trying to understand where a creek, road, or neighboring location sits within the county rather than simply finding the largest city.
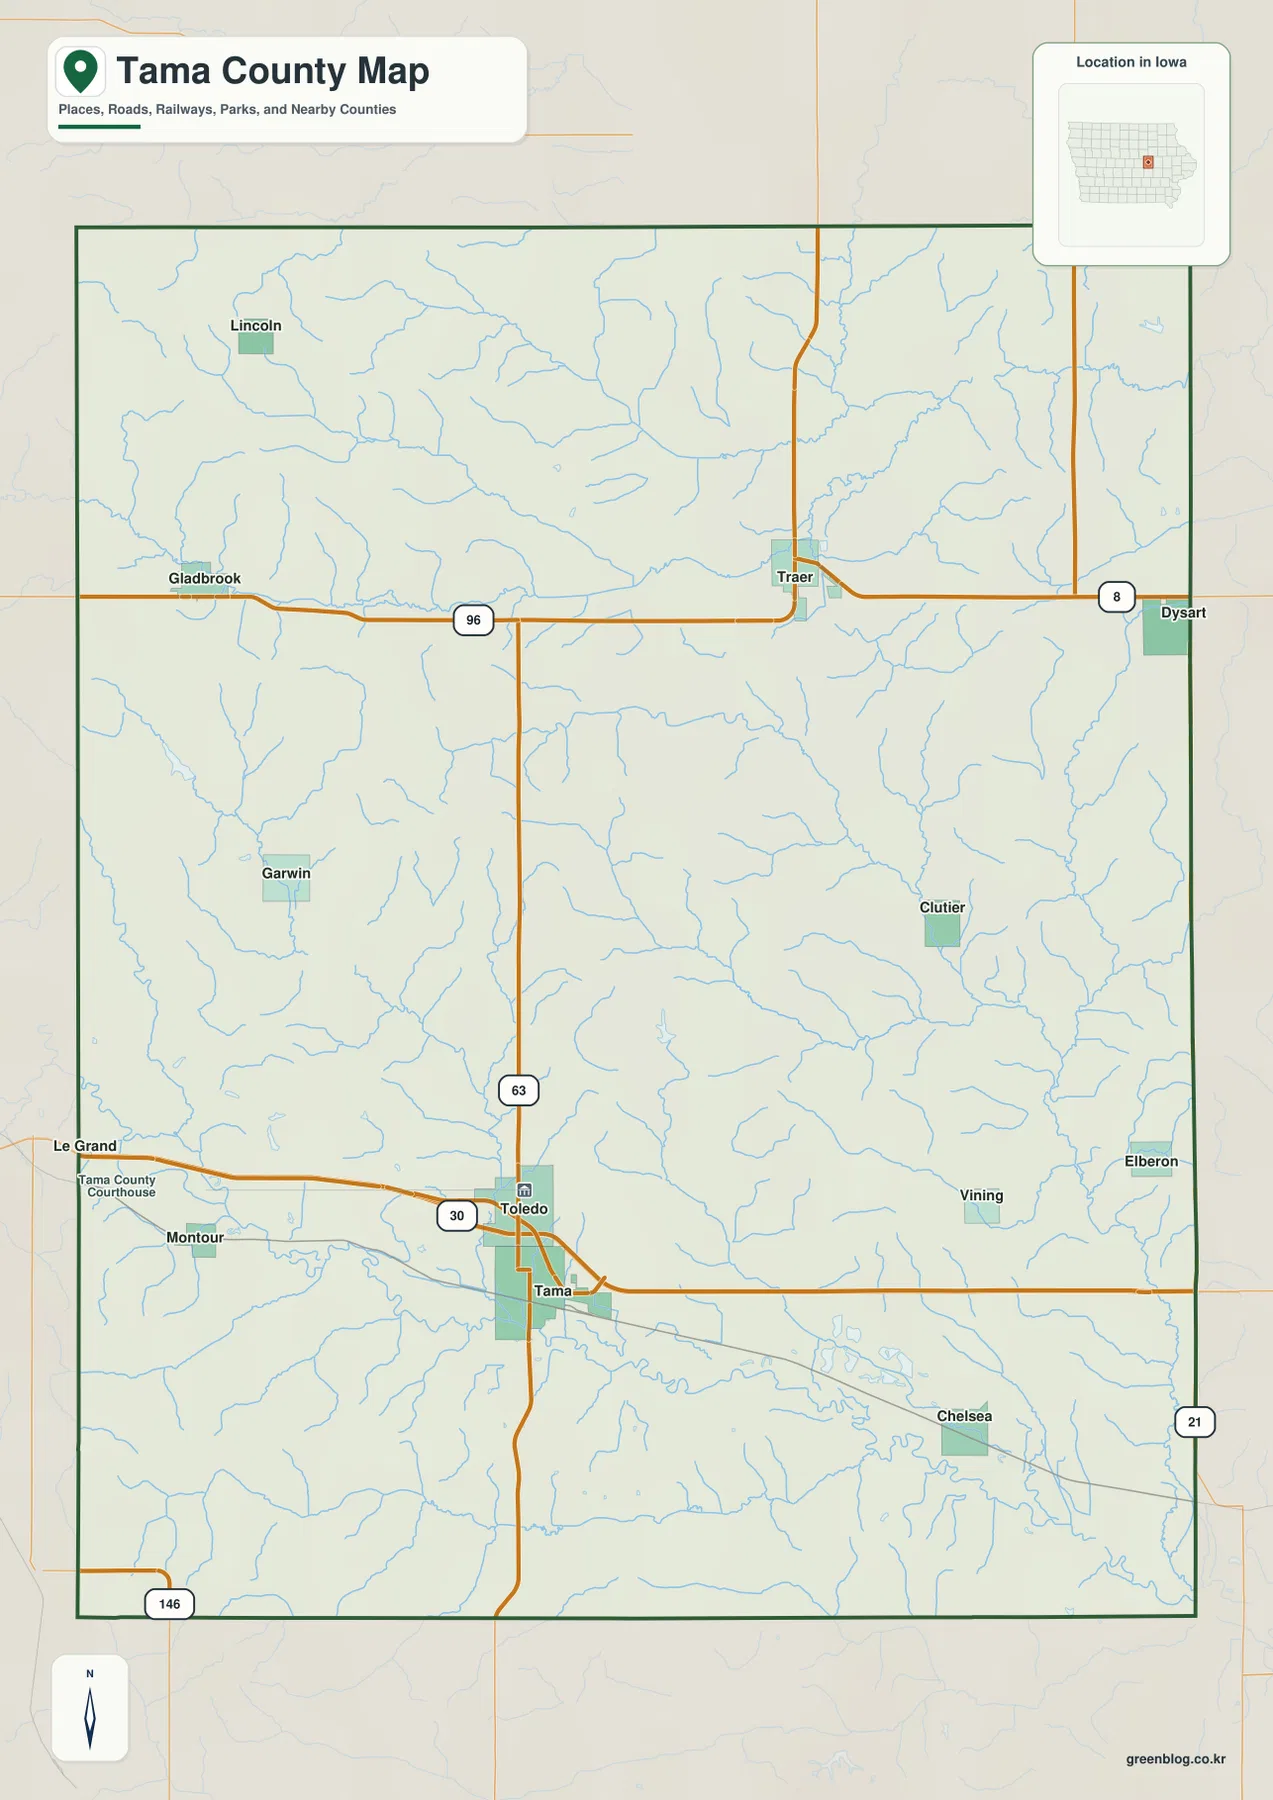
The map also shows a rail line running through the southern portion of the county near several communities. Together with US 30 and the north-south road through Toledo, it creates a noticeable concentration of transportation features around the Tama–Toledo area. That does not mean every trip in the county follows these routes, but it explains why the southern center is so easy to use as a geographic starting point. For readers comparing county maps, Tama County is a good example of a place where the main reference points are split between a southern road-and-river corridor and a looser chain of towns across the north.
Six highlighted cities and a wider network of communities
The city distribution map simplifies the county by calling out six major places: Tama, Toledo, Traer, Dysart, Gladbrook, and Garwin. The printed index ranks Tama first and Toledo second, while Traer and Dysart form the next major pair in the north. Gladbrook and Garwin complete the set. Because the map reduces visual clutter, it is easier to compare the spacing between these communities than on the more detailed reference map. Tama and Toledo are very close together, whereas the northern cities are spread across a much wider east-west band.
Toledo is especially important for orientation because the county’s official website identifies it as the county seat. On the city map it sits just north of Tama, so the two places can look almost like one continuous southern center at a county scale. Traer is well north of them and closer to the middle of the northern half. Dysart lies to the east of Traer, Gladbrook to the west, and Garwin farther southwest. This arrangement makes the city map useful for planning a county-wide overview, comparing where communities cluster, or explaining why a road that looks short on a statewide map may still cross a substantial part of the county.
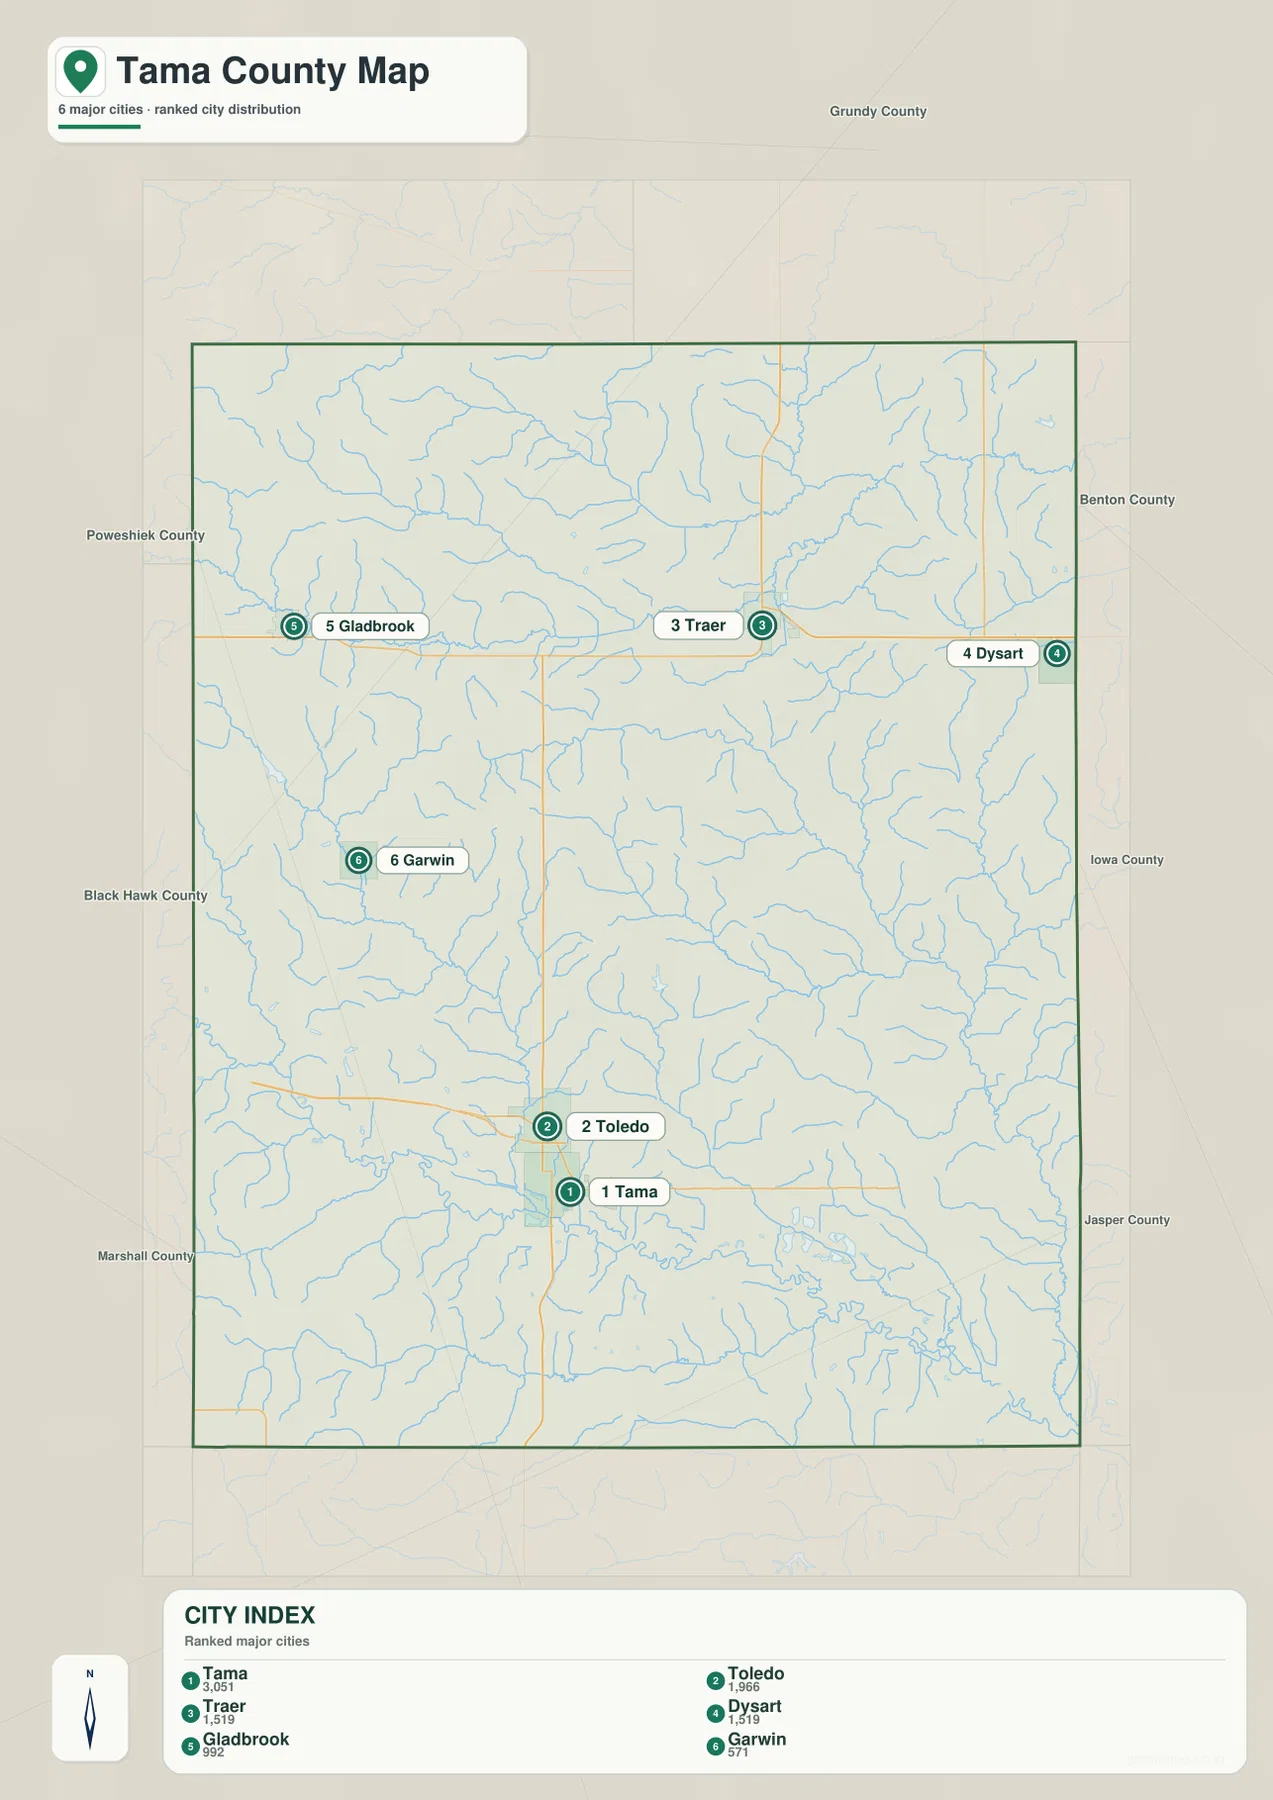
The population figures printed in the city index should be read as part of this map set rather than as a substitute for the latest official population estimate. Counts can differ by source year and update schedule. The stronger value of this map is the spatial comparison: which cities are close together, which sit near the county edges, and how far the northern group is from Tama and Toledo. If you need turn-by-turn directions, current road closures, or exact driving distances, use a current navigation service. This map is meant for county-level geographic reference and clear printed comparison.
Iowa River, Wolf Creek, and the county’s branching waterways
The water and terrain map shifts attention away from roads and places and makes the drainage network the main subject. The Iowa River is the strongest feature in the southern portion of the county, winding from west to east through a broad low corridor. Several tributaries descend toward it. Deer Creek runs through the central-western area, Salt Creek occupies the eastern side, and smaller named streams join the system from both north and south. This pattern explains why the southern part of the county contains a wide, connected river valley rather than a single narrow channel.
The northern half has its own recognizable network. Wolf Creek crosses a large part of the north-central area, while Twelvemile Creek and Fourmile Creek appear farther north. Coon Creek lies toward the east, and the map also labels Richland Creek, Sugar Creek, and Otter Creek in the southern half. Several lakes add smaller water features to the picture: Union Grove Lake appears in the west-central area, Sportsman Lake farther southwest, Cherry Lake near the Iowa River corridor, and Rainbow Lake toward the southeast. Seeing these names together is especially helpful when a local place is described in relation to a creek or lake rather than a highway.
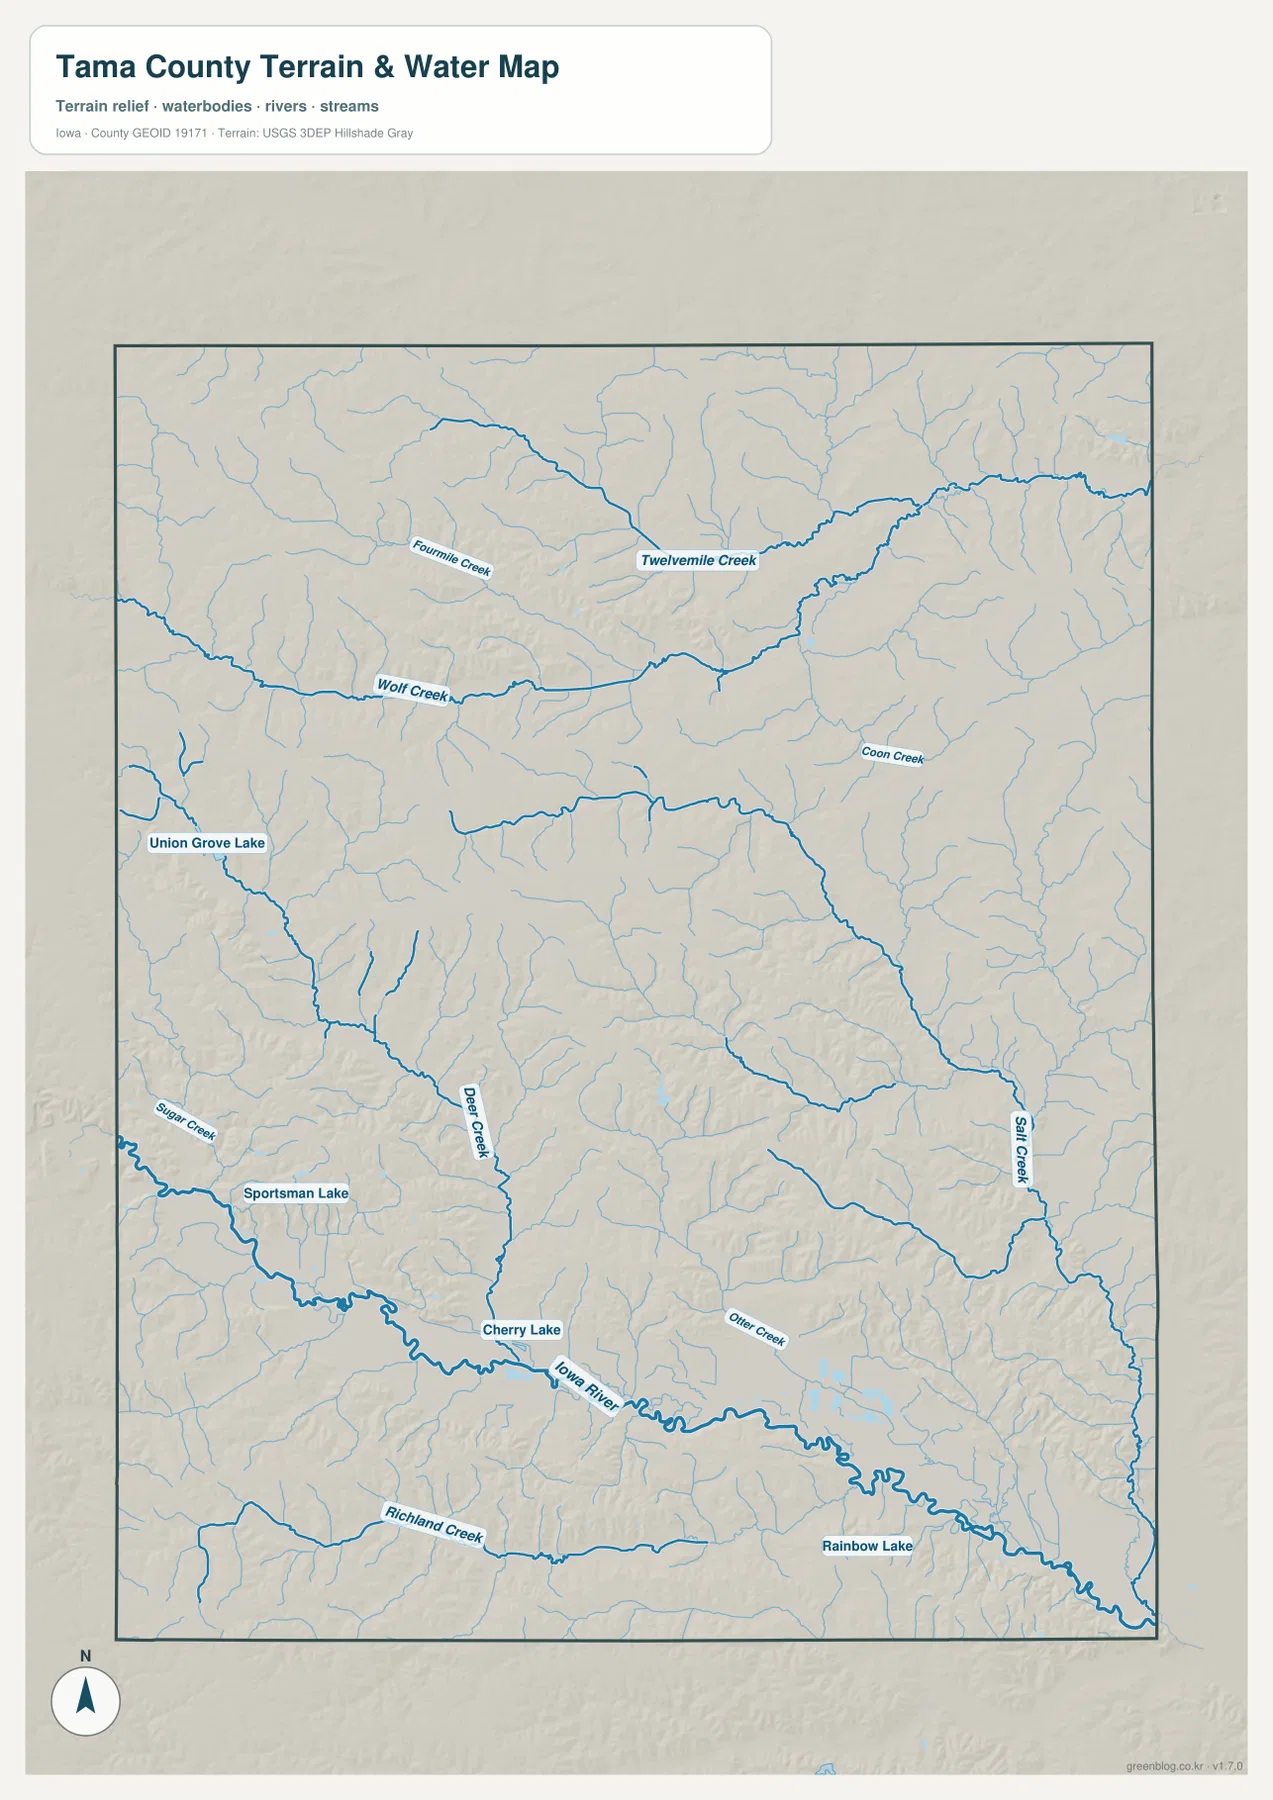
This is a reference map of waterways and terrain, not a flood-risk product. It shows where rivers, creeks, and lakes are located and gives enough shaded relief to see the broad form of the valleys. It does not show flood probabilities, levee certification, navigation conditions, property boundaries, or real-time water levels. For those questions, a specialized official source is required. Used for its intended purpose, however, the map makes an important county-wide relationship obvious: many of the lower corridors on the terrain image line up with the named streams that eventually feed the Iowa River or other connected drainage routes.
Elevation reveals the valleys beneath the uplands
The elevation map adds a third layer of geographic context. Its legend shows an actual range of roughly 233 to 329 meters and a mean of about 286 meters for the mapped county area. Green tones occupy the lower ground, while yellow, orange, and brown tones mark progressively higher terrain. The broad Iowa River valley in the south stands out as one of the lowest connected areas. Narrow green branches extend away from it along tributary valleys, so the elevation image visually reinforces many of the stream paths shown on the water map.
Higher ground is broken by numerous creek valleys rather than forming one smooth plateau. The west and northwest show many closely spaced ridges and shallow valleys, while the eastern and northeastern portions also contain narrow low corridors cut into higher ground. This creates a textured landscape even though the county does not have mountainous relief. The important contrast is local: river and creek bottoms sit below the interstream uplands, and that difference repeats across much of Tama County. The elevation map is therefore useful for understanding the shape of the land, but it should not be treated as a survey-grade source for the exact elevation of a building, parcel corner, road project, or engineering site.
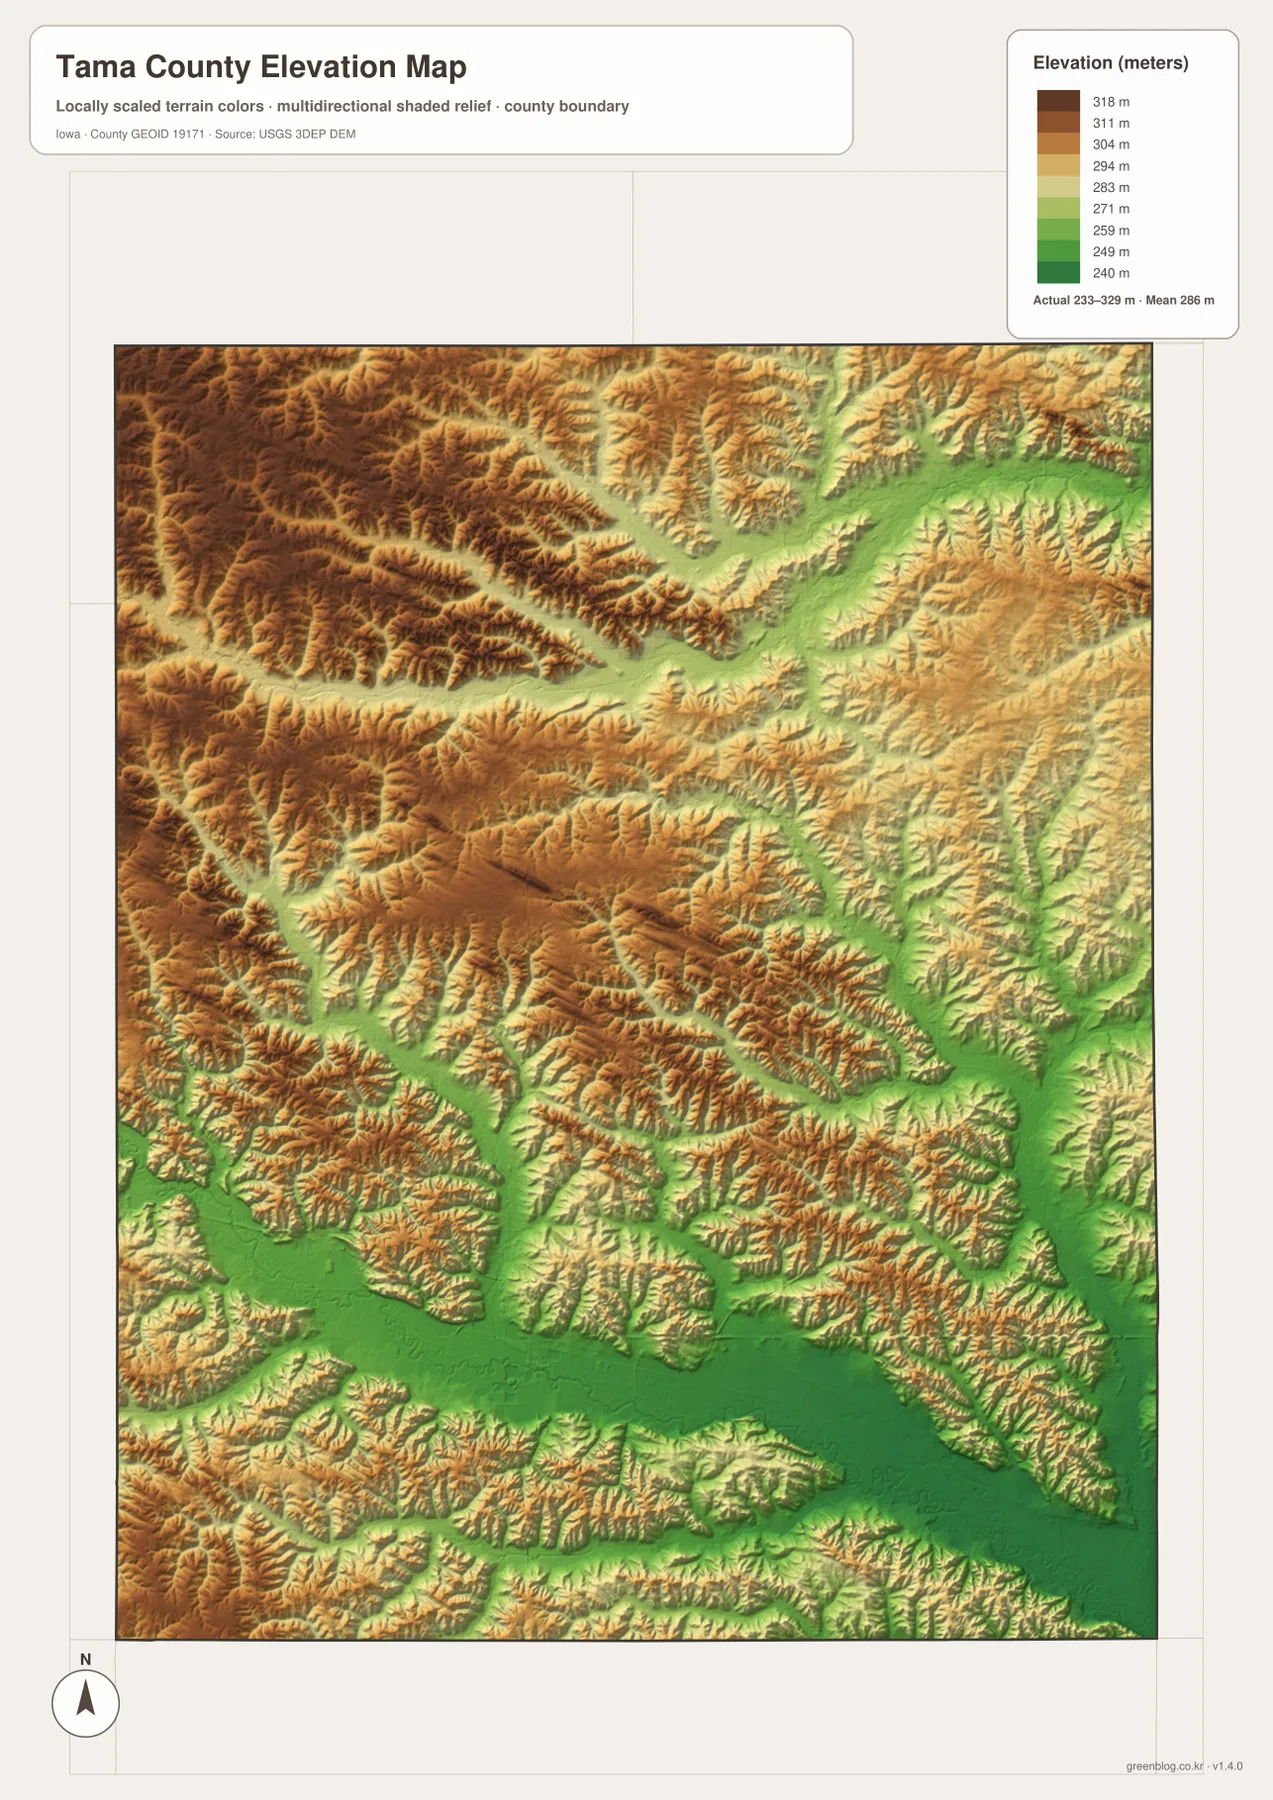
Comparing the elevation and water maps side by side is more informative than reading either one alone. The low green corridors correspond closely with the Iowa River and many of the named creeks, while the warmer colors fill the areas between those channels. Returning to the city map then adds settlement context. Tama and Toledo sit near the southern river system, while the northern towns occupy a landscape divided by Wolf Creek and other smaller valleys. This layered comparison is useful for students, local-history readers, map collectors, and anyone who wants a compact explanation of why the county’s roads and communities appear where they do.
Choosing the most useful map for the task
For general orientation, begin with the county reference map because it includes the most place names and road labels. It is the best choice when you need to locate a small community, compare a town with US 30 or Route 63, or see how the southern and northern groups of settlements fit inside the county boundary. The city map is better when you want a cleaner view of the principal population centers. Its reduced detail keeps the eye on the relative spacing of Tama, Toledo, Traer, Dysart, Gladbrook, and Garwin instead of the many smaller labels on the full map.
Use the water map when a description refers to the Iowa River, Wolf Creek, Twelvemile Creek, Deer Creek, Salt Creek, or one of the named lakes. It is also the easiest map for tracing how smaller channels join larger ones. The elevation map becomes most useful when the question is about low river corridors versus higher surrounding ground. For a presentation or printed handout, pairing the reference map with either the water or elevation map usually gives a clearer story than repeating the same base map. Each image on the page serves a distinct purpose, so choosing the map by question keeps the final result simpler and easier to read.
Print size matters as well. The reference map contains many small labels, so it benefits from a larger page or from viewing the full-resolution file. The city map is less crowded and remains readable at a smaller size. The water map contains numerous creek names that become easier to follow when enlarged. The elevation map relies on gradual color changes, which are clearest on a color screen or color print. The downloadable archive below keeps the original high-resolution JPG versions together so you can use the same maps at a larger scale than the lightweight article previews.
Frequently Asked Questions
Why are Tama and Toledo the best starting points on the map?
They are close together in the southern part of the county near US 30, and Toledo is the county seat according to the official Tama County community information. Finding those two cities gives you an immediate reference for Chelsea and Montour to the east and west, Garwin farther northwest, and the northern group around Traer, Dysart, and Gladbrook. The Iowa River also runs through the southern part of the county, so the Tama–Toledo area links the road, settlement, and river maps in one easy reference point.
Can the water map be used to identify flood zones?
No. It is designed to show the locations of the Iowa River, named creeks, lakes, and the general form of the terrain around them. It does not contain flood-frequency zones, modeled inundation limits, levee performance, or current river-stage data. For flood planning or property decisions, consult the appropriate FEMA products and current local or state emergency-management information. The map on this page is best used for geographic orientation and for understanding how the named waterways are distributed across Tama County.
How precise are the elevations shown on the elevation map?
The legend summarizes a county-wide range of about 233 to 329 meters and a mean near 286 meters, which is useful for comparing lower valleys with higher uplands. The shaded image is intended for regional interpretation rather than parcel-level measurement. It can show that the Iowa River corridor is lower than nearby uplands and that tributary valleys cut into higher ground, but an engineering, construction, or surveying project should rely on the underlying USGS data or a professional survey rather than values estimated from this page.
Map File Information
The download contains the same county, city, water-and-terrain, and elevation maps shown on this page as full-resolution JPG files. The downloadable originals are intended for clearer printing and close inspection than the lighter WebP previews used in the article.
- Included Files: Tama County reference map, city distribution map, water and terrain map, and elevation map
- Printable Size: 2572 × 3638 px for each JPG
Related Maps
Sources and References
The map set is supported by county information and authoritative national mapping sources. These links are useful for checking the official community list and for understanding the boundary, hydrography, and elevation datasets behind county mapping.
- Tama County official About page – county overview and community context
- Tama County Communities – official information for Tama, Toledo, and other county cities
- U.S. Census Bureau TIGER/Line Shapefiles – county boundaries, roads, and place-reference data
- USGS National Hydrography – national river, stream, and waterbody data
- USGS 3D Elevation Program – elevation data and 3DEP documentation
Green Map creates custom-edited map images using open geographic data sources such as geoBoundaries, Natural Earth, OpenStreetMap, and government open data.
These maps are edited visual materials, not raw data files, and are provided for education, documents, presentations, and graphic reference.