Mineral-rich does not automatically mean mineral-dependent. A country can extract substantial quantities of metals and still record a small mineral-rent share if production costs are high or the rest of the economy is much larger. World Bank data for 2021 show a highly uneven global distribution. Among 197 economies with reported values, 108 record exactly 0%, while a small group of mining-intensive economies reaches double-digit shares of GDP.
Mineral rents are not the same as mining revenue, exports or corporate profit. The World Bank definition measures the difference between the value of mineral production at world prices and the total cost of production. The covered minerals are tin, gold, lead, zinc, iron, copper, nickel, silver, bauxite and phosphate. Because the indicator is expressed as a share of GDP, it describes the relative economic rent generated by this set of minerals, not the physical volume mined.
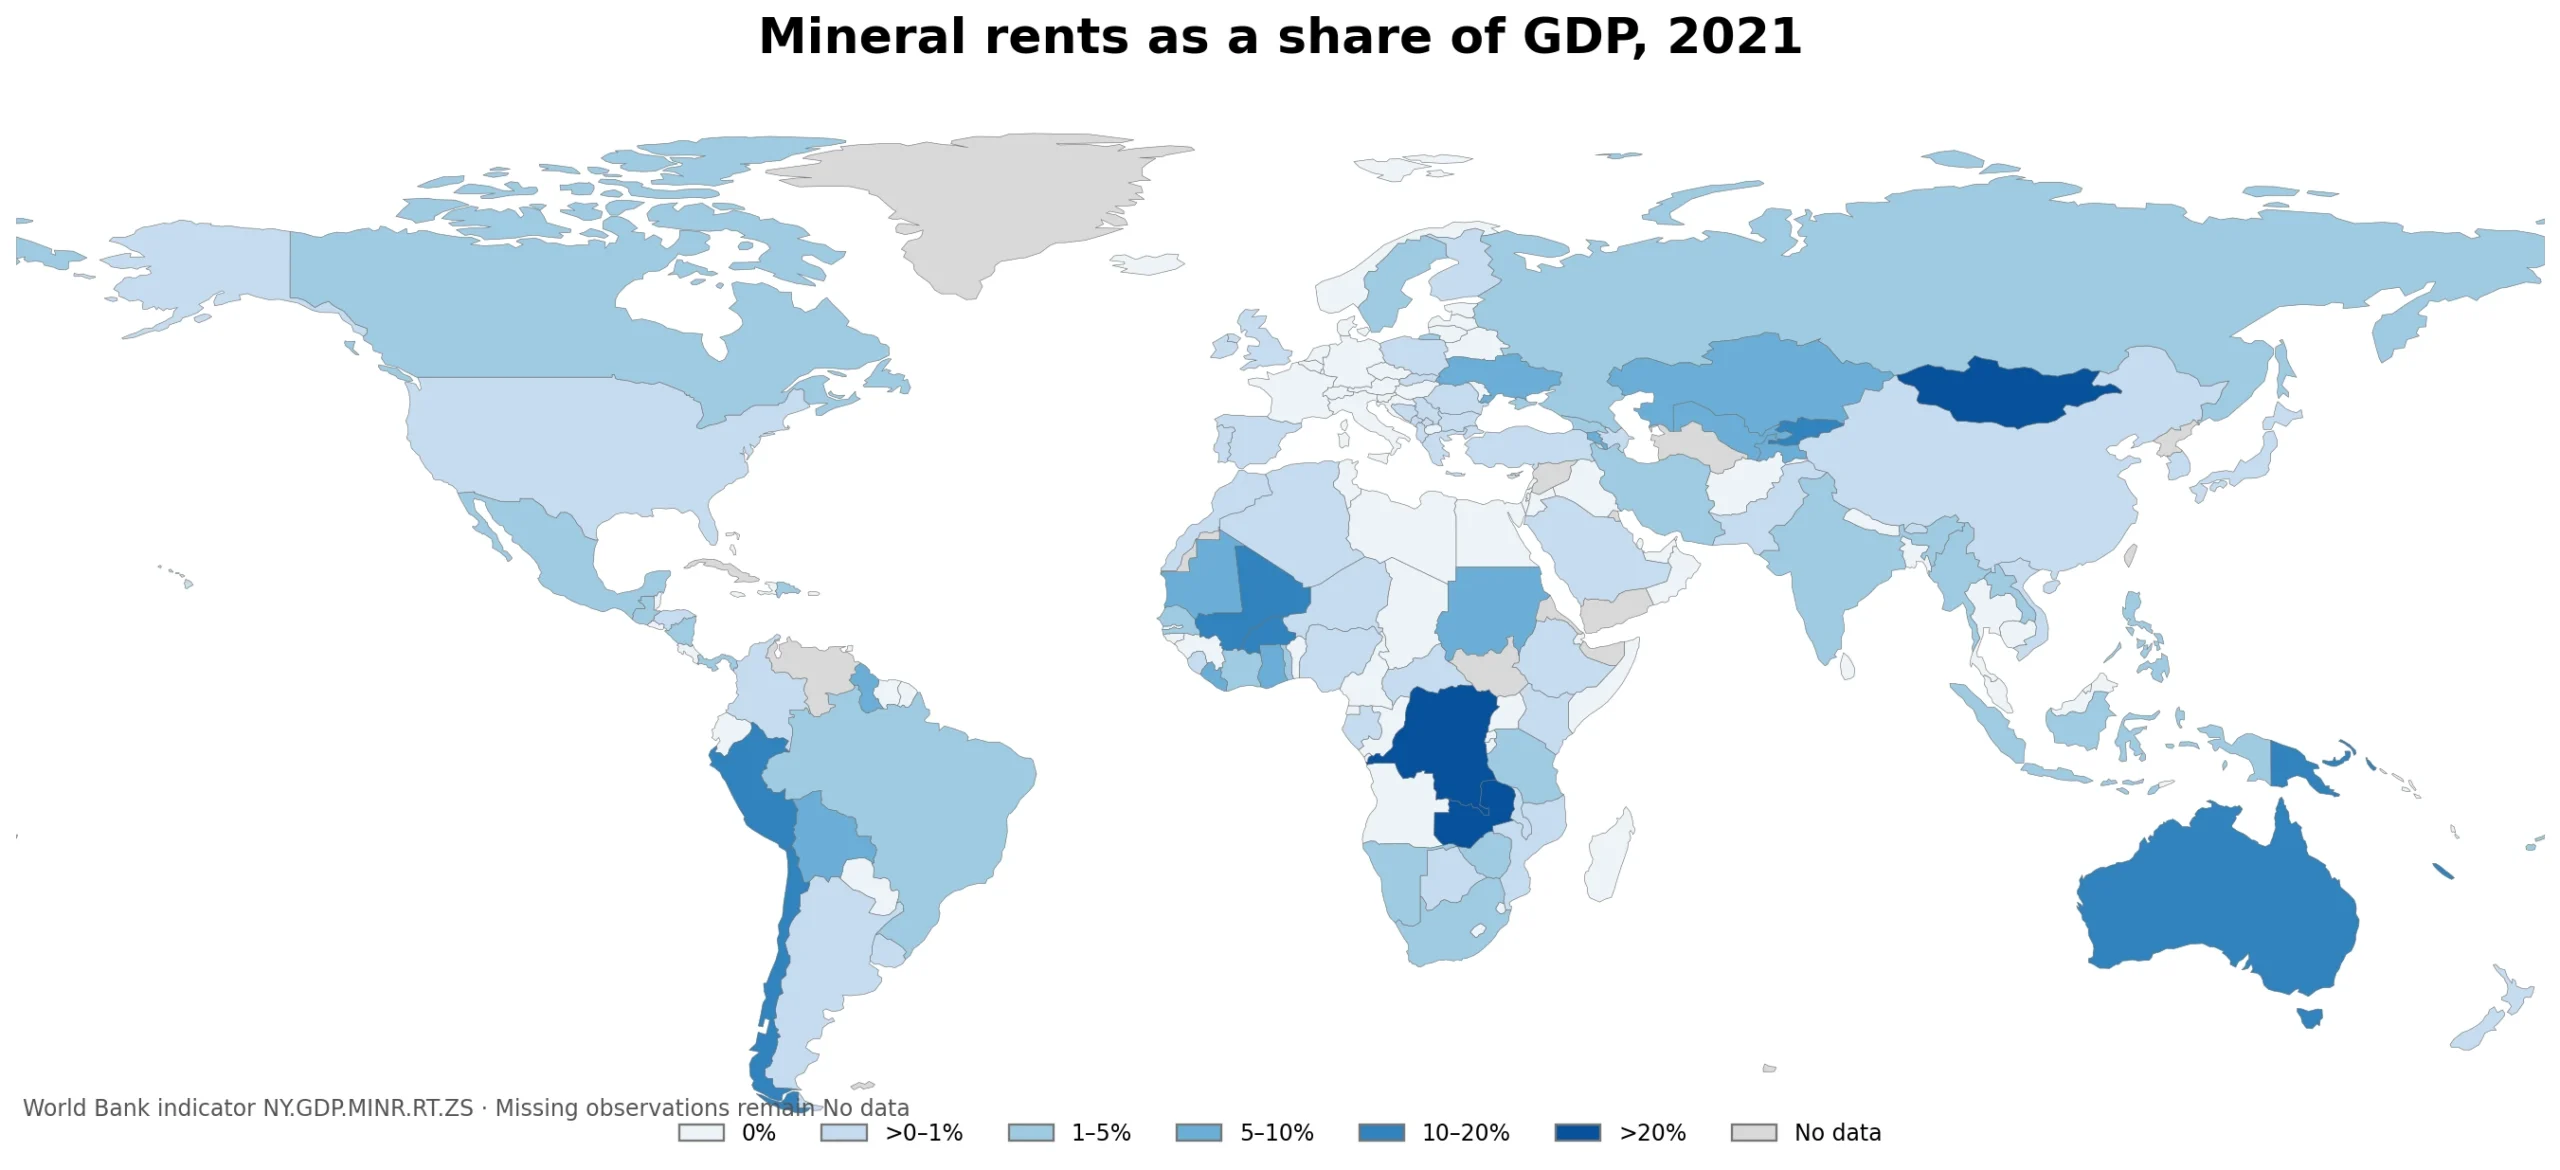
Table of Contents
The median across reporting economies is 0%
The source contains 217 country and economy rows. Values are reported for 197 of them, while 20 are source-missing. Across the reported observations, the mean is 1.76% and the median is 0.00%. The 25th percentile is 0.00% and the 75th percentile is 0.66%. That combination shows an extremely right-skewed distribution: most economies sit near zero, while a small number of mining-intensive economies lift the average.
The 108 exact zero values are important. They are not missing observations that were converted to zero. They are reported values in the underlying data. Even so, a 0% value should not automatically be read as “no minerals” or “no mining.” It means the measured mineral rents are zero at the indicator’s reported precision and scope. Production may be limited, costs may absorb the world-price value, or the relevant mineral activity may be very small relative to GDP.
| Range | Economies |
|---|---|
| 0% | 108 |
| >0–1% | 43 |
| >1–5% | 24 |
| >5–10% | 11 |
| >10–20% | 8 |
| >20% | 3 |
The highest shares are concentrated in a small group of mining-intensive economies
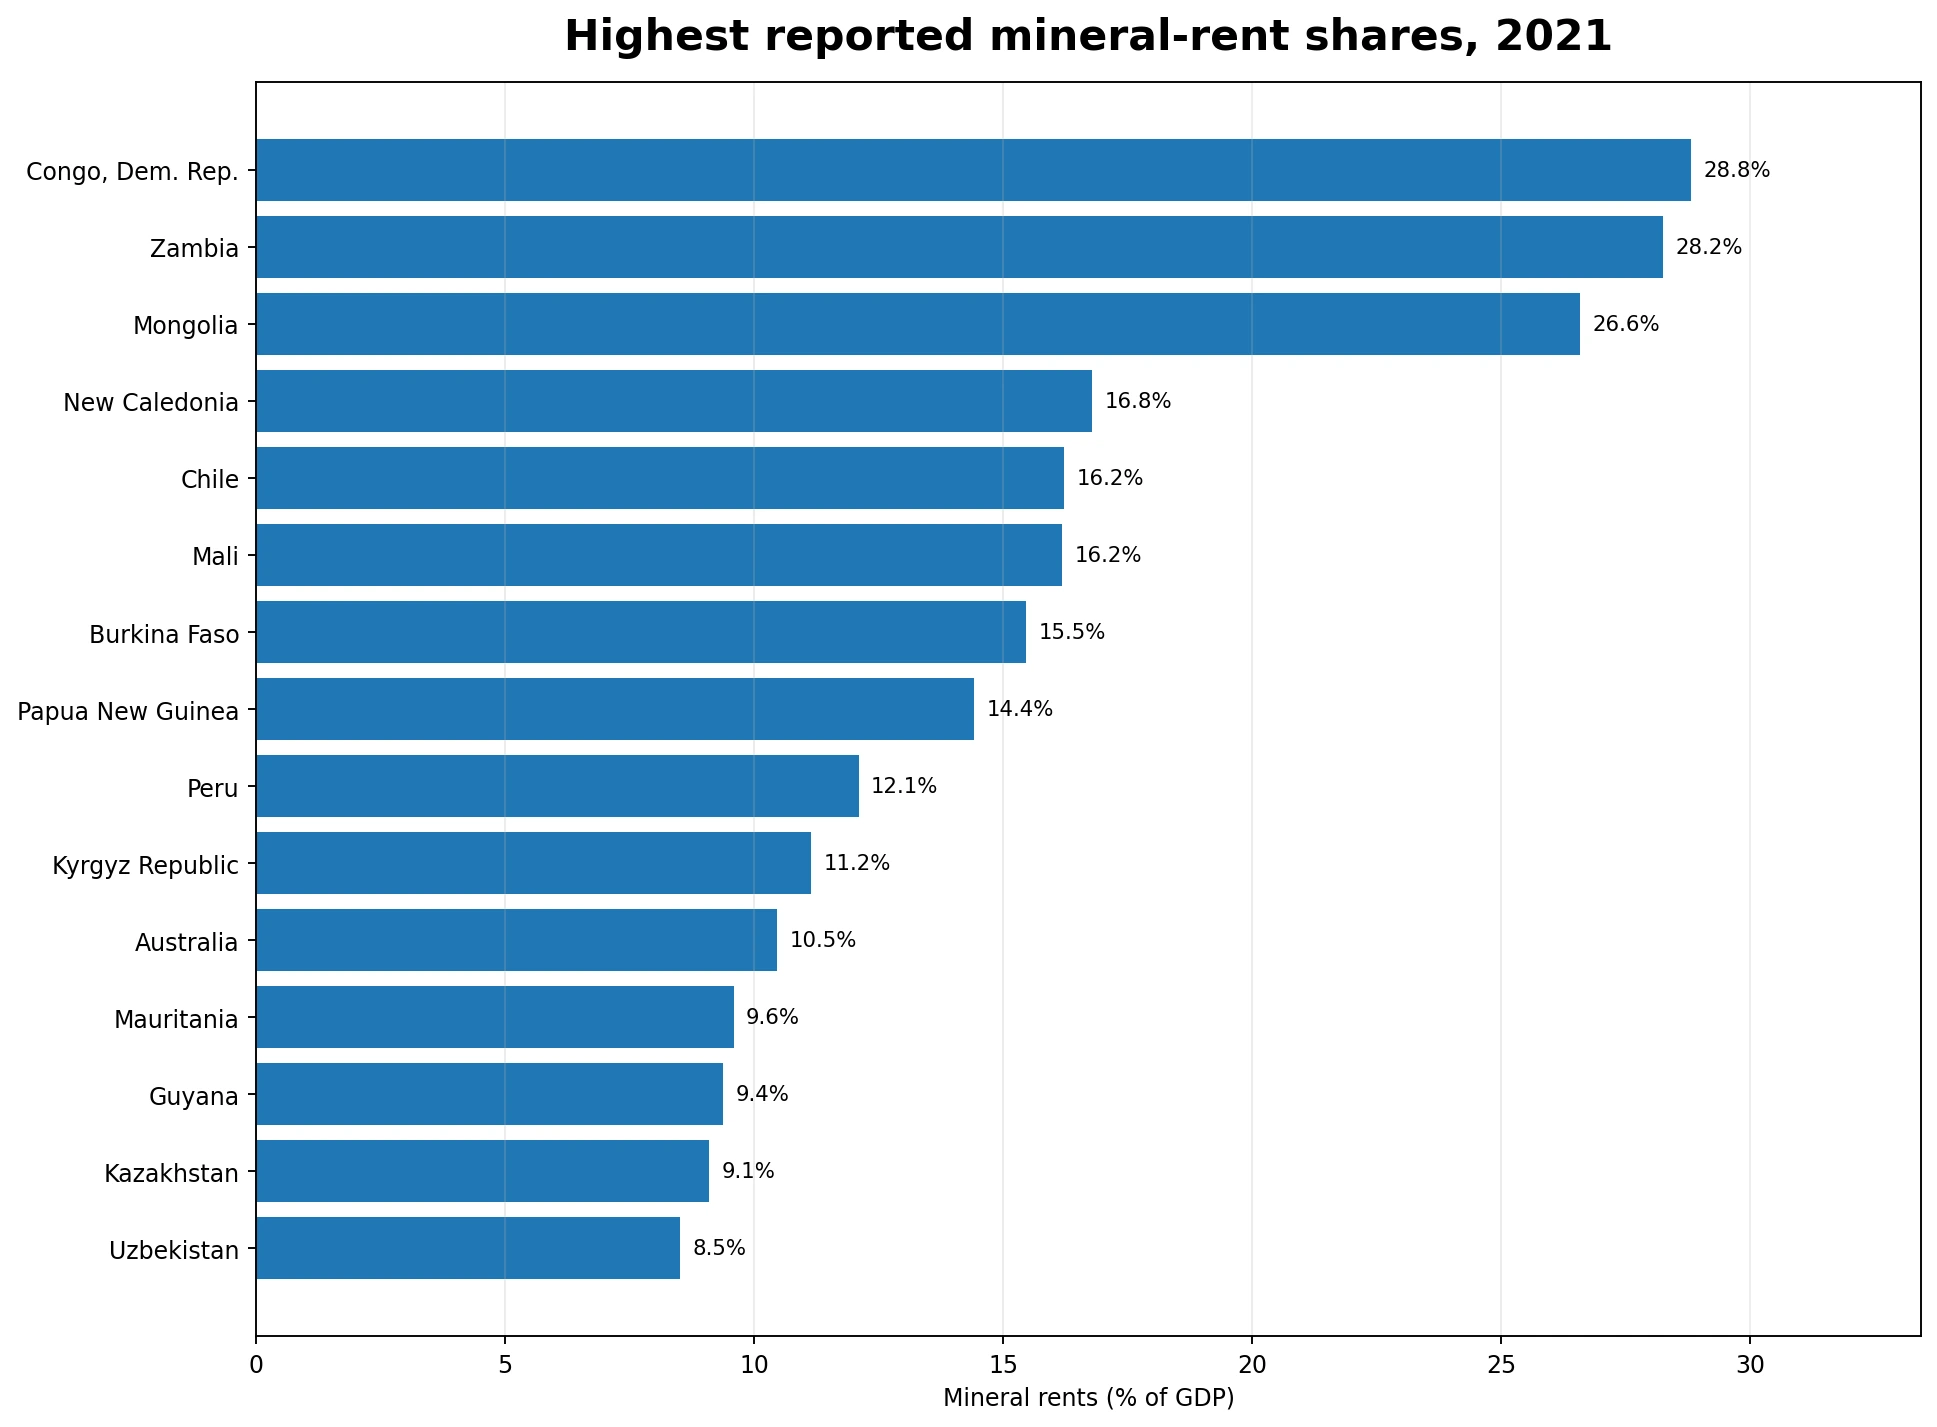
The Democratic Republic of the Congo records the highest value at 28.81%, followed closely by Zambia at 28.25%. Mongolia is third at 26.57%. New Caledonia reaches 16.78%, Chile 16.23%, Mali 16.18%, Burkina Faso 15.45%, Papua New Guinea 14.41%, Peru 12.10% and the Kyrgyz Republic 11.15%. These economies differ greatly in geography and income level, but mineral extraction has a large enough rent relative to the rest of the economy to stand out in the ratio.
Africa illustrates the unevenness especially clearly. Zambia and the Democratic Republic of the Congo exceed 28%, yet South Africa is 3.83%, Namibia 3.17% and Botswana 0.24%. In West Africa, Mali is 16.18%, Burkina Faso 15.45%, Liberia 5.44% and Ghana 5.17%, while Guinea is reported at 0%. The presence of mineral deposits alone does not determine the result. Production scale, commodity mix, costs, prices and the size of non-mining sectors all matter.
The Andean economies show another visible cluster
In South America, Chile at 16.23% and Peru at 12.10% are clear high-share cases, while Bolivia is 5.91%. Brazil is lower at 4.49% and Argentina at 0.58%. The contrast is useful because it separates two ideas that are often confused: a country can be an important mineral producer in absolute terms without having mineral rents dominate GDP. A larger and more diversified economy can produce a lower ratio even with substantial mining activity.
Guyana records 9.38%, also well above the global median. However, a high value in one year should not be turned into a permanent label. Mineral rents are sensitive to commodity prices, production volumes and costs. The denominator also changes as GDP rises or falls. For that reason, the 2021 map is best read as a cross-sectional snapshot rather than a fixed ranking of long-run mineral dependence.
Central Asia and Oceania contain several high-share economies
Mongolia is the standout in Central Asia at 26.57%. Kazakhstan is 9.10%, Uzbekistan 8.50%, Tajikistan 7.09%, Armenia 6.79% and the Kyrgyz Republic 11.15%. The cluster shows that minerals play an important role across much of the region, but the spread also indicates that each economy has a different combination of mineral output, costs and non-mineral activity.
In Oceania, Papua New Guinea reaches 14.41%, Australia 10.47% and New Caledonia 16.78%. Australia is notable because a double-digit rent share appears despite a very large and diversified economy. Many small island economies, by contrast, report zero or have no source value. Several of those islands and territories do not have a separate polygon in the low-resolution boundary layer used for the world map, but their observations are still included in the full statistics.
Low values do not necessarily mean mining is unimportant
The United States records 0.10%, China 0.51%, Canada 1.18%, India 1.32% and Indonesia 1.91%. These economies can have large mining industries in absolute terms, yet manufacturing, services, construction and other sectors make the GDP denominator much larger. The rent concept also subtracts production costs, so a large production value does not automatically translate into a large rent share.
Several economies, including France, Germany and Norway, are reported at 0%. Norway is a useful reminder about indicator scope. This mineral-rent measure covers the listed metallic and non-metallic minerals, while oil and natural gas rents are separate World Bank indicators. An economy whose natural-resource profile is dominated by hydrocarbons can therefore have a low mineral-rent share even when natural resources are economically important overall.
A high mineral-rent share is not a score of economic performance
The indicator tells us that economic rent from the covered minerals is large relative to GDP. It does not tell us whether growth is inclusive, whether public revenue is well managed, whether mining is environmentally sustainable or whether households benefit from the sector. Commodity booms can increase rents quickly, while falling prices can reduce them. A high share can also imply greater exposure to mineral-price cycles, but this single indicator cannot measure the size of that risk.
The reverse is also true. A low share should not be treated as evidence that mining is irrelevant. In a large economy, a substantial mining sector can look small as a percentage of GDP. For a fuller assessment, mineral rents should be read alongside production volumes, mineral exports, employment, government revenue, commodity composition and price trends.
Top 10 reported economies
| Economy | Mineral rents (% of GDP) |
|---|---|
| Congo, Dem. Rep. | 28.81% |
| Zambia | 28.25% |
| Mongolia | 26.57% |
| New Caledonia | 16.78% |
| Chile | 16.23% |
| Mali | 16.18% |
| Burkina Faso | 15.45% |
| Papua New Guinea | 14.41% |
| Peru | 12.10% |
| Kyrgyz Republic | 11.15% |
What this indicator can and cannot tell you
- It measures economic rent from the covered minerals: world-price production value minus total production costs.
- It is a share of GDP, so it is not a ranking of absolute mining output, mineral exports or company revenue.
- The covered minerals are tin, gold, lead, zinc, iron, copper, nickel, silver, bauxite and phosphate.
- Oil and natural gas rents are separate concepts and should be checked separately for hydrocarbon-dependent economies.
- The 20 source-missing economies remain missing; they were not converted to zero.
- A high value is not an investment signal or an overall score of economic quality.
How prices, costs and GDP can move the ratio
The numerator is not a fixed physical quantity. If the same volume of minerals is produced at higher world prices, the value of production can rise. If energy, labor, transport, processing or other production costs rise at the same time, the rent can increase by less or even decline. A year-to-year increase in the indicator therefore does not necessarily mean that mine output grew by the same percentage.
The GDP denominator matters just as much. Mineral rents could stay broadly stable while the ratio falls because manufacturing and services expand rapidly. The opposite can happen during a broad recession if non-mineral activity contracts. This is why the indicator is best used for understanding the relative macroeconomic weight of mineral rents, while production data are better for answering questions about physical mining activity.
Economic size and diversification change the interpretation
The contrast between the Democratic Republic of the Congo or Zambia and much larger economies such as the United States, China or Canada illustrates the role of diversification. A mining sector can be globally significant in absolute terms and still account for a small share of national GDP. By contrast, in a smaller or less diversified economy, a major mining sector can dominate the ratio.
That distinction also means this map is not a “most mineral-rich countries” map. Geological endowment is only one input. Commercial extraction, global prices, production costs and the scale of the rest of the economy shape the final percentage. The most useful interpretation is therefore structural: where does the economic rent from this defined set of minerals occupy an unusually large place in the economy?
Data and map method
This analysis uses World Bank indicator NY.GDP.MINR.RT.ZS for 2021. Aggregate groups are excluded from the country and economy master list. Of 217 rows, 197 contain a value and 20 are source-missing. The mean, median, quartiles and rankings use only the reported observations. The 108 exact zeros are retained as valid observations rather than treated as missing.
The world map joins ISO3 codes to a low-resolution country boundary layer. Of the 197 economies with reported values, 160 match a separate polygon after correcting known ISO omissions for France, Norway and Kosovo. Several small islands and territories do not have an independent polygon at this map resolution; their values remain in the statistics even when they are not visible as separate shapes. Missing source values are shown as No data and are never zero-filled.
Frequently Asked Questions
Does a 0% mineral-rent value mean there is no mining?
No. Zero is a reported value in this dataset, but it does not prove that an economy has no minerals or mining activity. It means the measured mineral rents are zero at the indicator’s scope and reported precision.
Are mineral rents the same as mining output or exports?
No. Mineral rents are the world-price value of mineral production minus total production costs, expressed here as a percentage of GDP.
Are oil and natural gas included in mineral rents?
This indicator covers tin, gold, lead, zinc, iron, copper, nickel, silver, bauxite and phosphate. Oil and natural gas rents are measured by separate World Bank indicators.
Were missing 2021 observations treated as zero?
No. The 20 source-missing economies remained missing and were excluded from summary statistics and rankings.
Related Articles
Green Map creates custom-edited map images using open geographic data sources such as geoBoundaries, Natural Earth, OpenStreetMap, and government open data.
These maps are edited visual materials, not raw data files, and are provided for education, documents, presentations, and graphic reference.