The share of young men who are outside education, employment and training varies sharply across countries in 2025. The World Bank indicator SL.UEM.NEET.MA.ME.ZS reports the modeled ILO estimate for males ages 15–24 who are not in education, employment or training, commonly called the male youth NEET rate. The dataset contains 217 country or area rows. A 2025 value is reported for 182 of them, while 35 are source-missing. Among the reported values, the median is 13.89% and the simple mean is 15.81%.
NEET stands for “not in education, employment or training.” The definition matters because this is not simply a youth unemployment rate. A young person can be without a job but still be enrolled in school or formal training and therefore not count as NEET. The denominator here is the male youth population ages 15–24, not the labor force and not the entire youth population of both sexes. Those boundaries need to stay fixed when countries are compared.
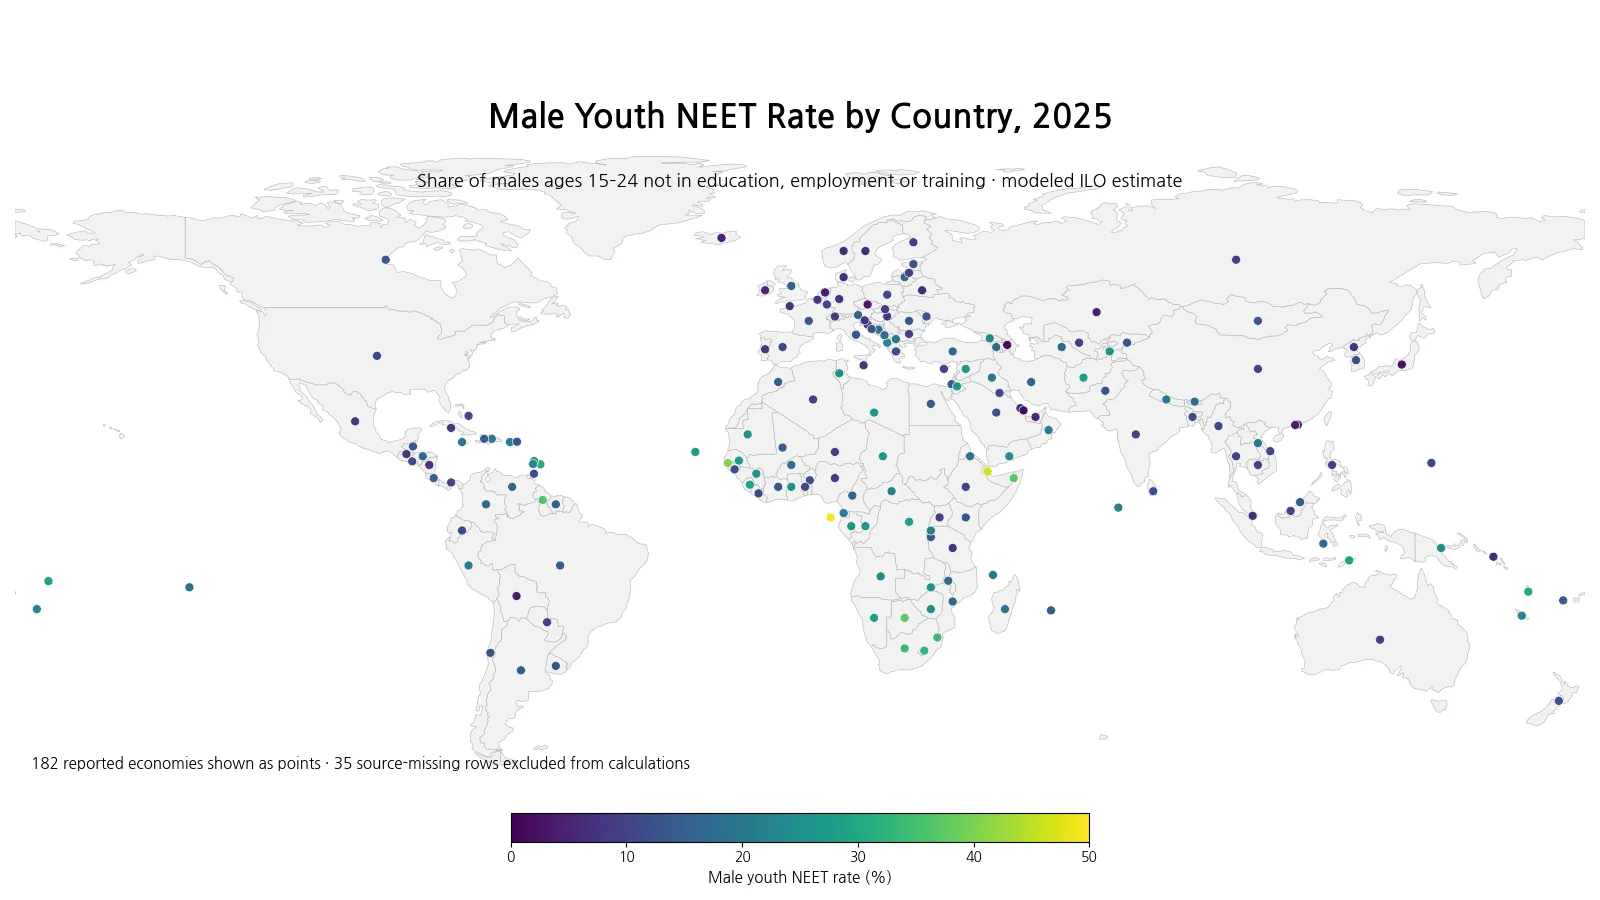
Table of Contents
The highest reported rates approach one half of male youth
Sao Tome and Principe has the highest reported 2025 value at 49.44%. Djibouti follows at 46.49%, the Gambia at 40.74%, Botswana at 37.87% and Somalia at 37.43%. In the top case, the modeled estimate places almost one out of every two males ages 15–24 outside education, employment and training at the reference time. The next two highest observations are also above 40%, showing that the upper tail is far removed from the middle of the distribution.
| Rank | Country or area | Male youth NEET rate |
|---|---|---|
| 1 | Sao Tome and Principe | 49.44% |
| 2 | Djibouti | 46.49% |
| 3 | Gambia, The | 40.74% |
| 4 | Botswana | 37.87% |
| 5 | Somalia, Fed. Rep. | 37.43% |
| 6 | Guyana | 36.01% |
| 7 | Eswatini | 34.05% |
| 8 | South Africa | 33.69% |
| 9 | Lesotho | 32.73% |
| 10 | Vanuatu | 30.77% |
Several of the highest observations are in Africa, but this ranking alone cannot establish a shared regional cause. A NEET rate combines participation in education, participation in training and attachment to employment. The same numerical result can therefore arise from different combinations of school enrollment, transitions into work, labor-market inactivity and data conditions. The indicator does not identify which of those mechanisms dominates in a particular country. It is best used first to locate large differences and then to guide more detailed country-level research.
At the low end, several reported rates are near or below 5%
Qatar records the lowest value at 1.39%, followed by Azerbaijan at 1.69%, Japan at 2.61%, Czechia at 3.34% and the Netherlands at 3.54%. These figures indicate that a relatively small share of male youth falls outside all three activities at once. They do not, by themselves, show the quality of employment, wage levels, hours worked, job security or the ease of moving from school to work.
| Rank | Country or area | Male youth NEET rate |
|---|---|---|
| 1 | Qatar | 1.39% |
| 2 | Azerbaijan | 1.69% |
| 3 | Japan | 2.61% |
| 4 | Czechia | 3.34% |
| 5 | Netherlands | 3.54% |
| 6 | Macao SAR, China | 3.84% |
| 7 | Iceland | 4.37% |
| 8 | Bolivia | 4.67% |
| 9 | Bahrain | 5.01% |
| 10 | Kazakhstan | 5.18% |
Education participation is especially important when the lower end is interpreted. A young man who does not have a job but remains in school is not classified as NEET. A country can therefore have a low male youth NEET rate because many young people are still studying, because many are employed, because training participation is high, or because of a combination of those states. The indicator summarizes the outcome but does not decompose it into those components.
The middle of the distribution is far below the maximum
Across the 182 reported observations, the first quartile is 9.76%, the median is 13.89% and the third quartile is 21.30%. Half of the reported country or area values therefore lie between roughly 9.76% and 21.30%. The full range runs from 1.39% to 49.44%, a spread of about 48.05 percentage points. The mean is above the median because the distribution includes a smaller group of observations in the 30–50% range that pull the average upward.
A simple bin count gives additional context. Eight reported economies are below 5%, 43 are from 5% to under 10%, 53 are from 10% to under 15%, 27 are from 15% to under 20%, 22 are from 20% to under 25%, and 18 are from 25% to under 30%. Another eight are from 30% to under 40%, while three are at 40% or above. The largest single group is the 10–15% band, but the distribution is broad enough that one global average hides substantial cross-country variation.
A NEET rate and an unemployment rate answer different questions
The youth unemployment rate normally uses the labor force as its denominator and focuses on people without work who meet the statistical criteria for unemployment. The NEET rate uses the entire youth population of the specified age and sex group as its denominator. It captures young people who have no employment and are also not in education or training, whether or not every individual is classified as an active job seeker. That broader scope is why a country’s unemployment rate and NEET rate can move differently.
This distinction also prevents an overly simple reading of the map. A high NEET rate should not automatically be described as high unemployment, and a low NEET rate should not automatically be described as strong employment. School enrollment can lower NEET even when a large share of youth has not yet entered the labor market. Conversely, labor-market inactivity outside education and training can raise NEET without appearing fully in an unemployment measure. The two indicators are complementary rather than interchangeable.
The male-only denominator is a central part of the series
The indicator covers males ages 15–24 only. It should not be generalized to all young people or used as a substitute for a female youth NEET series. Education participation, work participation, caregiving roles and job-search behavior can differ by sex, so a sex-specific measure is useful precisely because it isolates one population group. A direct gender-gap analysis would require a comparable female series for the same year and model framework; that comparison is outside the evidence supplied for this article.
The age range also shapes the result. Many people ages 15–24 are still in secondary school, university or vocational education. Others have already entered work. A country’s education system and typical transition age into employment can therefore influence how the population is distributed across the three states that determine NEET status. The single indicator does not show the share in each education level or the duration of labor-market transitions, so those mechanisms should not be inferred from the rate alone.
Missing 2025 values are not zeroes
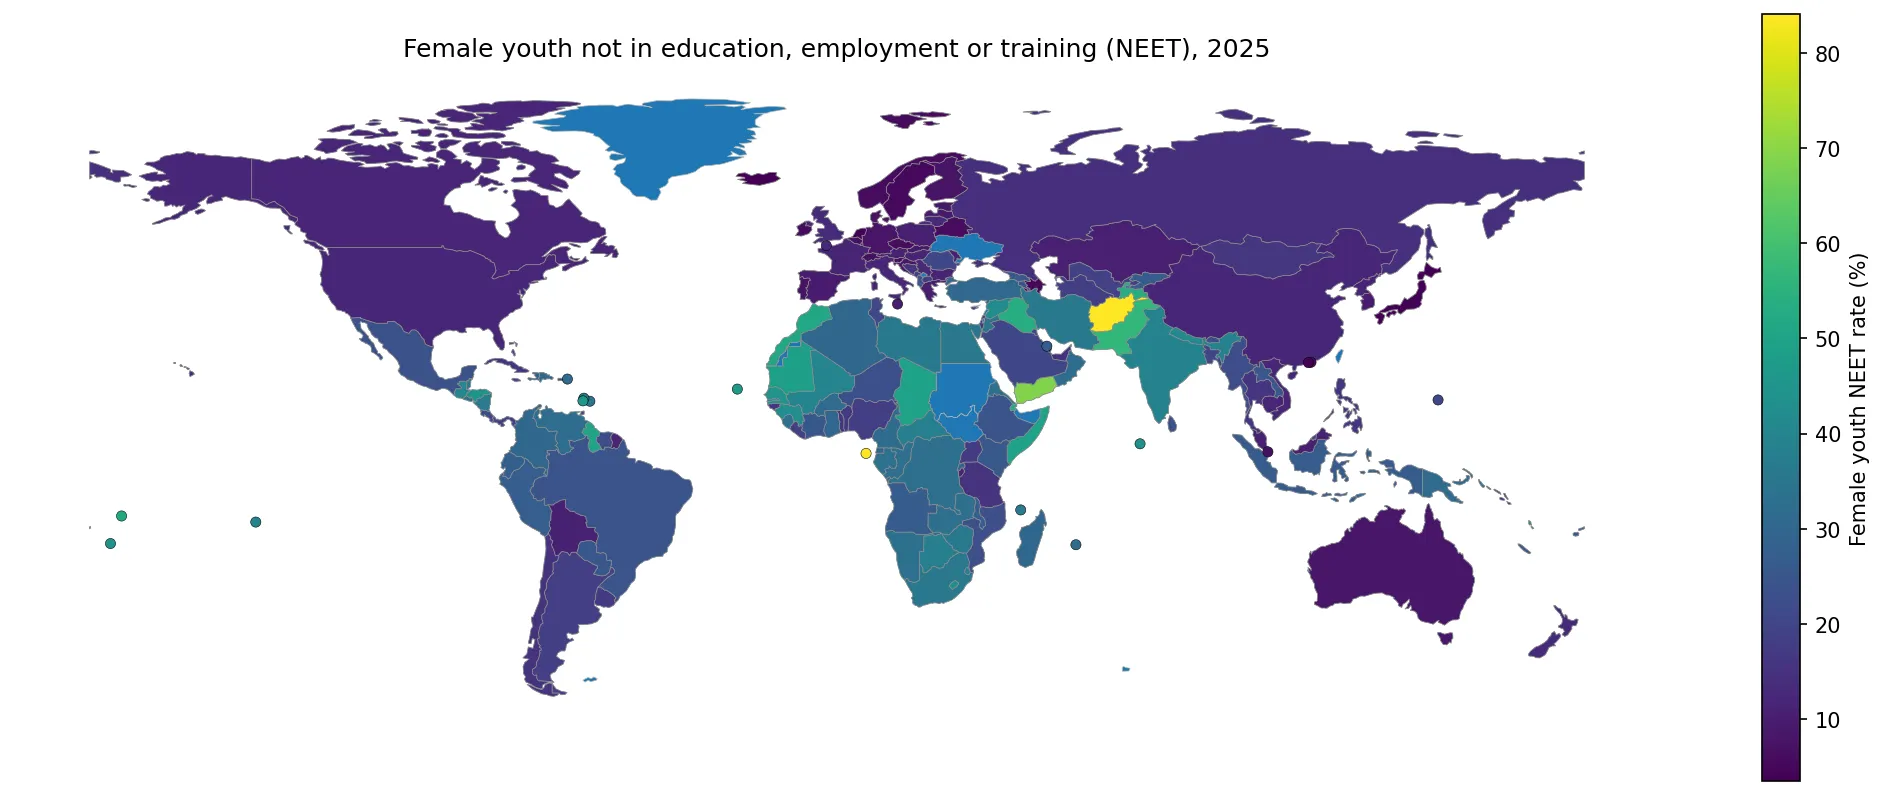
Of the 217 rows, 35 have no 2025 metric value. Those observations represent missing source data, not a 0% NEET rate. They are excluded from the mean, median, quartiles and rankings in this article. Replacing a missing value with zero would incorrectly place a country or area at the bottom of the ranking and would also reduce the global summary statistics. The visual uses color only for the 182 observations with actual reported values.
The 217 rows also include some territories and separately reported statistical areas in addition to sovereign states. For that reason, the reported count should be read as country-or-area observations in the World Bank series rather than as a count of independent countries. Small island economies and territories can be difficult to see as filled polygons on a world map, so the visual uses geographic points to preserve the presence of every reported value.
Modeled ILO estimates improve comparability but are not identical to every national survey release
The phrase “modeled ILO estimate” is important. The series is designed to provide internationally comparable labor-market estimates rather than simply reproducing one national survey table for each country. Modeling helps align countries that differ in data frequency and availability, but a modeled estimate may not be numerically identical to a national statistical office’s published survey figure for the same calendar year. For country-specific policy work, users should check the domestic definition and official survey release as well.
Modeled historical values can also be revised when new source information or model updates become available. That matters for trend analysis. A multi-year study is strongest when the whole time series is taken from the same data vintage instead of combining values downloaded at different times. The evidence used here is a 2025 cross-section, so it supports comparisons across countries at that point in time but not claims that a country’s rate is rising or falling.
What the map can show—and what it cannot
The dataset directly supports comparisons of the 2025 male youth NEET rate, the highest and lowest observations, the middle of the distribution, and the geographic spread of reported values. It does not reveal how long individuals remain NEET, their household income, education attainment, urban or rural residence, disability status, migration status, reasons for not working, willingness to work, or the quality of any previous employment. Those are separate analytical questions that require additional microdata or country-specific sources.
The map is therefore most useful as a screening tool. High-rate countries can be flagged for deeper investigation into education exits, training access and pathways into work. Low-rate countries can be examined to determine whether the result reflects high school enrollment, high employment, substantial training participation or some combination. The same headline percentage can be produced by different underlying structures, so the map should lead to questions rather than substitute for them.
The main 2025 pattern is a wide cross-country gap
The clearest result is the size of the cross-country spread: reported values range from 1.39% to 49.44%, while the median is 13.89%. Several economies are above 30%, yet several others are below 5%. That gap shows how differently males ages 15–24 are distributed between education, training, employment and the NEET category across countries. The indicator is especially informative when read alongside its definition, because the same map would be easy to misread if NEET were treated as a synonym for unemployment.
For practical comparison, use the map to see where high and low observations are located, the tables to check exact extremes, and the quartiles to understand whether a country is near the middle or in a tail of the distribution. Then, if the purpose is to explain causes or evaluate policy, add compatible indicators for overall youth NEET, female youth NEET, youth employment, unemployment and education participation for the same period. That keeps the descriptive result separate from explanations that this single series cannot establish.
Frequently Asked Questions
Is the male youth NEET rate the same as the youth unemployment rate?
No. The NEET rate uses the full male youth population ages 15–24 and counts those who are neither employed nor in education or training. Unemployment uses a labor-force denominator.
What age range does this indicator use?
Youth is defined as ages 15–24 for this series, and the denominator is the male youth population in that age range.
Were the 35 missing 2025 observations treated as zero?
No. Source-missing rows remain missing and are excluded from the mean, median, quartiles and rankings.
Related Articles
Green Map creates custom-edited map images using open geographic data sources such as geoBoundaries, Natural Earth, OpenStreetMap, and government open data.
These maps are edited visual materials, not raw data files, and are provided for education, documents, presentations, and graphic reference.