Female youth NEET rates differ far more across countries than a single global average can show. Among the 182 countries and reporting areas with a 2025 value in the World Bank series, the median is 21.25% and the simple mean is 23.31%. Afghanistan stands at 84.06%, followed by very high observations in Yemen at 68.66% and Pakistan at 56.60%. At the other end, Japan is 3.52%, Macao 3.55%, and the Netherlands 3.63%. The map therefore describes a wide spectrum of connection to school, work, and formal training among women ages 15–24.
NEET means “not in education, employment or training.” For this female series, the denominator is the entire female population ages 15–24. A young woman is counted in the numerator when she is not employed, not enrolled in education, and not taking part in formal training. That makes the measure broader than youth unemployment. A full-time student without a job is not NEET, while someone outside work, education, and training can be NEET even when she is not actively searching for a job.
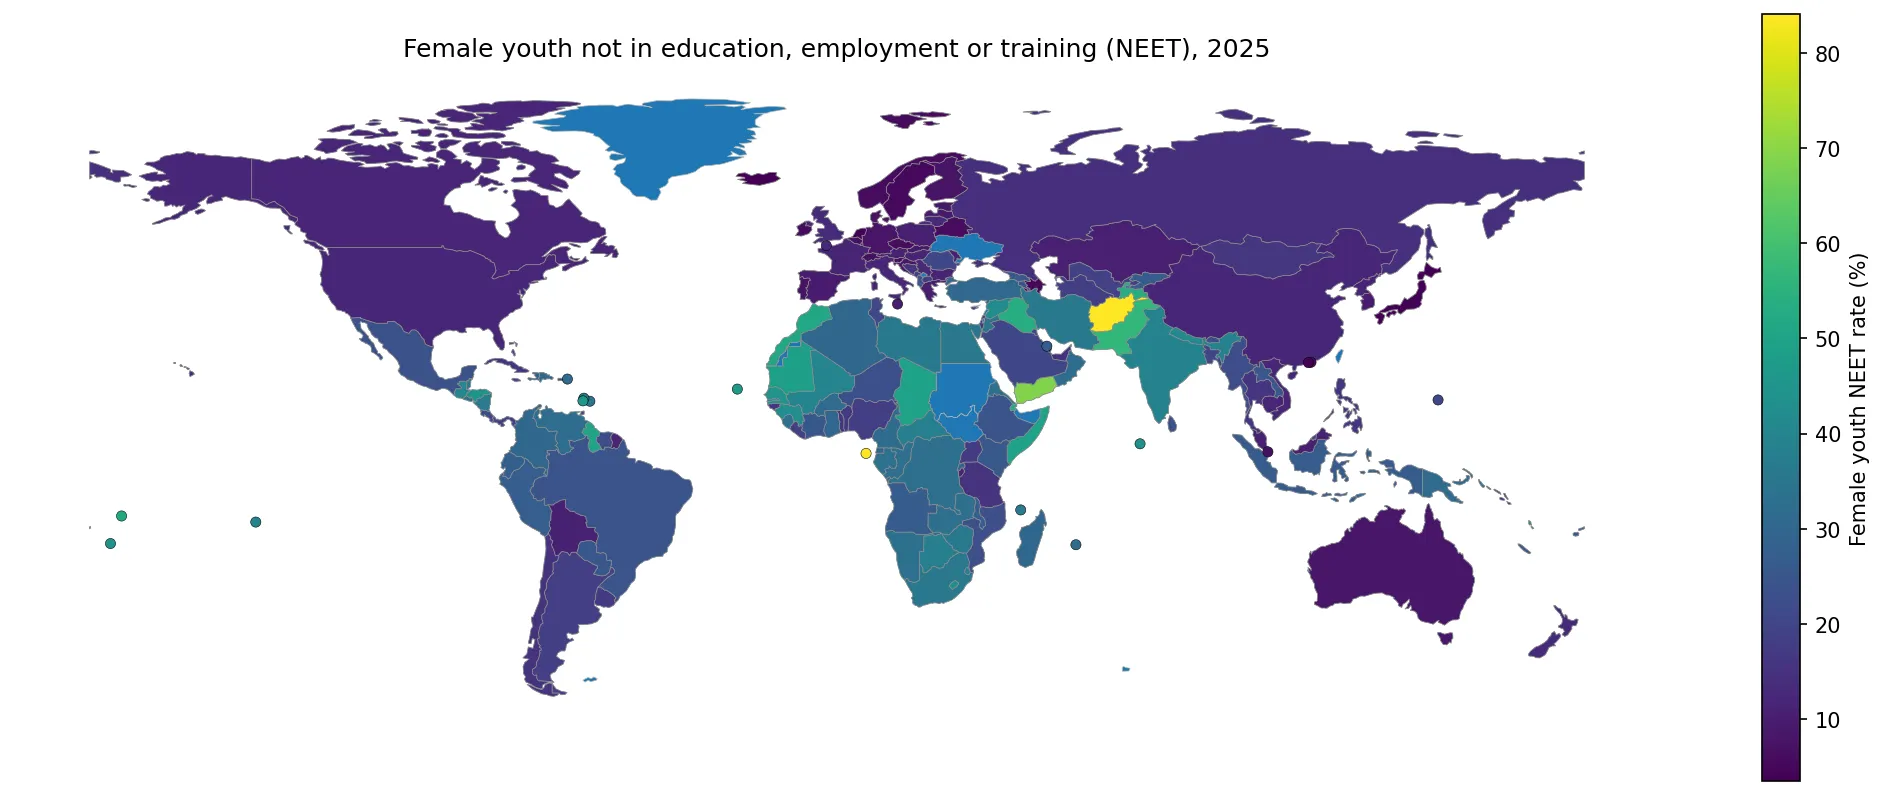
Table of Contents
The middle of the distribution is near 21%, but the range is exceptionally wide
The first quartile is 11.89% and the third quartile is 31.27%, so half of the valid observations fall between roughly 12% and 31%. Yet the full range stretches from 3.52% to 84.06%. The mean is above the median because a smaller set of very high observations pulls the average upward. These are unweighted country-level summaries; they are not a population-weighted NEET rate for all young women in the world.
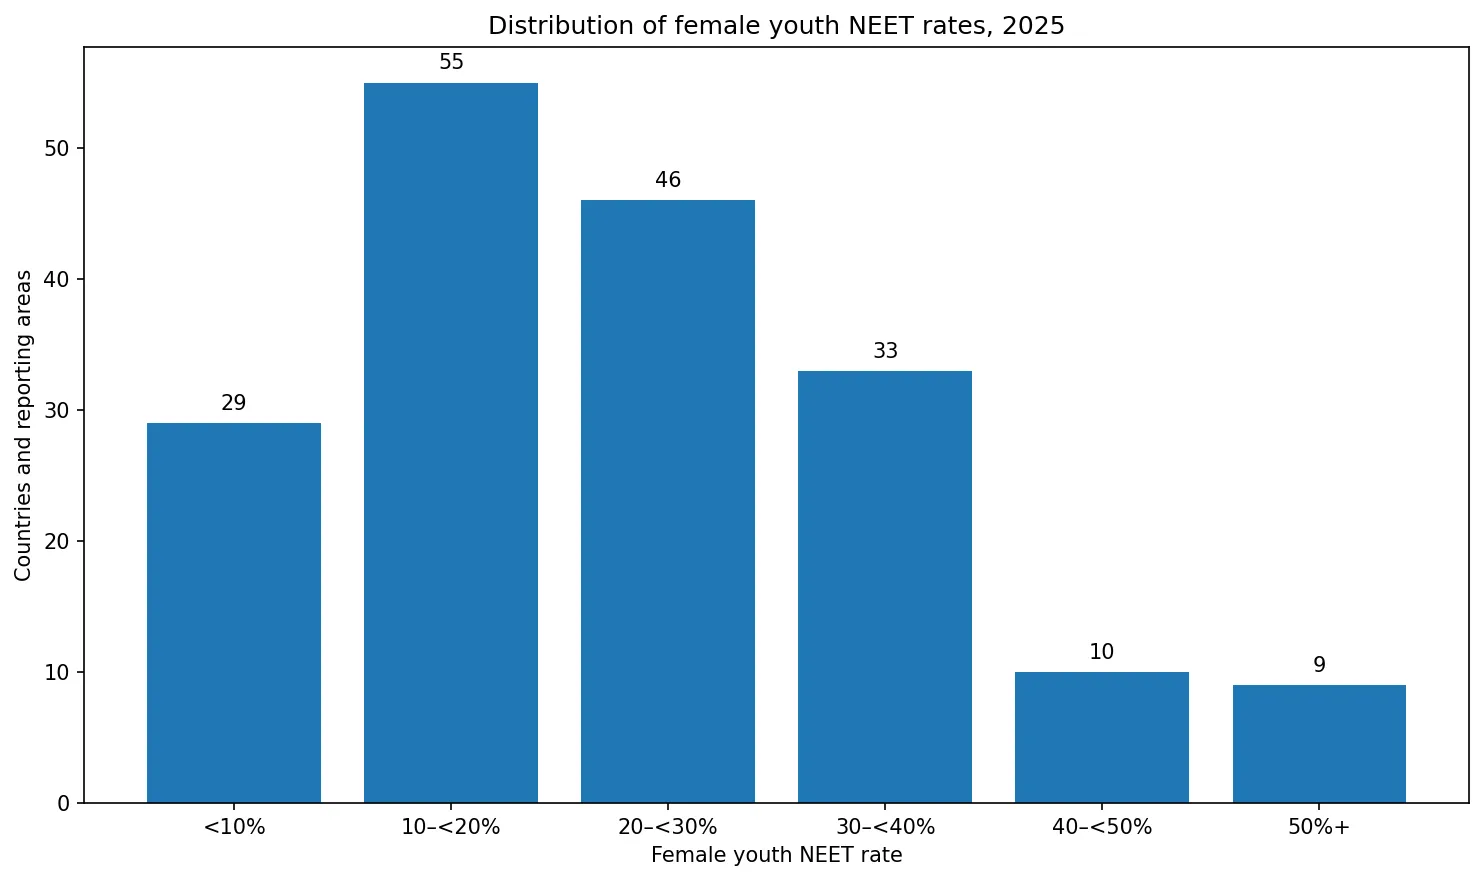
The largest band contains the 55 countries and areas between 10% and under 20%. Another 46 fall between 20% and under 30%. There are 29 below 10%, while 9 reach 50% or more. The middle is therefore substantial, but the tails matter: a meaningful group of countries sits at levels several times higher than the low-NEET group.
South Asia contains some of the highest 2025 observations
Afghanistan at 84.06% and Pakistan at 56.60% are at the upper end of the entire dataset. Nepal is 41.39% and India 39.57%, while Bangladesh at 20.10% and Sri Lanka at 22.75% are much lower. The differences within one broad region are large enough that a regional label alone is not a useful substitute for country-level data.
A high NEET rate does not identify a single cause. It can reflect barriers at the transition from school to work, limited job opportunities, family and care responsibilities, differences in training systems, or several forces at once. The indicator records the resulting status, not the reason for it. Causal claims require additional evidence on education participation, labor-force activity, employment, care, and household circumstances.
West Asia and North Africa show sharp contrasts between nearby economies
Yemen is 68.66%, Iraq 53.39%, and Morocco 51.49%, placing them near or above the 50% line. Tunisia is 21.09%, Saudi Arabia 20.79%, and the United Arab Emirates 13.94%. Those gaps are visible on the map even within neighboring parts of the broader region. They show why a single regional average can conceal substantially different youth transitions.
Low rates are common across much of Europe and parts of East Asia
The Netherlands is 3.63%, Sweden 5.13%, Norway 5.80%, and Germany 7.70%. France, Spain, and Italy also remain near the low teens or below. In East Asia, Japan records 3.52%, the lowest valid observation in the dataset, while Hong Kong is 5.10% and Singapore 5.46%.
Lower NEET rates mean a larger share of young women are connected to at least one of three systems: education, employment, or training. They do not directly measure pay, job security, working hours, educational quality, or whether a training program leads to a good job. Likewise, a higher NEET rate combines people with potentially very different circumstances. It is best treated as a broad indicator of disconnection rather than a complete measure of youth well-being.
Latin America also contains large country gaps
Honduras is 45.09% and Guatemala 40.51%, compared with Mexico at 23.82%. In South America, Colombia is 29.98%, Brazil 24.34%, Argentina 18.09%, and Chile 15.06%. The country map is useful here because the spread inside the region is larger than the headline label “Latin America” suggests.
A small comparison table shows the scale of the gap
The examples below are all from 2025. They are selected to show the breadth of the distribution, not to create a league table from a modeled series.
| Country | Female youth NEET rate | Position in the distribution |
|---|---|---|
| Afghanistan | 84.06% | Highest valid observation |
| Pakistan | 56.60% | Above 50% |
| Morocco | 51.49% | High North African example |
| Honduras | 45.09% | High Central American example |
| India | 39.57% | 30% to under 40% |
| Brazil | 24.34% | 20% to under 30% |
| Chile | 15.06% | 10% to under 20% |
| Germany | 7.70% | Below 10% |
| Japan | 3.52% | Lowest valid observation |
NEET and unemployment answer different questions
The unemployment rate focuses on people in the labor force who do not have a job but are available for and seeking work. NEET uses the entire youth population as its denominator and adds an education-and-training condition. A young woman outside work who is still in school is not NEET. A young woman outside work, school, and training may be NEET even if she is not actively searching for a job and therefore is not classified as unemployed.
For a fuller picture, NEET should be read alongside the female youth employment-to-population ratio, labor-force participation, unemployment, enrollment, completion, and training indicators. Those measures separate education participation from labor-market attachment and help explain why two countries can post similar NEET rates for very different reasons.
Data source and mapping method
The statistical source is the World Bank World Development Indicators series Share of youth not in education, employment or training, female (% of female youth population) (modeled ILO estimate), indicator code SL.UEM.NEET.FE.ME.ZS. The comparison uses only rows dated 2025. Out of 217 country and area rows, 182 contain a numeric value and 35 remain source-missing.
ISO-3 codes were joined to a simplified world boundary layer. A total of 163 valid observations match country polygons, while 19 small or separately reported statistical areas without a usable polygon at that scale are shown as point markers. Missing values are not zero-filled. The mean, median, quartiles, and distribution bands are simple unweighted summaries across the 182 valid observations.
The ILO notes that modeled estimates can combine reported observations with imputed values for missing country-years. Imputed observations have substantial uncertainty and should not be treated as if they were directly observed data or used for fine country rankings. The map is therefore most useful for broad differences and geographic patterns. Detailed country assessment should be checked against the latest national labor-force survey and ILOSTAT country data.
Frequently Asked Questions
What does a female youth NEET rate of 21% mean?
It means about 21 of every 100 women ages 15–24 are not in education, employment, or training. The denominator is the full female youth population, not only people in the labor force.
Are all young women counted as NEET unemployed?
No. NEET includes young women outside education, work, and training whether or not they are actively looking for a job. Some therefore fall outside the usual unemployment definition.
Are all mapped values from 2025?
Yes. The map and summary statistics use 182 observations dated 2025. Thirty-five source-missing rows remain missing instead of being treated as zero.
Why avoid precise rankings with modeled ILO estimates?
Modeled series can include imputed values when direct observations are incomplete. Those values carry uncertainty, so broad differences are more informative than ordering countries separated by small gaps.
Related Articles
Youth NEET Rate by Country – Ages 15–24 in 2025
Global Employment-to-Population Ratio Map – Ages 15+ in 2025
Labour Force Participation Rate 2025
Green Map creates custom-edited map images using open geographic data sources such as geoBoundaries, Natural Earth, OpenStreetMap, and government open data.
These maps are edited visual materials, not raw data files, and are provided for education, documents, presentations, and graphic reference.