Hancock County lies east of Indianapolis, and its map is easiest to understand by starting with Greenfield. U.S. 40 runs east-west through the city, State Road 9 crosses it north-south, and Interstate 70 passes a short distance to the north. You can download a high-resolution JPG ZIP from this page when you need larger road labels, creek names, terrain colors, or printable originals. This Hancock County Indiana Map page also shows how McCordsville and Fortville sit in the northwest, New Palestine lies to the southwest, and the land rises noticeably toward the eastern side of the county.
The county does not have one simple visual pattern. Roads concentrate attention around Greenfield and the western side, while the water map is divided among Buck Creek, Sugar Creek, Brandywine Creek, several smaller eastern streams, and the Big Blue River near the southeast. The elevation view adds an especially clear east-west contrast: low green terrain covers much of the west, while yellow and brown high ground expands toward the eastern boundary. Those three relationships—roads, drainage, and relief—make it possible to recognize the same places even when each map emphasizes different information.
The city index adds another useful comparison. Greenfield carries the largest value printed on the supplied city map, while McCordsville and Fortville form a separate northwest group. Cumberland touches the western side, New Palestine is farther south, and Shirley is isolated near the east. These positions matter more than memorizing the printed numbers because they show that Hancock County’s larger communities are spread across several corridors rather than arranged along a single straight line.
Table of Contents
Greenfield is the clearest road reference, where U.S. 40 meets State Road 9
On the general county map, Greenfield is the easiest place to use as a reference point. U.S. 40 crosses the city from west to east, linking the Cumberland side of the county with communities and roads farther east. State Road 9 runs north-south through Greenfield and continues toward Maxwell and Eden in the northern half. Once those two roads are located, the rest of the county becomes much easier to organize: McCordsville and Fortville are northwest, New Palestine is southwest, and Shirley is near the eastern edge.
Interstate 70 provides a second east-west line north of Greenfield. It enters from the western side and continues across the county, separated from U.S. 40 by a broad band of local roads, creeks, and open space. That separation is important because it prevents the central road network from looking like one single corridor. Travelers or map readers can use I-70 for the northern central section and U.S. 40 for the Greenfield corridor without confusing the two.
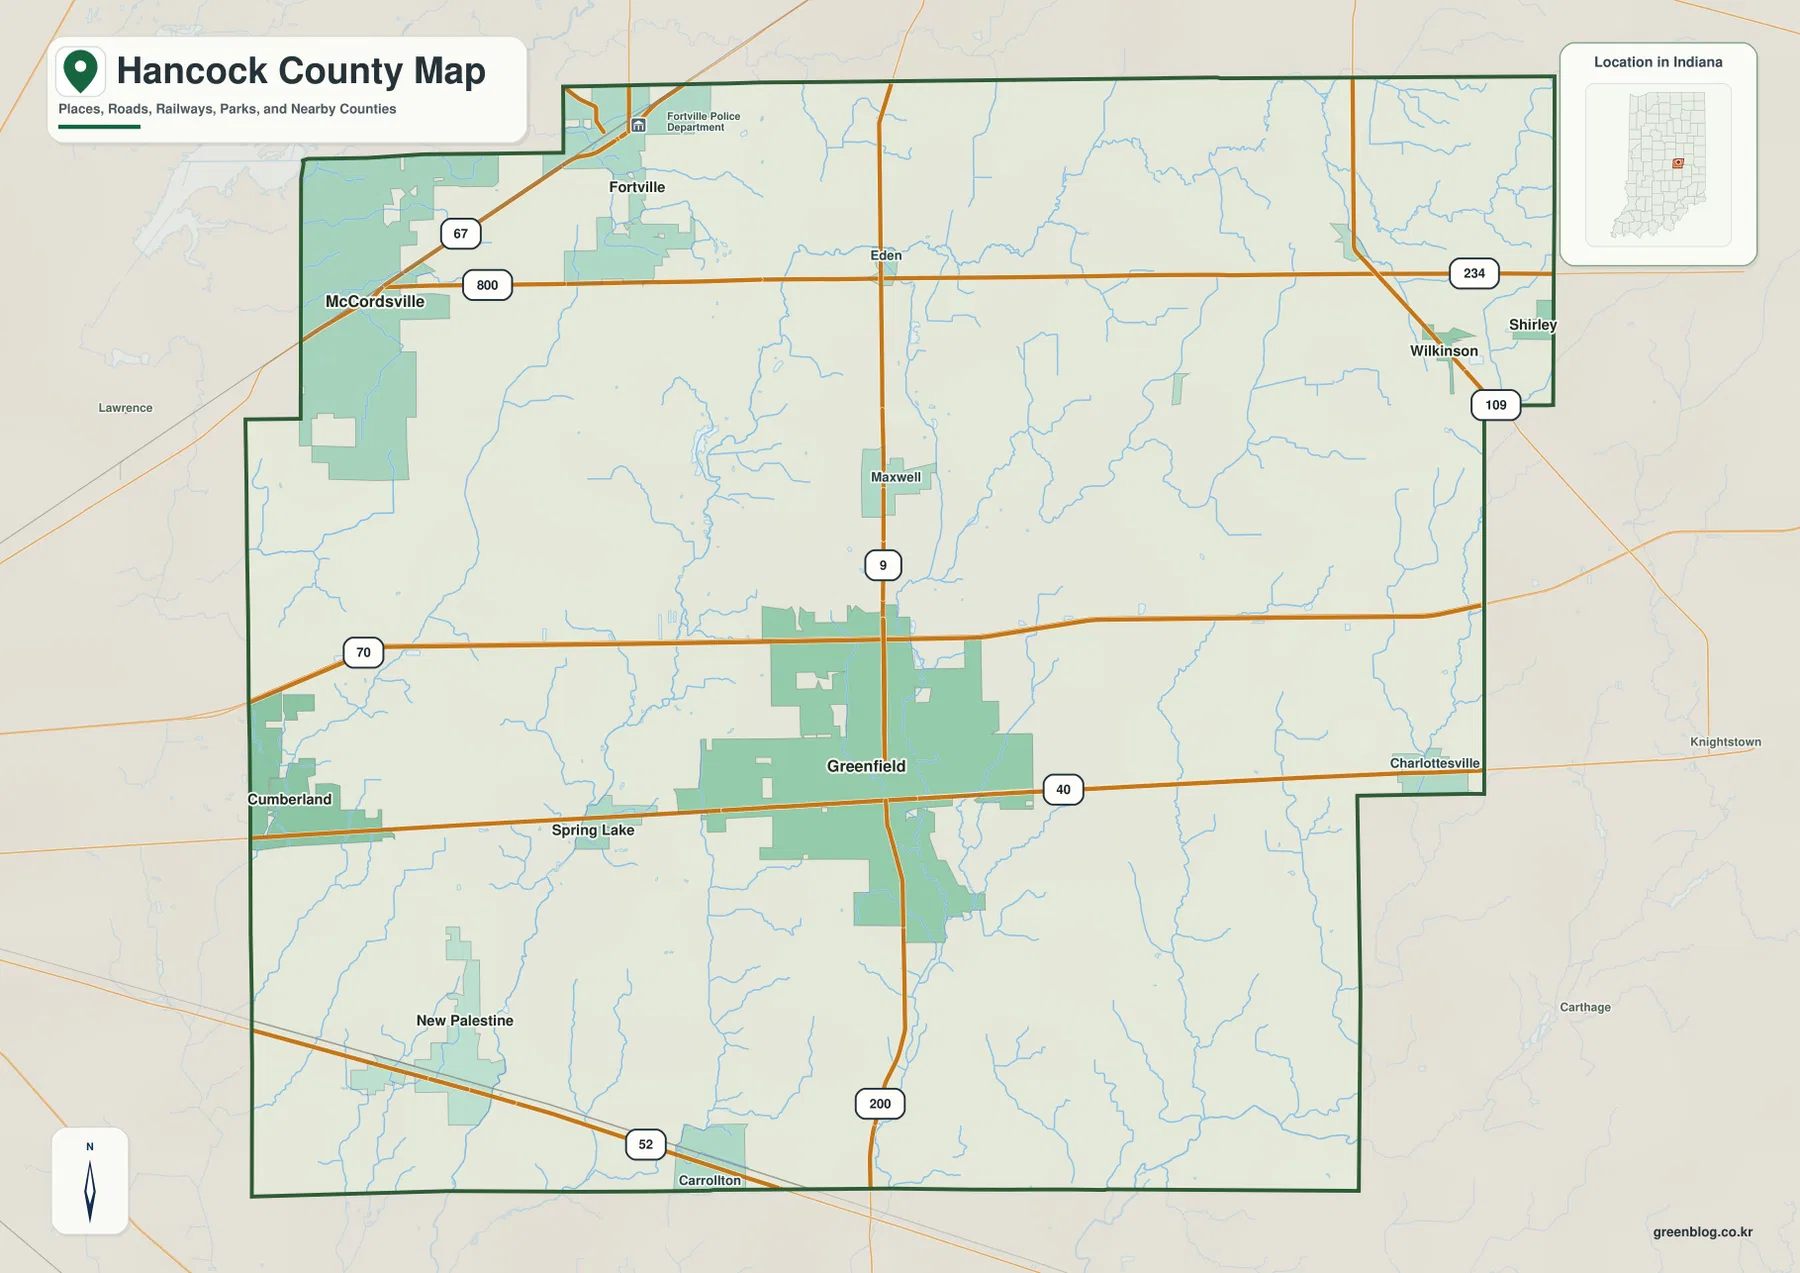
North of I-70, State Road 234 crosses the county from west to east and passes near the Shirley side of the map. In the northwest, State Road 67 and Road 800 appear near McCordsville and Fortville. This part of Hancock County has a different road pattern from Greenfield because the two northwest communities sit close to the county’s irregular upper-left boundary rather than near the central north-south line of State Road 9.
The southwest has yet another orientation. U.S. 52 runs diagonally near New Palestine, while Road 200 extends south from the Greenfield area. Cumberland appears along the western edge close to the U.S. 40 corridor, and Spring Lake is labeled between Cumberland and Greenfield. These features are useful when the goal is to distinguish the southwest from the northwest: New Palestine is associated with the diagonal U.S. 52 route, while McCordsville and Fortville are grouped much farther north.
The eastern boundary is more irregular than the long western and southern edges. Shirley and Wilkinson sit near the northeast and east, and Charlottsville is labeled farther south near the U.S. 40 side. The county outline steps inward on the southeast, so the shape itself becomes a useful clue when comparing Hancock County with neighboring areas. The general map is the best place to see that boundary shape together with roads and place names.
The city index separates central Greenfield from the northwest and southwest communities
The city map simplifies the road network and highlights six places with values printed directly on the supplied image. Greenfield is ranked first at 24,940. McCordsville follows at 10,329, Cumberland at 6,267, Fortville at 4,976, New Palestine at 3,227, and Shirley at 1,022. These figures are best treated as the map’s city-index values rather than as a guarantee of the newest population estimates. For map reading, their main value is showing how the highlighted communities differ in both size and position.
| Rank | City | Value printed on map | Position |
|---|---|---|---|
| 1 | Greenfield | 24,940 | South-central / central |
| 2 | McCordsville | 10,329 | Northwest |
| 3 | Cumberland | 6,267 | Western edge |
| 4 | Fortville | 4,976 | Northwest |
| 5 | New Palestine | 3,227 | Southwest |
| 6 | Shirley | 1,022 | East |
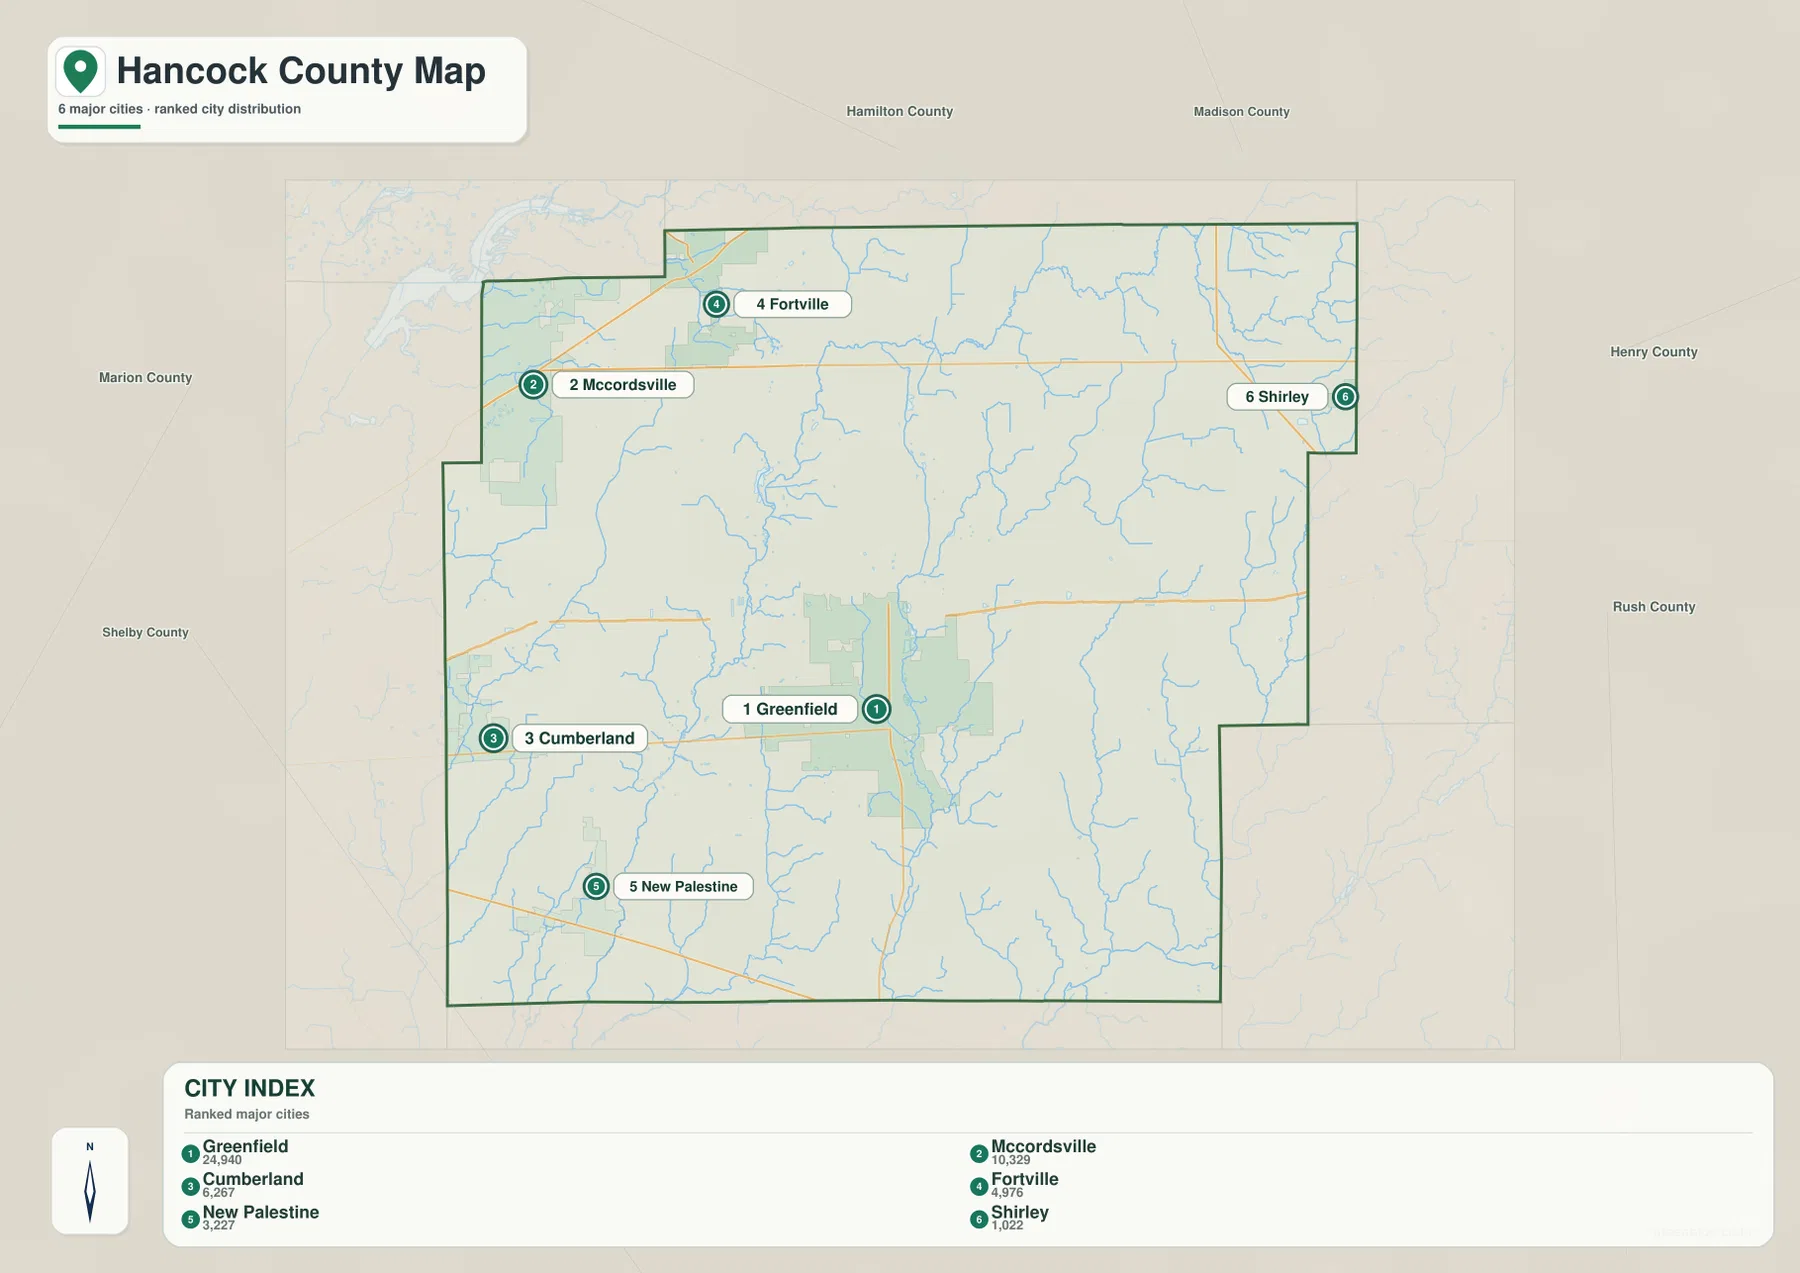
The distribution is not a simple center-versus-edge pattern. McCordsville and Fortville are close to each other in the northwest, but they are clearly separated from Greenfield. Cumberland sits on the west side along the U.S. 40 approach, while New Palestine lies farther south and closer to the U.S. 52 corridor. Shirley is the eastern outlier among the six highlighted places. That arrangement gives Hancock County several distinct settlement reference points instead of one continuous chain of cities.
The general map also contains place names that do not appear in the six-city index, including Maxwell, Eden, Wilkinson, and Charlottsville. Their absence from the index does not mean they are absent from the county; it only reflects the shorter list used on that particular map. When the goal is to find every labeled settlement or trace a route between places, return to the general map. When the goal is to compare the six highlighted locations, the city index is cleaner.
Greenfield is also identified by Hancock County’s official website as the county seat in Center Township. That administrative fact fits the map’s visual structure, where Greenfield is both centrally located and crossed by important roads. It should not be read as proof that every county function or travel pattern is centered there, but it explains why Greenfield is such a practical starting point for understanding the rest of the map.
Sugar Creek and Brandywine Creek divide the center, while the Big Blue River reaches the southeast
The terrain-and-water map replaces most road labels with streams, small lakes, and subtle relief. Buck Creek is a major reference on the western side, running through a broad section of the county. Sugar Creek appears farther east in the north-central area and bends through several smaller tributaries. These two waterways are useful for separating the northwest and central portions of Hancock County before moving south toward the Brandywine system.
Brandywine Creek runs through the central part of the county and continues south, while Little Brandywine Creek lies nearby as a separate branch. Roberts Lake is labeled close to this central drainage area. Farther west, Lake Potomac and Spring Lake form two small water landmarks, and Wilson Ditch appears below them. The map does not show one dominant lake; instead, it shows a network of creeks, ditches, and small water bodies spread across a relatively broad landscape.
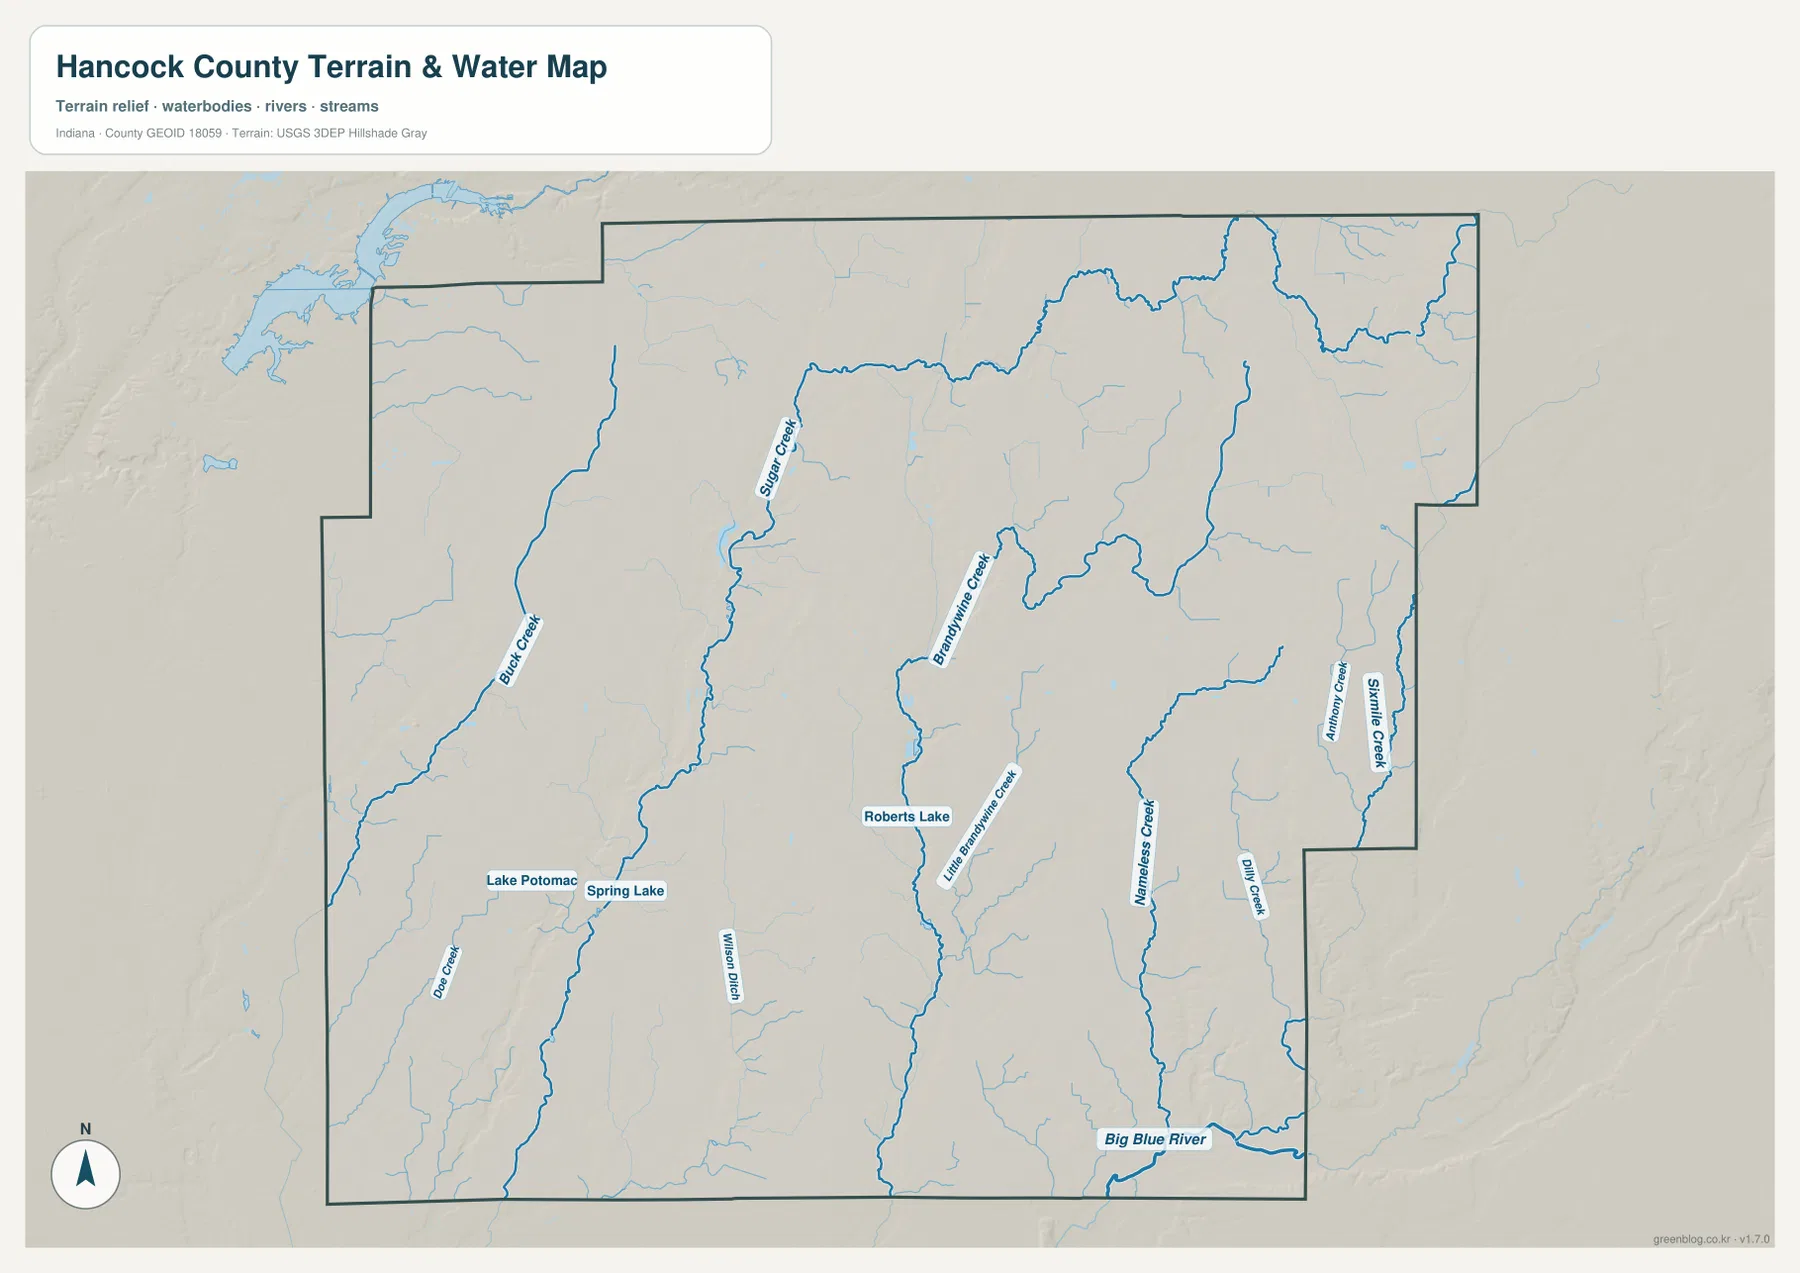
The eastern half has its own set of named streams. Nameless Creek runs through the east-central to southeastern part of the county, while Anthony Creek and Sixmile Creek are closer to the eastern boundary. Dry Creek is labeled farther south. At the bottom-right, the Big Blue River follows the southeast side as a much broader watercourse than the smaller interior creeks. Together, these names make the eastern half easier to recognize even when city labels are removed.
The water map is a location reference, not a flood-risk or legal-boundary product. A mapped blue line does not establish a floodplain, current water level, navigability, water quality, or property ownership. Those questions require current information from agencies such as FEMA, USGS, the state, or local authorities. On this page, the water view is most useful for seeing where the major creeks lie relative to Greenfield, the eastern high ground, and the southeast river corridor.
Elevation rises from the western lowlands toward the eastern edge across a 240–316 m range
The elevation map has one of the strongest visual patterns in the set. Its legend gives an actual county range of about 240 to 316 meters and a mean of 271 meters. Greens mark lower terrain, while yellow, tan, and brown indicate progressively higher ground. Most of the western side appears green, but the color shifts steadily through the center and becomes much warmer toward the eastern boundary. The result is a clear west-to-east rise that is difficult to appreciate from the road map alone.
The western low area is not perfectly flat. Creeks cut narrow lower corridors through it, and subtle ridges appear between those channels. Buck Creek and several smaller drainage lines can be matched to darker or lighter green grooves on the relief surface. Near the center, the Sugar Creek and Brandywine Creek valleys continue that pattern. The elevation map therefore works best beside the water map, because many of the linear low areas become easier to identify once the stream names are known.
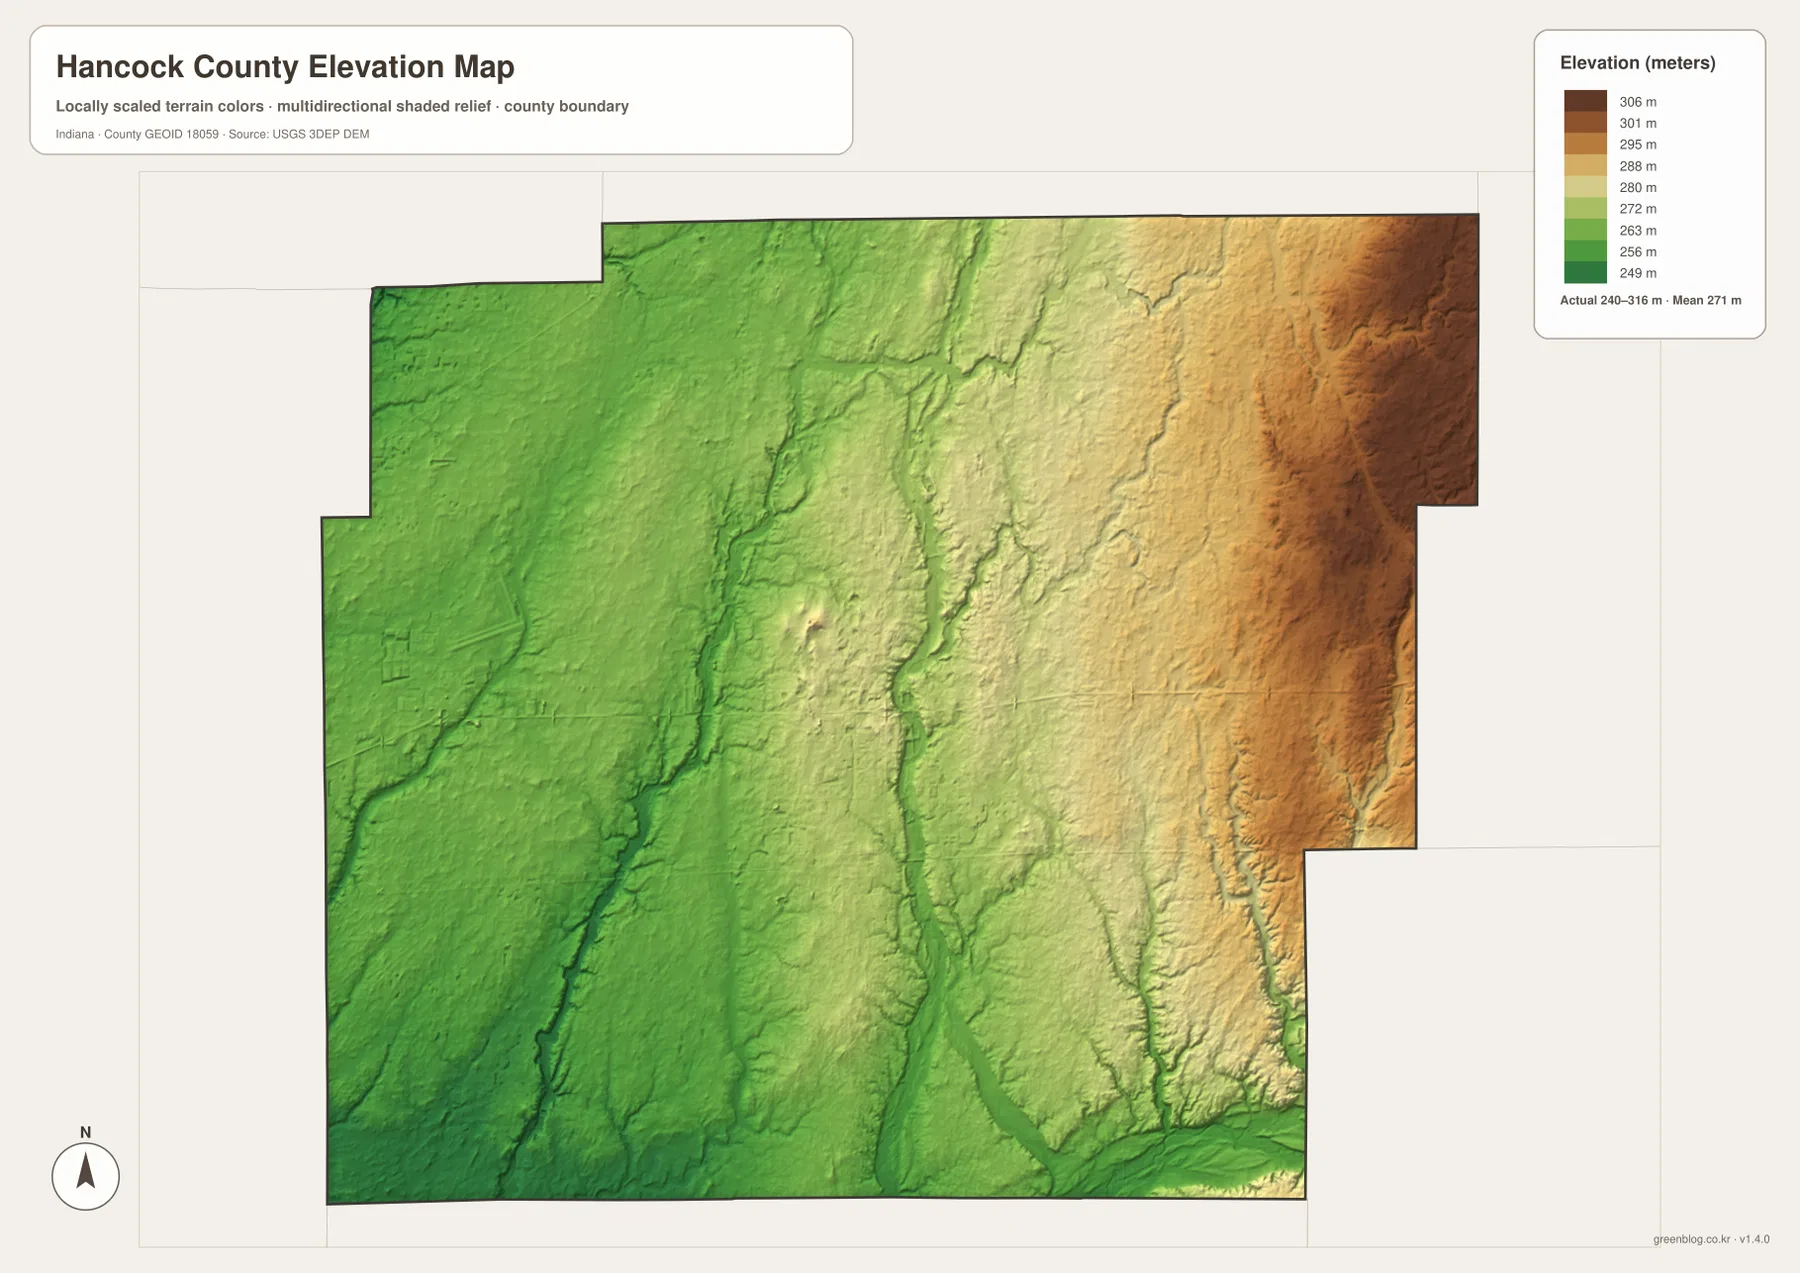
The highest-looking terrain is concentrated near the eastern and northeastern edges, where brown colors cover a broad area. If you compare that view with the general map, the Shirley and Wilkinson side of the county lies in this higher zone. The southeast is more complicated because the Big Blue River and its tributaries cut lower channels through the otherwise elevated eastern terrain. That combination of high background ground and low river valleys gives the east side more relief than a simple “higher than the west” description might suggest.
Greenfield occupies a middle portion of this west-to-east transition rather than the absolute lowest or highest area. The city’s location should not be explained by elevation alone; roads, development history, infrastructure, and land use also matter. The purpose of this map is narrower and more useful: it shows which parts of the county are relatively high or low and how stream valleys cut through that broader surface.
The 240–316 m range is also not a parcel-level survey. A house site, drainage plan, road grade, or engineering project requires source elevation data or professional surveying. The USGS 3D Elevation Program is a better starting point for precise terrain information. For ordinary county-scale reading, the supplied image is well suited to comparing the low west, the central creek valleys, and the higher east.
Use the road map for orientation, then switch to water or elevation for the landscape
If the question begins with “Where is this place?”, start with the general county map. It has the broadest selection of place names, road numbers, and the county outline. Greenfield, McCordsville, Fortville, New Palestine, Shirley, Cumberland, Maxwell, Eden, Wilkinson, and Charlottsville can all be located there. The combination of U.S. 40, I-70, State Road 9, State Road 234, and U.S. 52 makes it possible to connect those places without relying on the city index.
If the question is “How do the highlighted cities compare?”, use the city index. Greenfield stands out with the largest printed value, McCordsville and Fortville form a northwest pair, and New Palestine and Shirley occupy very different corners of the county. The index is intentionally selective, so it should not replace the general map when a smaller community is missing.
For creeks and rivers, the terrain-and-water map is the better view. Start with Buck Creek, Sugar Creek, and Brandywine Creek, then move east to Nameless Creek, Sixmile Creek, and the Big Blue River. Place the elevation map beside it to see how those channels sit within the west-to-east rise. A green valley on the relief surface often becomes much easier to identify once the creek name is visible on the water map.
The web previews are optimized for quick viewing, so the smallest labels may be hard to read on a phone or reduced browser window. The downloadable archive contains the county/general, city index, terrain-and-water, and elevation maps as 3638×2572-pixel JPG originals. Downloading the ZIP is the better option when you want to zoom into labels, compare maps side by side, print them, or keep a local copy for reference.
A practical way to use the set is to follow one location across several views. Find Greenfield and State Road 9 on the general map, locate nearby Brandywine and Sugar Creek drainage on the water map, and then check the same central area on the elevation surface. Repeat the process with Shirley on the east side or New Palestine in the southwest. The repeated comparison turns separate images into a more complete picture of Hancock County without asking any one map to provide information it was not designed to show.
Frequently Asked Questions
What is the easiest road reference for finding Greenfield?
Look for the intersection of U.S. 40 and State Road 9. U.S. 40 runs east-west through Greenfield, while State Road 9 runs north-south. Interstate 70 passes just to the north, so those three routes provide a quick frame of reference for the city. From there, Cumberland is west, McCordsville and Fortville are northwest, New Palestine is southwest, and Shirley is to the east.
Which waterways stand out on the supplied Hancock County map?
Buck Creek is a major western reference, Sugar Creek crosses the north-central area, and Brandywine Creek and Little Brandywine Creek occupy the center. Farther east, Nameless Creek, Anthony Creek, Sixmile Creek, and Dry Creek are labeled, while the Big Blue River becomes the strongest water feature near the southeast edge. Lake Potomac, Spring Lake, and Roberts Lake are also shown as smaller water bodies.
Can the 240–316 m elevation range be used as the exact height of a property?
No. The legend describes the county-wide range shown on the supplied elevation map, with a mean of 271 m. The image is designed to compare broad high and low areas, such as the lower western side and the higher eastern terrain. Exact property, construction, drainage, or engineering elevations should come from source elevation data or professional survey work.
Map File Information
This ZIP contains the Hancock County general map, city index map, terrain-and-water map, and elevation map as high-resolution JPG originals for enlarged viewing and printing.
- File Type: ZIP containing four 3638×2572px JPG files
Related Maps
Sources and References
The article is based primarily on the supplied Hancock County map set and asset manifest. The following official and public sources provide additional county context and underlying boundary, hydrography, and elevation references.
- Hancock County, Indiana – About – official county background and government information
- Hancock County – Greenfield – official county page identifying Greenfield as the county seat
- U.S. Census Bureau TIGER/Line Shapefiles – boundary and geographic reference data
- USGS National Hydrography – hydrography reference data
- USGS 3D Elevation Program – elevation source data
Green Map creates custom-edited map images using open geographic data sources such as geoBoundaries, Natural Earth, OpenStreetMap, and government open data.
These maps are edited visual materials, not raw data files, and are provided for education, documents, presentations, and graphic reference.