The share of merchandise imports sourced from low- and middle-income economies in East Asia and the Pacific reveals a very different pattern from the size of a country’s total import bill. In the World Bank series TM.VAL.MRCH.R1.ZS, all 205 country and area observations in this dataset are dated 2023. The unweighted median is 18.24% and the simple mean is 20.25%. The middle half of observations lies between about 9.54% and 25.99%. These percentages describe where merchandise imports come from, not how much a country imports in dollar terms.
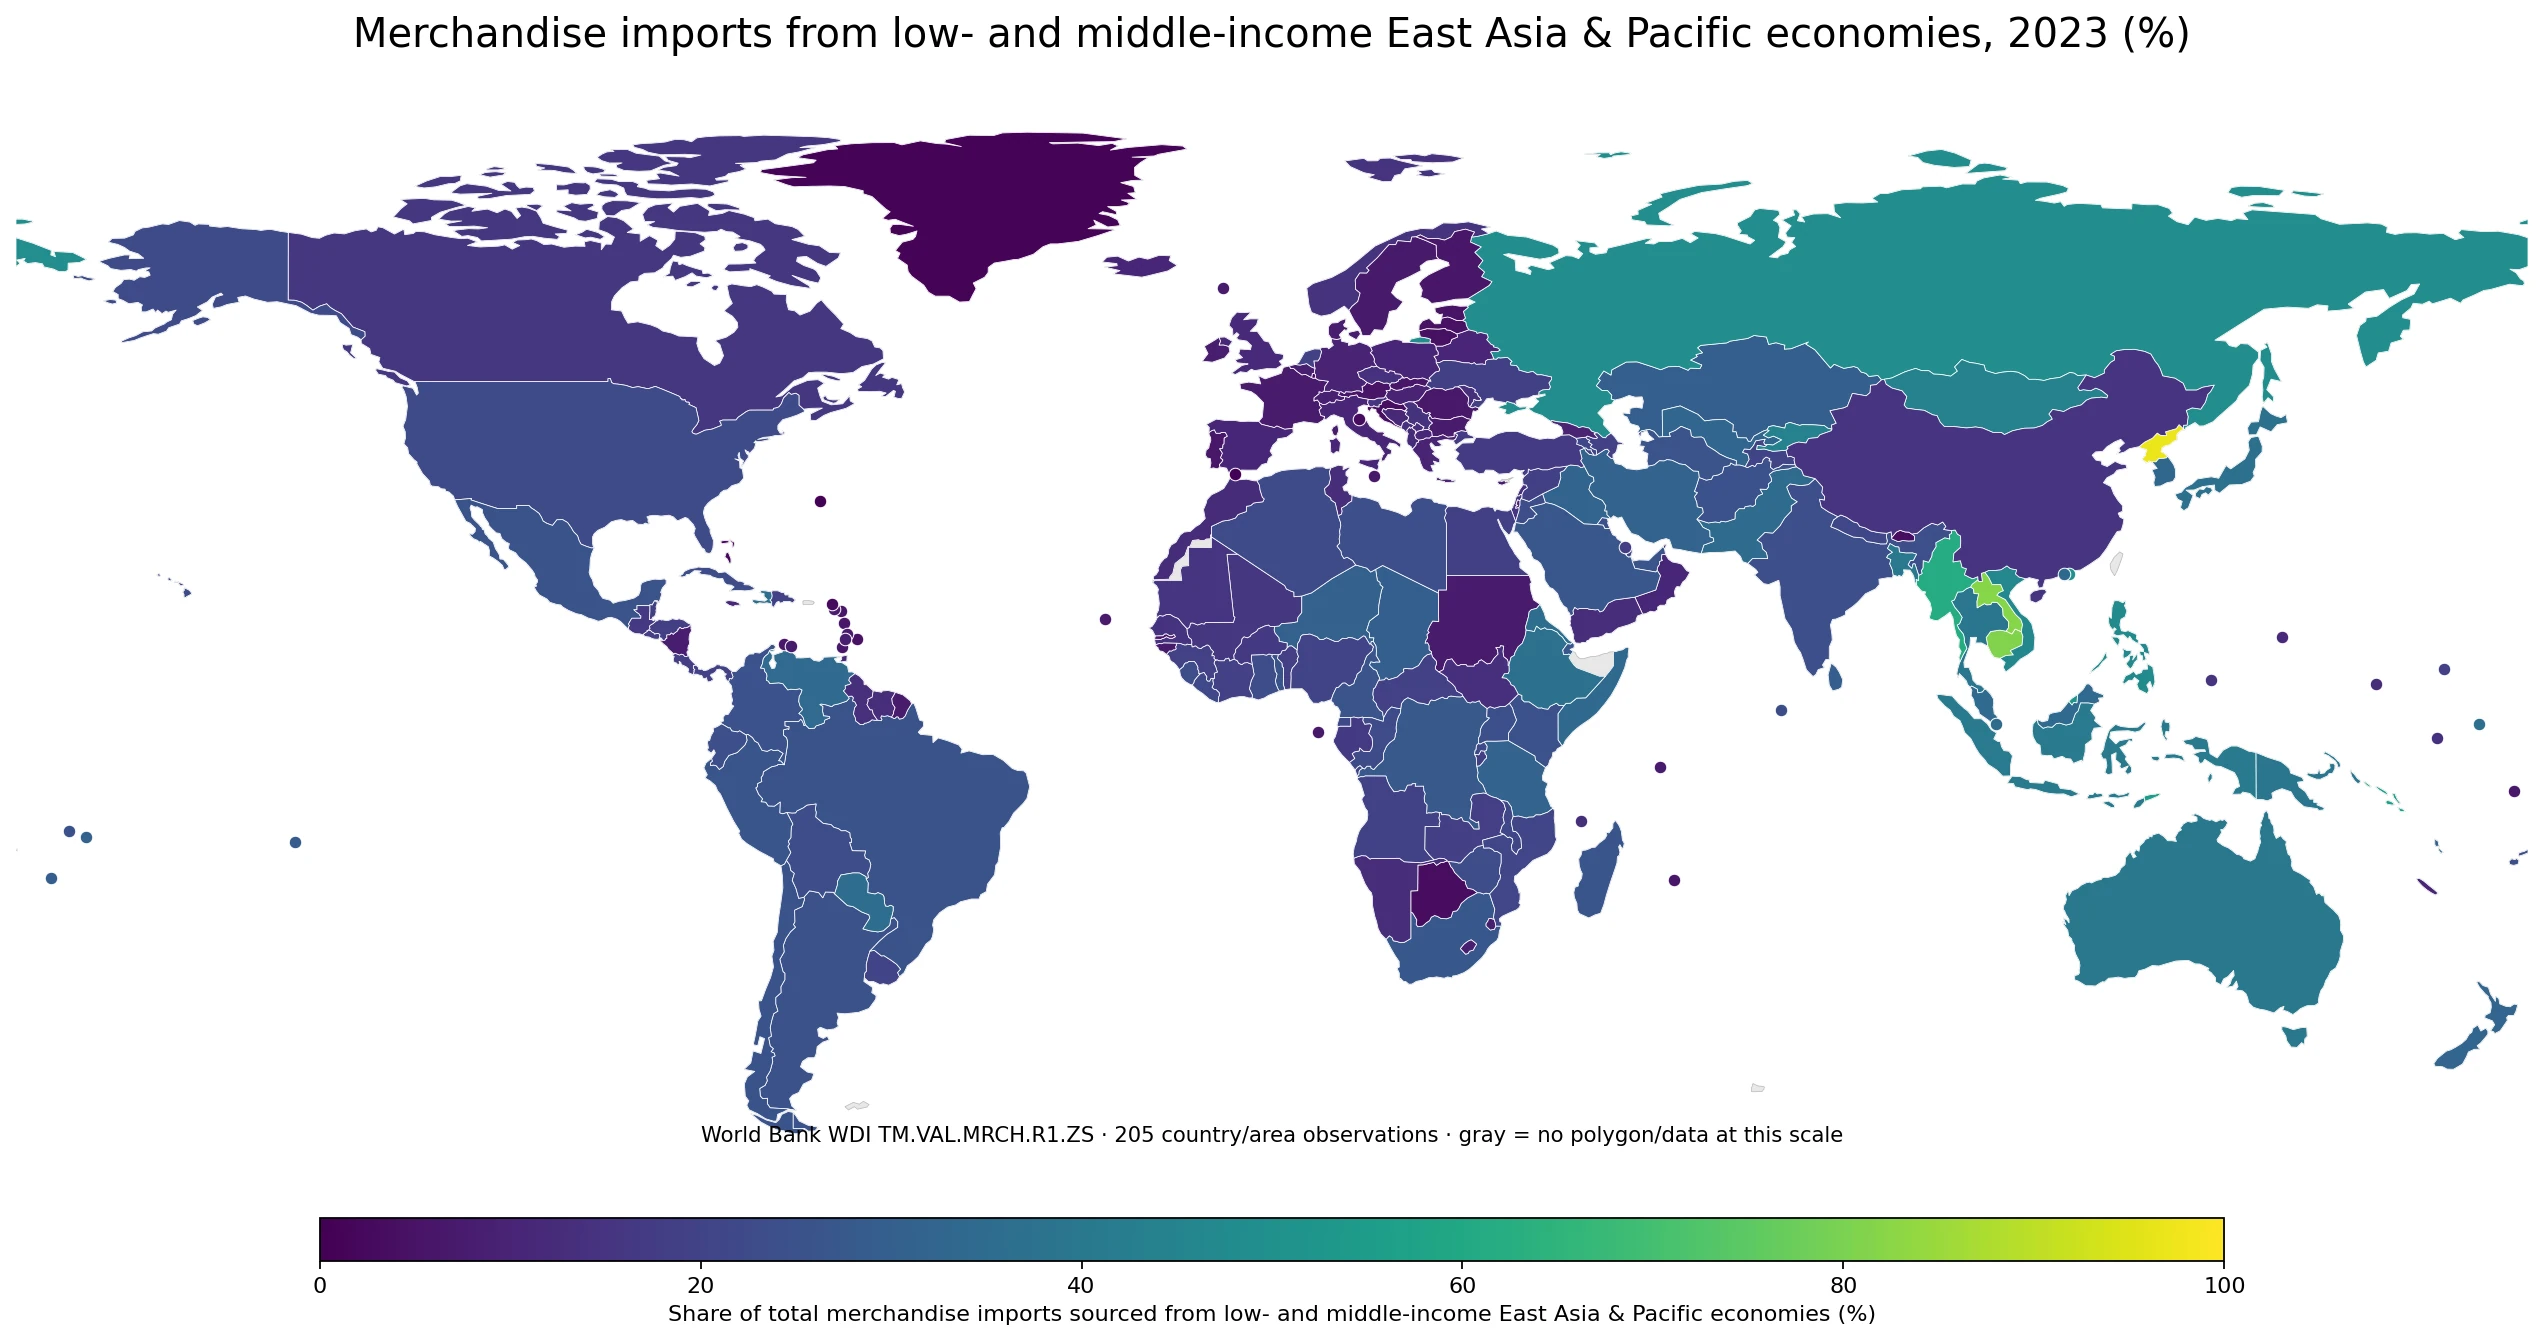
Table of Contents
The indicator covers a partner-income group, not all of East Asia and the Pacific
World Bank indicator TM.VAL.MRCH.R1.ZS measures merchandise imports by the reporting economy from low- and middle-income economies in the East Asia and Pacific region, expressed as a percentage of the reporting economy’s total merchandise imports. The distinction matters: the numerator is not imports from every economy located in East Asia and the Pacific. It includes the partner economies that fall into the World Bank low- and middle-income group used for this series, while high-income partners in the same broad region are outside that numerator.
A value of 30% therefore means that roughly 30% of the reporting economy’s merchandise import value came from that defined East Asia and Pacific partner group during the year. The denominator is total merchandise imports. It is not GDP, it does not include services imports, and it is not the trade balance. A country can have a high percentage with a modest import bill, or a lower percentage while importing a very large amount in absolute dollars.
The World Bank metadata identifies the series as World Bank staff estimates based on the IMF Direction of Trade database. It also states that the group measure is computed only when at least half of the economies in the partner-country group have non-missing data. That makes the percentage a structured partner-group indicator with a documented availability rule rather than an ad hoc regional total.
The same-year 2023 median is 18.24% across 205 observations
The strongest feature of this dataset is temporal consistency. Every retained observation is from 2023, so the map, rankings, quartiles, and distribution bands can be compared without mixing different reference years. The simple mean is 20.25%, slightly above the median of 18.24%. The first quartile is 9.54% and the third quartile is 25.99%, showing that half of all observations fall within a range of roughly sixteen and a half percentage points.
| 2023 share of merchandise imports | Countries/areas |
|---|---|
| Below 10% | 53 |
| 10% to <20% | 64 |
| 20% to <30% | 47 |
| 30% to <40% | 27 |
| 40% to <60% | 10 |
| 60% or more | 4 |
The largest group is 10% to under 20%, with 64 observations. Another 53 are below 10%, meaning that 117 of the 205 observations are below 20%. Forty-seven fall between 20% and 30%, while 27 are between 30% and 40%. Only 14 observations are at least 40%, and only four exceed 60%. The distribution therefore has many low and moderate shares plus a small upper tail of very high regional sourcing shares.
Four observations exceed 60%
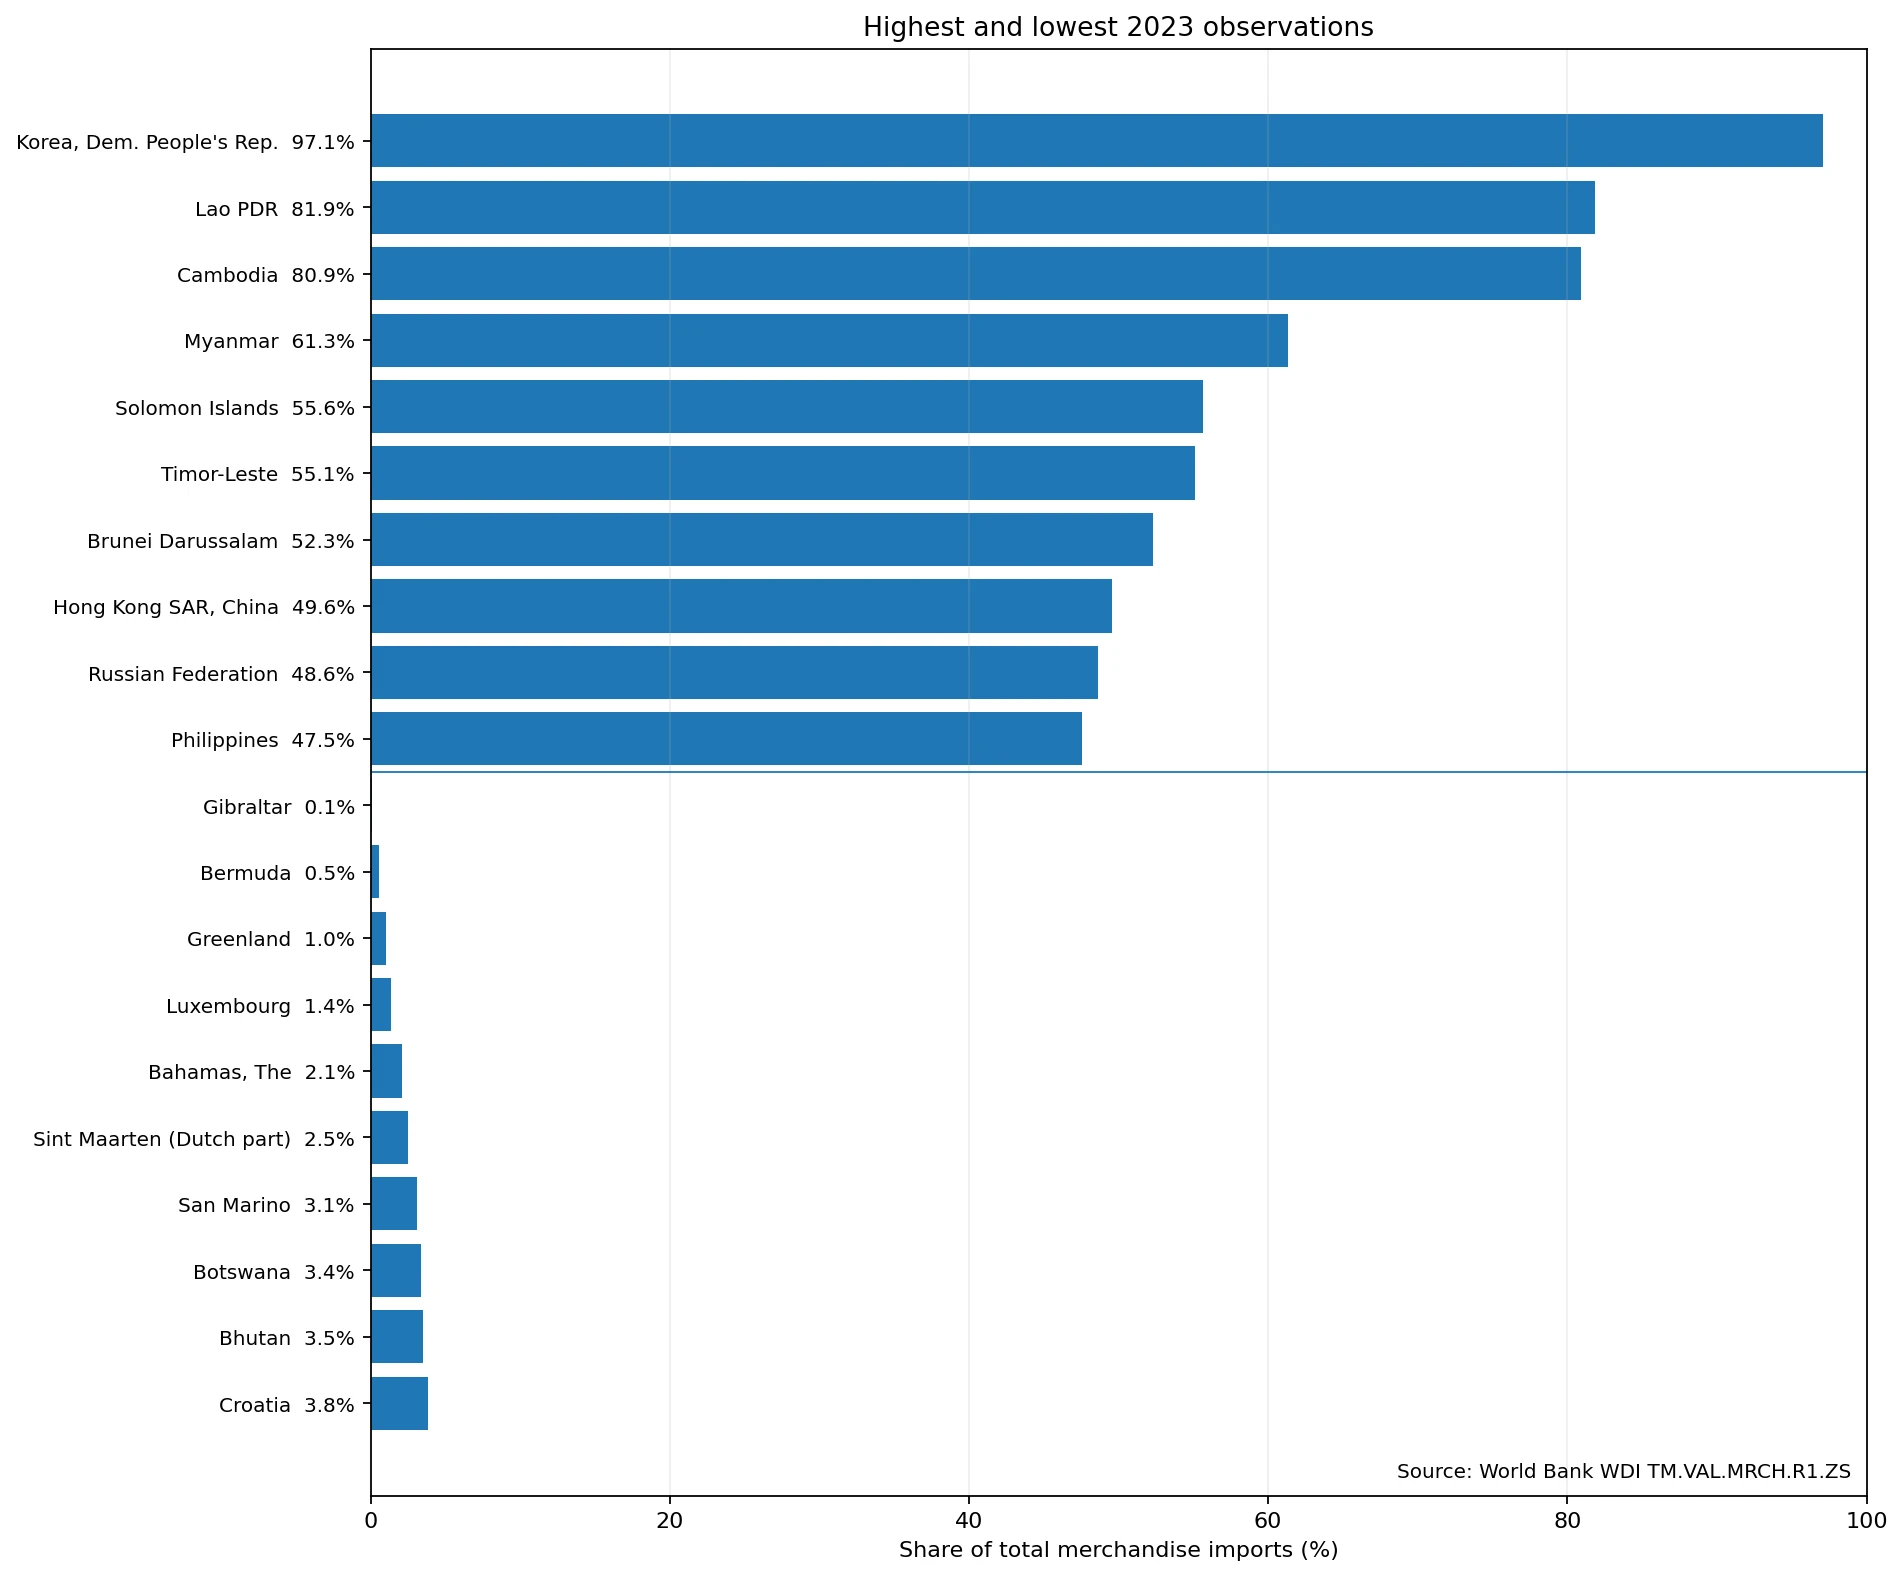
The highest observation is 97.10%. It is followed by Lao PDR at 81.87%, Cambodia at 80.93%, and Myanmar at 61.35%. They are followed by Solomon Islands at 55.63%, Timor-Leste at 55.09%, Brunei Darussalam at 52.27%, Hong Kong SAR at 49.57%, the Russian Federation at 48.60%, and the Philippines at 47.53%. The upper end contains several economies located inside or close to East Asian and Pacific production and trading networks, but the Russian value shows that a high share is not limited to reporting economies inside the region.
A high value should not automatically be described as dependence on one country. The numerator aggregates a group of low- and middle-income partner economies, not a single supplier. The indicator does not reveal which products dominate the flows, how many partner countries account for the total, whether critical inputs are concentrated, or how easily suppliers could be substituted. Those questions require bilateral and product-level trade data. Here, the defensible interpretation is regional and income-group sourcing composition.
The lowest shares are mostly well below 5%
At the low end, Gibraltar records 0.07%, Bermuda 0.55%, Greenland 1.04%, Luxembourg 1.37%, and The Bahamas 2.11%. Sint Maarten is 2.50%, San Marino 3.09%, Botswana 3.36%, Bhutan 3.49%, and Croatia 3.83%. Several European high-income economies also sit near or below 10%, including Austria at 5.19%, Finland at 5.89%, France at 7.27%, Denmark at 8.07%, Belgium at 8.31%, and Germany at 9.40%.
A low share does not mean that merchandise imports are small. It means that this particular partner group supplies a small part of total merchandise imports. An economy may import heavily from nearby high-income partners, from North America, from Europe, or from other developing regions and therefore post a low TM.VAL.MRCH.R1.ZS value despite a large overall import market. This is why the series is best read as a composition measure rather than an import-intensity measure.
Southeast Asia forms a broad high-share cluster, but neighboring values still differ sharply
The map shows a strong concentration of higher values across Southeast Asia. Lao PDR is 81.87%, Cambodia 80.93%, Myanmar 61.35%, the Philippines 47.53%, Viet Nam 46.29%, Indonesia 41.11%, Thailand 39.25%, Malaysia 34.20%, and Singapore 34.44%. Brunei Darussalam is higher at 52.27%. The cluster is visible, yet the range from the mid-30s to above 80% shows that geographic proximity does not produce one uniform import-sourcing pattern.
Northeast Asia and Oceania are also mixed. Japan is 36.59%, Australia 39.96%, and China 15.21%. China’s lower share relative to several neighbors should not be interpreted as evidence of a smaller regional trade volume. The denominator is each reporting economy’s total merchandise imports, while the numerator is imports from a defined low- and middle-income partner group. Different global supplier mixes can therefore generate very different percentages inside the same broad region.
Europe contrasts with that Southeast Asian cluster. The Russian Federation is high at 48.60%, but Germany is 9.40%, France 7.27%, the United Kingdom 11.60%, Italy 10.32%, and Spain 10.82%. In North America, the United States is 22.61%, Canada 15.81%, and Mexico 25.70%. Distance, production networks, commodity demand, logistics, market size, and trade agreements may all be relevant in particular cases, but this cross-section alone cannot identify which factor causes any individual value.
Selected large economies show why this is a sourcing-composition measure
| Reporting economy | 2023 share |
|---|---|
| Australia | 39.96% |
| Japan | 36.59% |
| Mexico | 25.70% |
| Brazil | 25.58% |
| India | 23.65% |
| United States | 22.61% |
| Canada | 15.81% |
| China | 15.21% |
| United Kingdom | 11.60% |
| Germany | 9.40% |
| France | 7.27% |
Because every value in the table refers to 2023, the differences do not come from mismatched observation years. Australia and Japan are in the high 30s, several large economies are in the 20s, Canada and China are around 15%, and major Western European economies are near or below 10%. Yet the dollar amount represented by the same percentage can differ enormously. Twenty percent of a trillion-dollar import market is not comparable in absolute scale with twenty percent of a much smaller market.
The percentage is not a supply-chain risk score or a competitiveness ranking
Regional sourcing concentration can matter for supply-chain analysis, but this indicator is not designed as a risk index. It contains no information about product criticality, inventories, transport routes, supplier concentration within the partner group, contract substitutability, tariffs, sanctions, or lead times. A 50% share can be spread across many countries and many ordinary consumer goods, or it can be concentrated in a few inputs; the aggregate percentage cannot distinguish those situations.
The same caution applies to competitiveness. Imports and exports answer different questions, and the trade balance requires subtracting imports from exports. A reporting economy can source a large share of imports from this partner group while also exporting heavily elsewhere. Another economy can have a low sourcing share but a very large absolute import bill. Assessing external exposure requires combining this series with total import value, bilateral partner shares, product-level trade, and time-series evidence.
A synchronized 2023 map improves comparability, but the income classification still matters
All 205 observations are from the same year, which makes geographic comparison much cleaner than a latest-value map assembled from multiple years. The colors can be read as differences in 2023 sourcing composition. However, the words “low- and middle-income economies” are part of the statistical definition. They refer to the World Bank classification used for the partner group, not to a permanently fixed geographic list. Long-run comparisons should therefore check classification and metadata rather than assuming that partner-group membership is unchanged forever.
The visualization also contains both countries and some territories or areas. The low-resolution Natural Earth layer matches 169 observations as polygons. The remaining 36 small countries or areas are added as point markers so that their statistical values are not silently dropped. Missing or unrendered polygons are not filled with zero. For exact decimal comparisons, the underlying values and tables are more appropriate than judging close values by color alone.
Data source and calculation method
The source is the World Bank World Development Indicators series TM.VAL.MRCH.R1.ZS. World Bank metadata defines it as merchandise imports from low- and middle-income economies in East Asia and the Pacific as a percentage of the reporting economy’s total merchandise imports, and cites World Bank staff estimates based on the IMF Direction of Trade database. The 205 observations used here are all dated 2023 and contain no missing metric values.
The mean, median, quartiles, distribution bands, and rankings are calculated by giving each country or area row equal weight. The 20.25% mean is therefore not a statement that 20.25% of all merchandise imports worldwide came from this partner group. Computing that global trade-weighted share would require weighting each reporting economy by its actual merchandise import value. The statistics here summarize the distribution of country and area percentages.
Frequently Asked Questions
Does this percentage cover imports from all East Asia and Pacific economies?
No. It covers merchandise imports from the low- and middle-income economies in the World Bank East Asia and Pacific partner group, divided by total merchandise imports of the reporting economy.
Does a higher share mean a country imports more merchandise in dollars?
No. The measure is a composition percentage. Absolute import value requires a separate merchandise-import series.
Are all 205 observations from the same year?
Yes. Every observation used in this comparison is dated 2023, so the cross-country map does not mix reference years.
Can the indicator be used as a supply-chain risk score?
No. It does not measure product criticality, supplier concentration inside the partner group, inventories, transport routes, or substitution options.
Related Articles
Trade as a Share of GDP in 2025 compares total goods-and-services trade with GDP rather than examining the geographic source of merchandise imports.
Exports as a Share of GDP in 2025 measures the scale of exports relative to domestic output, which is different from the import-partner composition measured here.
Services Trade as a Share of GDP focuses on cross-border services flows and excludes merchandise trade.
Green Map creates custom-edited map images using open geographic data sources such as geoBoundaries, Natural Earth, OpenStreetMap, and government open data.
These maps are edited visual materials, not raw data files, and are provided for education, documents, presentations, and graphic reference.