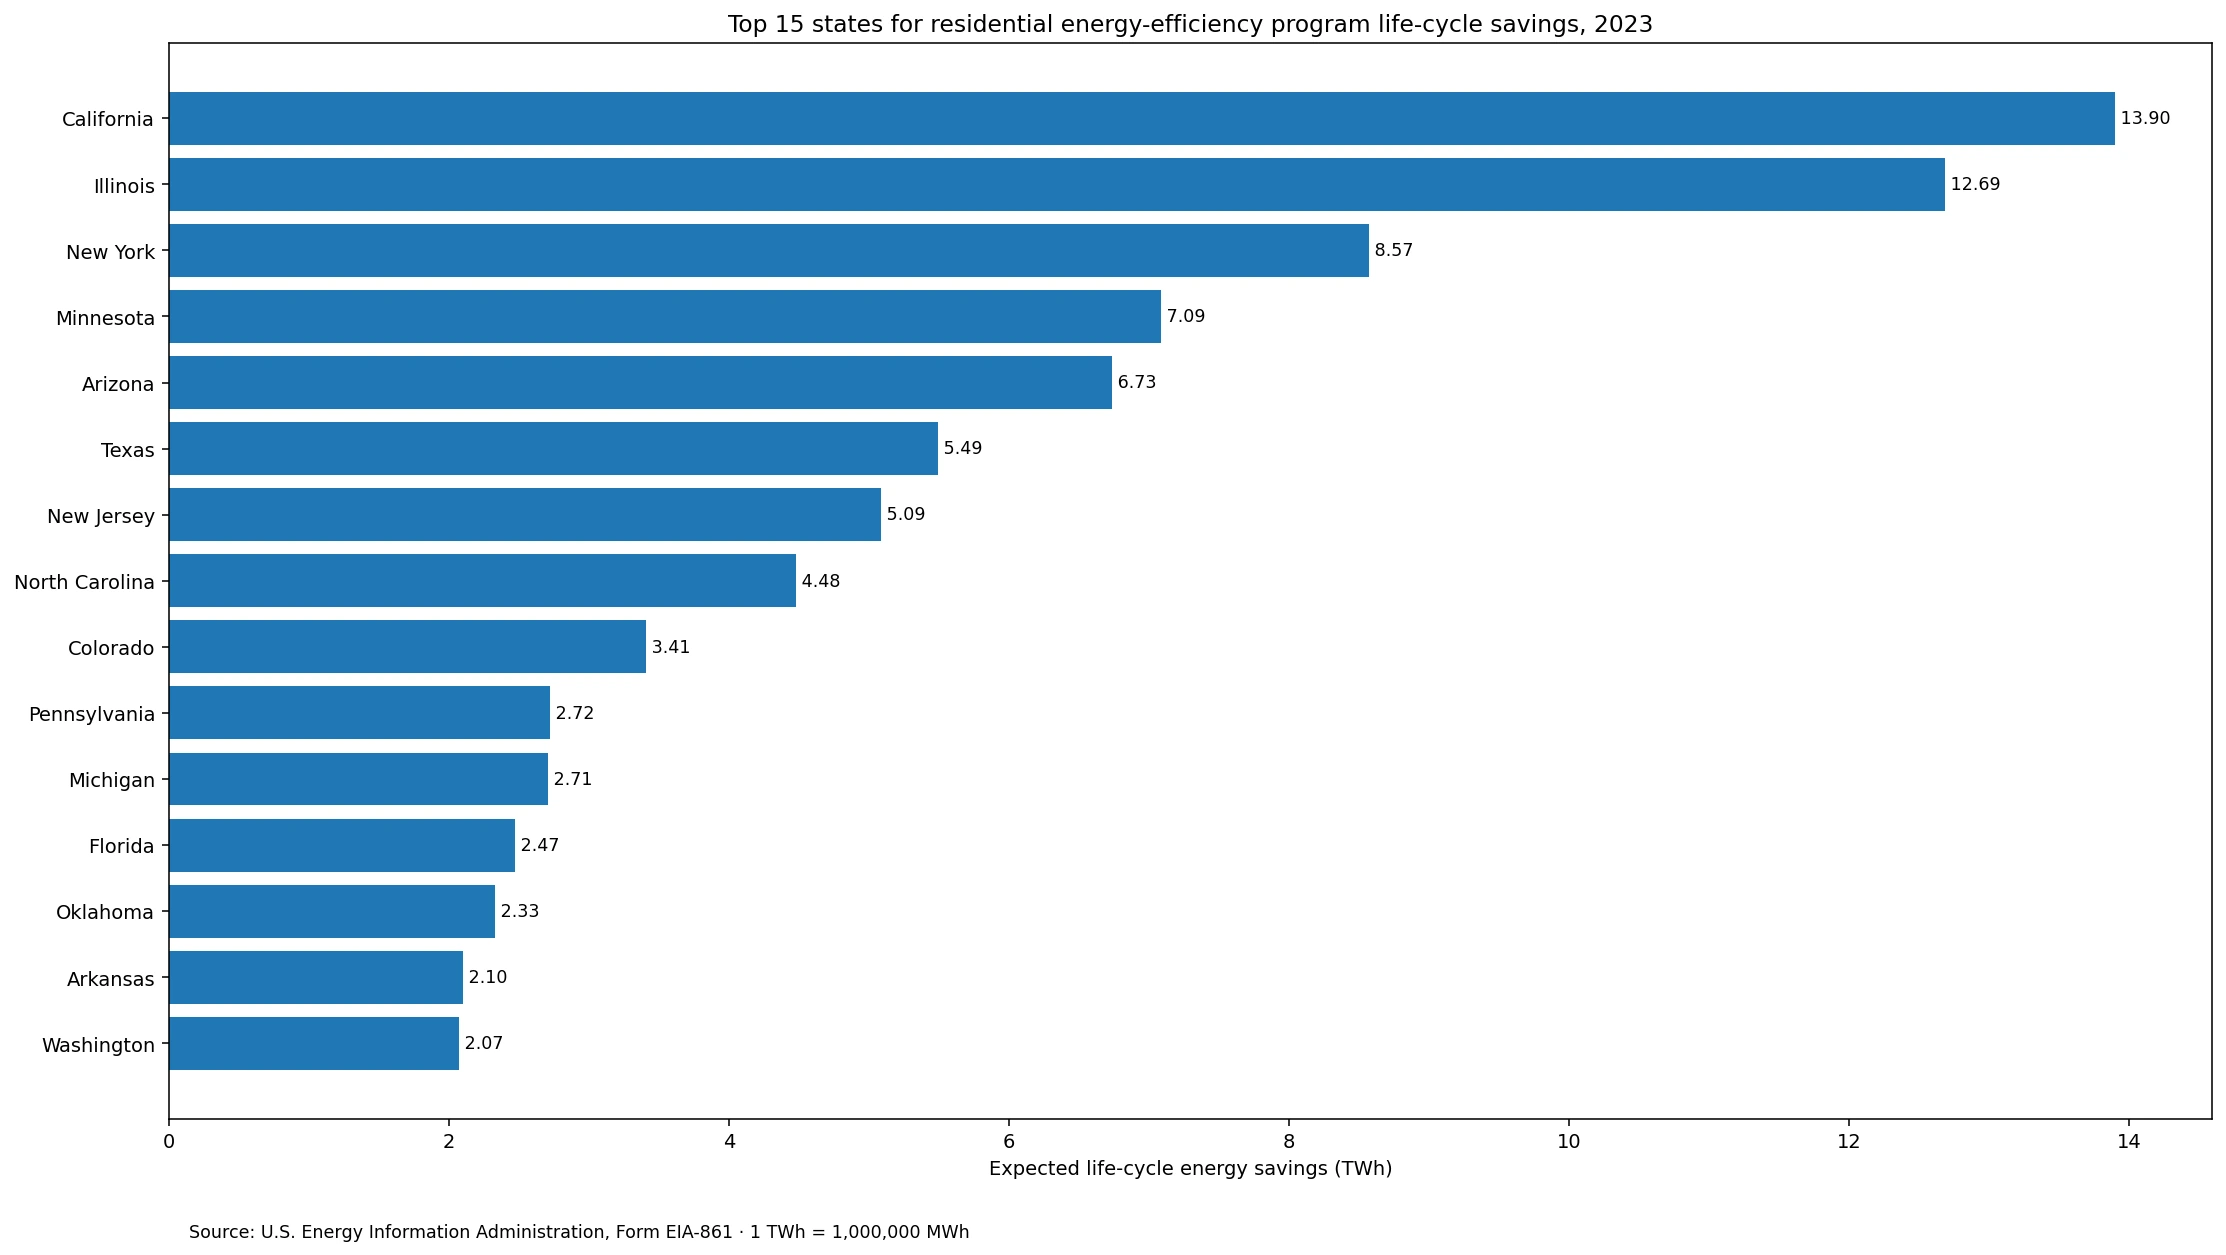
The 2023 state data for residential energy-efficiency programs show a highly uneven distribution of expected life-cycle electricity savings. Under the U.S. Energy Information Administration (EIA) State Electricity Profiles filters Residential + Expected Life Cycle of Programs + Energy Savings, California is highest at 13,898,915 MWh. Illinois follows at 12,688,372 MWh, with New York at 8,574,808 MWh. Adding the 50 states and the District of Columbia gives 101,341,592 MWh, or about 101.342 TWh.
The wording requires care. The API frequency is annual and the reporting year is 2023, but the time-period facet is Expected Life Cycle of Programs. This series should therefore not be described as electricity saved only during calendar year 2023. It represents expected energy savings over the life cycle of the residential energy-efficiency programs associated with the 2023 reporting slice. A reporting-year-only comparison would require the separate Reporting Year series.
Table of Contents
What this EIA metric actually measures
EIA collects energy-efficiency program information through Form EIA-861. Electricity energy-efficiency programs are intended to reduce the energy needed by end-use devices and systems while continuing to provide the desired service. Energy savings are reported in megawatthours, while peak-demand savings are a separate measure reported in megawatts. The series used here is the MWh energy-savings measure, not the MW peak-demand measure.
The sector filter is Residential, so these values do not combine commercial, industrial, and transportation programs. They describe the reported expected life-cycle energy savings associated with residential energy-efficiency programs. A large absolute state value does not automatically mean that households in that state are the most efficient, that electricity rates are lower, or that the program delivers the highest savings per dollar. Absolute totals can be affected by program scale, the number of participating customers, the size of the residential electricity market, reporting coverage, and program lifetimes. Those explanatory variables are not contained in this one state series.
California and Illinois account for more than one-quarter of the state sum
California contributes 13.7% of the 51-jurisdiction sum, while Illinois contributes 12.5%. Together they account for 26.2%. New York ranks third at 8.575 TWh, Minnesota fourth at 7.086 TWh, and Arizona fifth at 6.734 TWh. The top five jurisdictions together represent 48.3% of the sum.
Expanding the group to the top ten raises the cumulative amount to 70.176 TWh, or 69.2% of all 51 observations. The top fifteen account for 80.8%. This means 10 jurisdictions, only 19.6% of the jurisdictions in the dataset, account for roughly 69% of the reported expected life-cycle residential energy savings. The distribution is therefore concentrated rather than close to an even state-by-state allocation.
The mean is about 1.99 TWh, while the median is about 0.97 TWh
The arithmetic mean is 1,987,090 MWh (1.987 TWh), while the median is 972,622 MWh (0.973 TWh). The mean is about 2.0 times the median, another sign that the largest state values pull the average upward. The first quartile is 184,588 MWh and the third quartile is 2,215,090 MWh. Using the mean alone as a description of a typical state would therefore overstate the center of this skewed distribution.
| Savings band | Jurisdictions |
|---|---|
| 100,000 MWh or less | 7 |
| Over 100,000 to 500,000 MWh | 17 |
| Over 500,000 to 1 million MWh | 2 |
| Over 1 to 2 million MWh | 10 |
| Over 2 to 5 million MWh | 8 |
| Over 5 to 10 million MWh | 5 |
| Over 10 million MWh | 2 |
All 51 jurisdictions have numeric observations, and none is zero or missing. Alaska is the smallest positive value at 641 MWh, followed by North Dakota at 899 MWh and Kansas at 1,980 MWh. At the other end, California and Illinois both exceed 10 million MWh. The difference between the upper and lower tails is large enough that rankings should always be read with the actual quantities, not merely as ordinal positions.
Complete 2023 ranking for all 51 jurisdictions
The table below sorts the same 2023 Residential + Expected Life Cycle of Programs + Energy Savings observations from highest to lowest. Shares use the direct 51-row sum of 101,341,592 MWh as the denominator. The original MWh unit is preserved, no missing observation is converted to zero, and no value from another year is substituted.
| Rank | State or jurisdiction | Life-cycle energy savings (MWh) | Share of 51-row sum |
|---|---|---|---|
| 1 | California (CA) | 13,898,915 | 13.7% |
| 2 | Illinois (IL) | 12,688,372 | 12.5% |
| 3 | New York (NY) | 8,574,808 | 8.5% |
| 4 | Minnesota (MN) | 7,085,679 | 7.0% |
| 5 | Arizona (AZ) | 6,734,344 | 6.6% |
| 6 | Texas (TX) | 5,493,483 | 5.4% |
| 7 | New Jersey (NJ) | 5,087,857 | 5.0% |
| 8 | North Carolina (NC) | 4,480,080 | 4.4% |
| 9 | Colorado (CO) | 3,408,985 | 3.4% |
| 10 | Pennsylvania (PA) | 2,723,243 | 2.7% |
| 11 | Michigan (MI) | 2,712,012 | 2.7% |
| 12 | Florida (FL) | 2,471,306 | 2.4% |
| 13 | Oklahoma (OK) | 2,326,914 | 2.3% |
| 14 | Arkansas (AR) | 2,103,265 | 2.1% |
| 15 | Washington (WA) | 2,073,952 | 2.0% |
| 16 | Maryland (MD) | 1,799,964 | 1.8% |
| 17 | South Carolina (SC) | 1,457,040 | 1.4% |
| 18 | Wisconsin (WI) | 1,438,965 | 1.4% |
| 19 | Indiana (IN) | 1,330,305 | 1.3% |
| 20 | Oregon (OR) | 1,310,417 | 1.3% |
| 21 | Louisiana (LA) | 1,272,636 | 1.3% |
| 22 | Missouri (MO) | 1,261,603 | 1.2% |
| 23 | New Mexico (NM) | 1,159,749 | 1.1% |
| 24 | Utah (UT) | 1,131,586 | 1.1% |
| 25 | Georgia (GA) | 1,107,434 | 1.1% |
| 26 | Virginia (VA) | 972,622 | 1.0% |
| 27 | Nevada (NV) | 789,443 | 0.8% |
| 28 | Iowa (IA) | 414,087 | 0.4% |
| 29 | Mississippi (MS) | 403,329 | 0.4% |
| 30 | Massachusetts (MA) | 388,833 | 0.4% |
| 31 | Hawaii (HI) | 377,125 | 0.4% |
| 32 | Vermont (VT) | 317,801 | 0.3% |
| 33 | Idaho (ID) | 277,764 | 0.3% |
| 34 | Montana (MT) | 270,706 | 0.3% |
| 35 | Maine (ME) | 264,853 | 0.3% |
| 36 | Rhode Island (RI) | 235,165 | 0.2% |
| 37 | Kentucky (KY) | 235,017 | 0.2% |
| 38 | New Hampshire (NH) | 192,937 | 0.2% |
| 39 | Ohio (OH) | 176,240 | 0.2% |
| 40 | Connecticut (CT) | 155,682 | 0.2% |
| 41 | Tennessee (TN) | 137,062 | 0.1% |
| 42 | Delaware (DE) | 133,802 | 0.1% |
| 43 | Nebraska (NE) | 126,215 | 0.1% |
| 44 | South Dakota (SD) | 116,041 | 0.1% |
| 45 | Alabama (AL) | 87,190 | 0.1% |
| 46 | District of Columbia (DC) | 67,947 | 0.1% |
| 47 | Wyoming (WY) | 33,573 | 0.0% |
| 48 | West Virginia (WV) | 31,724 | 0.0% |
| 49 | Kansas (KS) | 1,980 | 0.0% |
| 50 | North Dakota (ND) | 899 | 0.0% |
| 51 | Alaska (AK) | 641 | 0.0% |
Life-cycle savings are not the same as savings only in calendar year 2023
Form EIA-861 distinguishes reporting-year results from expected life-cycle results. The reporting-year series is designed around the incremental savings associated with the reporting year, while the life-cycle series extends the expected savings over the program life. That distinction changes the meaning of the numbers. California’s 13.899 million MWh should not be restated as 13.899 million MWh saved only during 2023. It is the expected life-cycle energy-savings value reported in the 2023 slice.
The same time boundary matters when savings are combined with costs or peak-demand effects. EIA publishes life-cycle energy savings in MWh, peak-demand savings in MW, customer incentives, and other program costs as separate measures. A cost-effectiveness calculation needs costs and savings that are matched to the same sector and period definition. Mixing reporting-year costs with life-cycle savings, for example, can create a ratio whose numerator and denominator describe different time horizons.
The 51-state sum almost exactly matches EIA’s national table
The direct sum of the state and District of Columbia observations is 101,341,592 MWh. EIA Electric Power Annual Table 10.2 reports 101,341,591 MWh for 2023 Residential ‘Life Cycle Savings – Energy Savings.’ The difference is only 1 MWh. That near-identity provides a strong scale check that the state slice and the national table are describing the same residential life-cycle savings concept.
The same national table reports 270,451,419 MWh of life-cycle energy savings across all sectors in 2023. Residential accounts for about 37.5% of that total, commercial about 54.1%, industrial about 8.5%, and transportation 0.0%. Those national sector shares provide context only. They should not be assigned to individual states, because the state dataset analyzed here contains only the Residential slice and state sector mixes can differ.
Why this absolute ranking is not a program-efficiency scorecard
The dataset directly answers where the reported expected life-cycle residential energy savings are largest under one EIA definition. It does not directly answer which state has the best energy-efficiency policy, the highest savings per household, the best cost-effectiveness, or the largest savings relative to residential electricity sales. Those questions need denominators and matched explanatory data.
- What the data can answer: the absolute size, ranking, distribution, and concentration of 2023 reported expected life-cycle residential energy savings by state.
- What the data cannot answer alone: savings per household, savings as a percentage of residential sales, dollars saved on customer bills, savings per program dollar, or policy quality.
- Useful follow-up data: residential customer counts, residential electricity sales, customer incentives and other program costs, peak-demand savings, participation counts, and a consistent multi-year series.
Source and calculation method
The state observations come from the U.S. Energy Information Administration Form EIA-861 detailed data and the State Electricity Profiles energy-efficiency API. The selected slice is annual 2023 data with sector=RES, timePeriod=Expected Life Cycle of Programs, and the energy-savings field. The source unit is megawatthours. The national cross-check uses Electric Power Annual Table 10.2, Energy Efficiency – Life Cycle.
The sum, mean, median, quartiles, rankings, band counts, and concentration shares are calculated directly from the 51 numeric observations. Each state code is unique, every row is dated 2023, and there are no missing numeric values. The chart displays the top 15 observations after converting MWh to TWh for readability, using 1 TWh = 1,000,000 MWh. Rankings and shares are calculated from the original MWh values.
Main takeaway
California has the largest 2023 reported expected life-cycle residential energy savings at 13.899 TWh, followed by Illinois at 12.688 TWh and New York at 8.575 TWh. The top five jurisdictions account for 48.3% of the 51-row sum and the top ten for 69.2%. The mean of 1.987 TWh is more than twice the median of 0.973 TWh, showing how strongly the upper tail shapes the distribution.
The ranking is most useful as a scale comparison of one precisely defined EIA series. It should not be stretched into a judgment about state policy performance or household efficiency without adding suitable denominators and cost data. With that boundary kept clear, the 51-state dataset provides a strong baseline for identifying where residential program life-cycle savings are reported at the largest absolute scale.
Frequently Asked Questions
Which state had the largest 2023 expected life-cycle residential energy savings?
California ranked first at 13,898,915 MWh, followed by Illinois at 12,688,372 MWh and New York at 8,574,808 MWh.
Are these savings only for electricity reduced during calendar year 2023?
No. The reporting year is 2023, but the time-period facet is Expected Life Cycle of Programs, so the values represent expected savings over the program life cycle.
Does a larger life-cycle savings value mean a state has the best energy-efficiency policy?
Not from this dataset alone. The values are absolute savings and do not include the customer, sales, cost, or participation denominators needed for a performance assessment.
Does the 51-jurisdiction sum match EIA’s national residential total?
Yes, almost exactly. The 51-row sum is 101,341,592 MWh and EIA's national 2023 residential life-cycle table reports 101,341,591 MWh, a difference of just 1 MWh.
Related Articles
- Which States Reported the Highest Industrial Energy-Efficiency Program Other Costs? (2023)
- Which U.S. States Had the Highest Residential CO₂ Emissions? (2022)
- U.S. Coal CO₂ Emissions by State in 2022: A Wide Gap Across 51 Jurisdictions
Green Map creates custom-edited map images using open geographic data sources such as geoBoundaries, Natural Earth, OpenStreetMap, and government open data.
These maps are edited visual materials, not raw data files, and are provided for education, documents, presentations, and graphic reference.