How similar were female and male gross enrolment ratios at the lower-secondary level in 2024? UNESCO Institute for Statistics (UIS) indicator GER.2.GPIA is the adjusted gender parity index for the lower-secondary gross enrolment ratio.
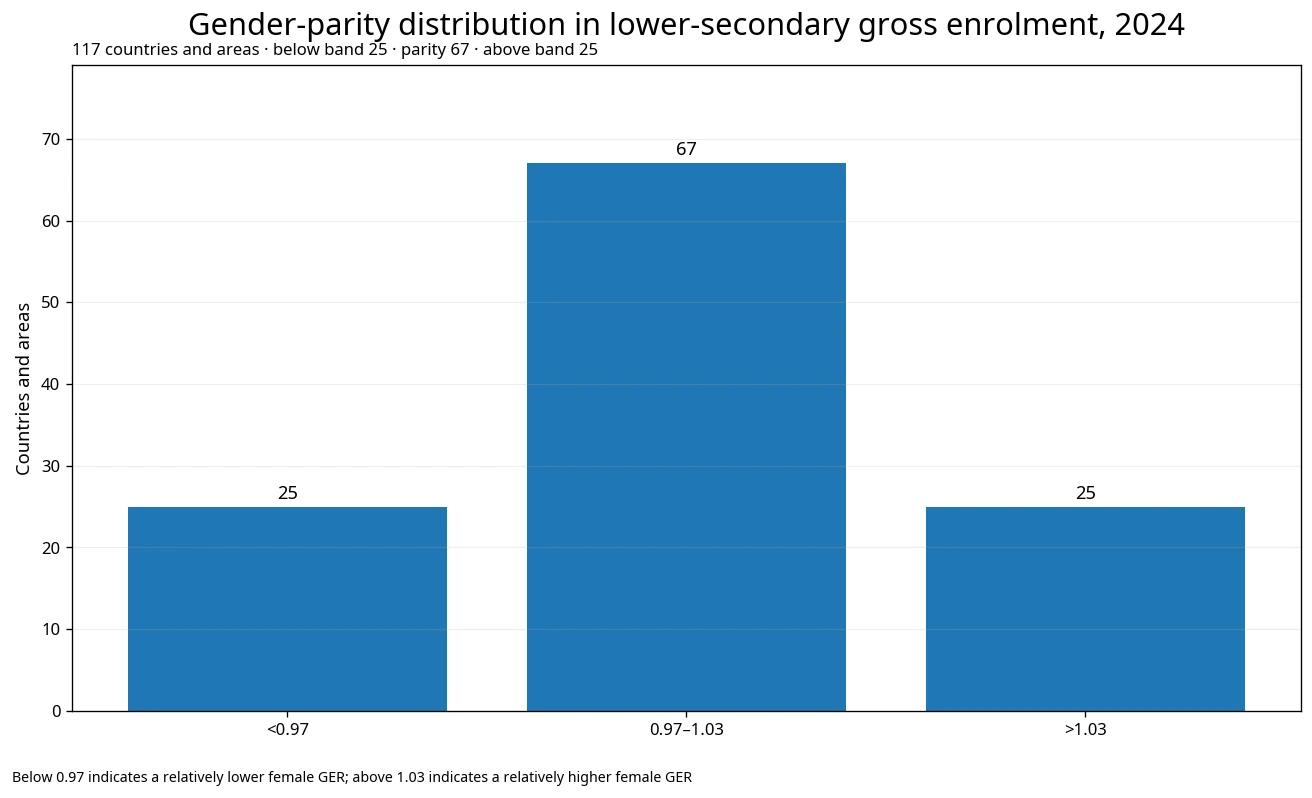
The extract contains 117 country and area observations. The unweighted mean is 1.006 and the median is 0.997. Sixty-seven observations fall inside the UIS parity band of 0.97–1.03, while 25 are below 0.97 and 25 are above 1.03.
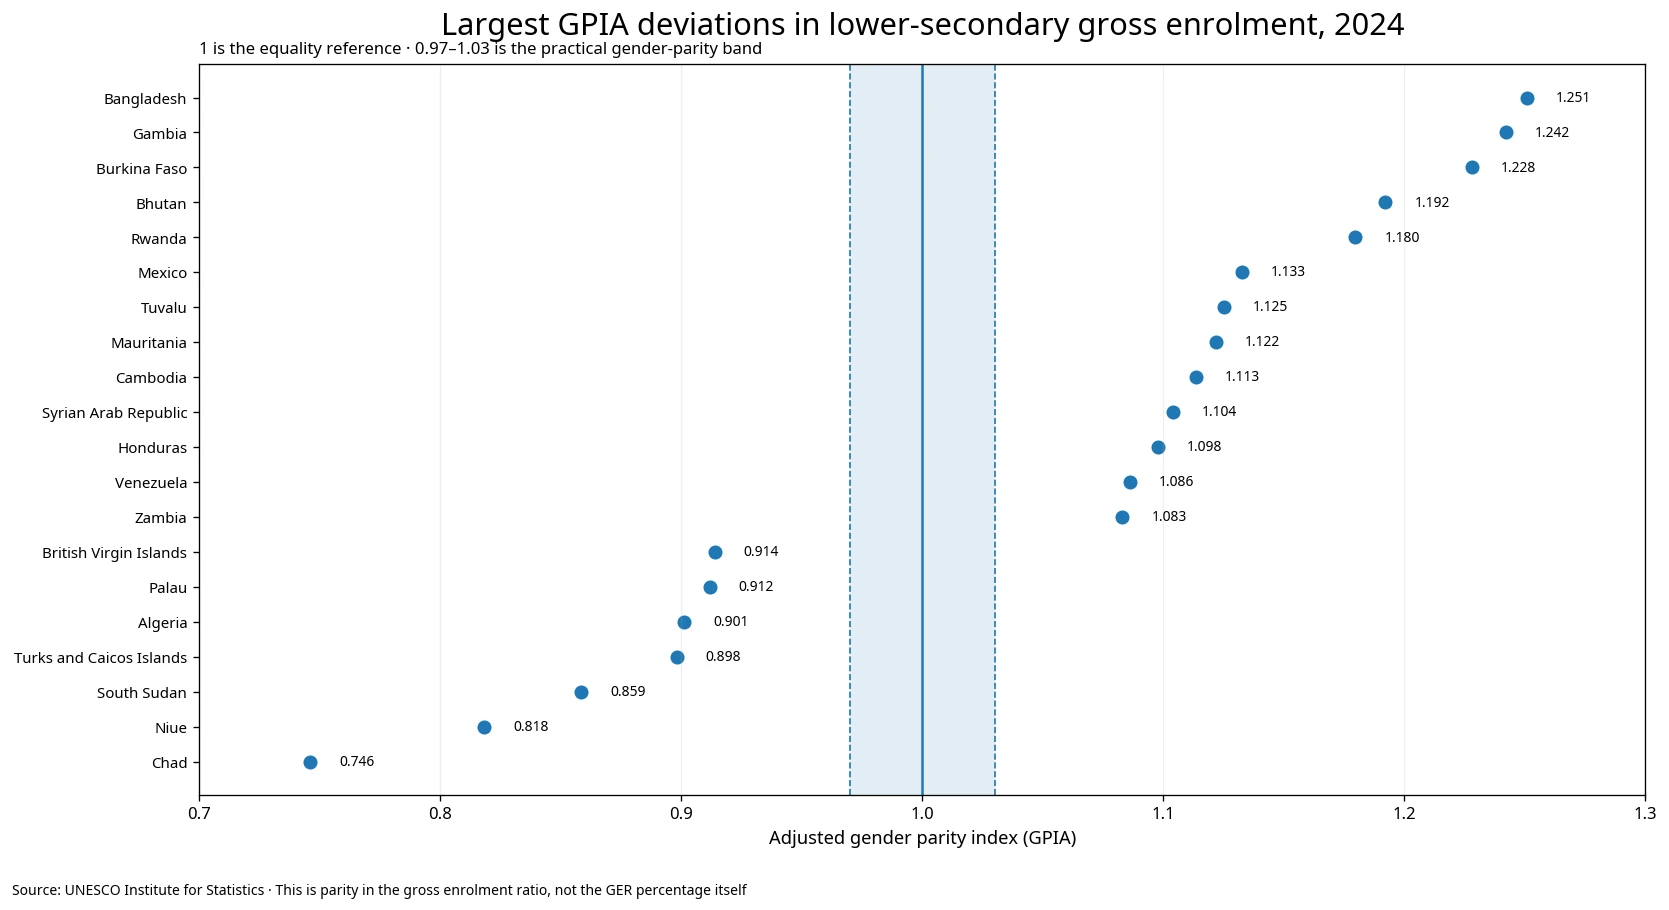
Table of Contents
GPIA measures gender balance in the gross enrolment ratio, not the GER itself
The gross enrolment ratio counts all students enrolled at a given education level, regardless of age, and divides that number by the population of the official age group for the level. Because over-age and under-age students can be included, GER can exceed 100%.
GER.2.GPIA compares the female lower-secondary GER with the male lower-secondary GER. A GPIA of 0.90 does not mean that the enrollment ratio is 90%. It indicates that the female GER is lower relative to the male GER.
A value above 1 points in the opposite direction: the female GER is relatively higher. The index alone does not reveal the actual female or male GER percentages or the number of enrolled students. Those base indicators are separate.
The index is centered on 1 and 0.97–1.03 is the practical parity band
The conventional gender parity index divides a female indicator value by the corresponding male value. Equality gives 1. UIS uses an adjusted form so that disparities above and below 1 can be represented more symmetrically within a 0–2 scale.
In this dataset, 67 of 117 observations fall within 0.97–1.03. There are 67 values below 1 and 50 above 1, with 0 exactly equal to 1.000. The median of 0.997 also shows that the center of the country distribution is very close to parity.
Because the adjusted transformation changes the scale above 1, a GPIA of 1.20 should not be translated into the claim that the female GER is exactly 20% higher. The safer interpretation is direction and distance from the parity reference.
Most observations are near parity, but several country deviations are large
The first quartile is 0.982 and the third quartile is 1.019, so the middle half of observations lies in a relatively narrow range around 1. Even so, 14 observations are more than 0.10 away from 1, 7 are more than 0.15 away and 4 are more than 0.20 away.
The minimum observation is Chad at 0.746, followed by Niue at 0.818, South Sudan at 0.859, the Turks and Caicos Islands at 0.898 and Algeria at 0.901. These values point toward a lower female GER relative to the male GER.
At the high end, Bangladesh records 1.251, the Gambia 1.242, Burkina Faso 1.228, Bhutan 1.192 and Rwanda 1.180. These observations point toward a relatively higher female GER.
Values on both sides of 1 represent disparity
From a gender-parity perspective, 0.80 and 1.20 should not be treated simply as low and high rankings. Both are deviations from equality. The direction differs: below 1 means the female GER is relatively lower, while above 1 means it is relatively higher.
The dataset therefore should not be turned into a league table of countries that are ‘better for girls’ or ‘better for boys.’ It identifies relative balance in one enrollment indicator, while the underlying GER levels and the reasons for the difference require additional data.
Gross enrolment also has its own limitations. A high GER is not automatically a quality or efficiency outcome because over-age enrollment, delayed entry and grade repetition can increase the numerator. GPIA inherits that structural feature of the underlying GER.
Selected observations illustrate the lower, parity and higher zones
The table below is designed to show how the index should be interpreted rather than to rank education systems. Values below 0.97 are classified as relatively lower female GER, 0.97–1.03 as parity, and values above 1.03 as relatively higher female GER.
| Country / area | 2024 GPIA | Interpretation |
|---|---|---|
| Chad | 0.746 | Female GER relatively lower |
| Niue | 0.818 | Female GER relatively lower |
| South Sudan | 0.859 | Female GER relatively lower |
| Algeria | 0.901 | Female GER relatively lower |
| Palau | 0.912 | Female GER relatively lower |
| Pakistan | 0.954 | Female GER relatively lower |
| Albania | 0.988 | Parity range |
| Republic of Korea | 0.997 | Parity range |
| United Arab Emirates | 0.999 | Parity range |
| Zambia | 1.083 | Female GER relatively higher |
| Mexico | 1.133 | Female GER relatively higher |
| Rwanda | 1.180 | Female GER relatively higher |
| Bhutan | 1.192 | Female GER relatively higher |
| Burkina Faso | 1.228 | Female GER relatively higher |
| Gambia | 1.242 | Female GER relatively higher |
| Bangladesh | 1.251 | Female GER relatively higher |
The Republic of Korea records 0.997, which lies inside the parity band. This does not mean the country’s lower-secondary GER is 99.7%; it means the female and male gross enrolment ratios are relatively close under the adjusted parity index.
Gross enrolment ratio and net enrolment rate answer different questions
GER includes students of any age enrolled at the selected education level, while the net enrolment rate restricts the numerator to students in the official age range. That is why GER can exceed 100% and why it should not be treated as a direct measure of age-appropriate participation.
A GPIA close to 1 means female and male GER values are similar, but it does not prove that most children of official lower-secondary age are enrolled at the correct level. Net enrollment or out-of-school indicators are better suited to that question.
Likewise, a GPIA far from 1 does not reveal whether one sex has a low absolute GER. Both female and male GER values could be high, or both could be low, while still producing a relative difference.
The causes of the gender gap cannot be identified from GPIA alone
Gender differences in lower-secondary enrollment can be associated with school access, household resources, early marriage, safety, work, geographic supply, repetition, delayed entry and education policy. GER.2.GPIA contains none of those causal variables.
Chad’s low GPIA or Bangladesh’s high GPIA therefore cannot be attributed to one policy or social condition using this dataset alone. Country-specific evidence and the underlying sex-specific enrollment indicators are required.
Extreme values should also be checked over time. A one-year observation can be influenced by data reporting, cohort structure or policy changes. A time series is needed to determine whether a disparity is persistent.
The common 2024 reference year supports cross-country comparison but not trend analysis
All 117 observations use 2024, so the table does not mix different national reference years. That makes the cross-country comparison cleaner than a latest-value dataset.
A single 2024 cross-section cannot show whether countries moved closer to parity from 2023 or whether a large gap is narrowing over time. Trend questions require comparable values over several years.
The mean of 1.006 is also an unweighted country average, not a student-weighted global gender parity measure. Large education systems and small island areas each contribute one country-level GPIA observation.
Data source and calculation method
Country values come from UNESCO Institute for Statistics indicator GER.2.GPIA, “Gross enrolment ratio, lower secondary, adjusted gender parity index (GPIA),” using the 2024 NATIONAL observations in this comparison. The generic internal unit label has been corrected in the completed metadata to an adjusted gender parity index on the 0–2 scale.
- UNESCO UIS official API — GER.2.GPIA
- UNESCO UIS — adjusted gender parity index methodology
- UNESCO UIS — 0.97–1.03 parity-band explanation
The mean of 1.006, median of 0.997, quartiles and parity-band counts are calculated directly from the 117 non-missing observations. Missing values are not zero-filled, and no female or male GER is reconstructed from the index. Because the source package does not require a geographic map, the featured visuals focus on deviation and distribution rather than forcing a choropleth.
The strongest conclusion supported by the data is that lower-secondary GER gender parity was within the 0.97–1.03 band in 67 of 117 observations in 2024, while a smaller set of countries showed substantial deviations on either side of 1. Actual enrollment levels, net enrollment, student counts and the causes of gender differences require additional indicators.
Frequently Asked Questions
What does a lower-secondary GER GPIA of 1 mean?
It means the female and male lower-secondary gross enrolment ratios are equal at the parity reference. UIS generally treats 0.97–1.03 as the practical parity band.
Does a GPIA of 0.9 mean the gross enrolment ratio is 90%?
No. GPIA is a relative gender-parity index comparing female and male GER values. The actual GER percentages require the underlying sex-specific indicators.
Why can a gross enrolment ratio exceed 100%?
Because students outside the official age range can still be enrolled at the level. Over-age enrollment, delayed entry or grade repetition can push GER above 100%.
How many 2024 observations are within the gender-parity band?
Sixty-seven of 117 observations are within 0.97–1.03. Twenty-five are below 0.97 and 25 are above 1.03.
Related Articles
- Lower Secondary General-Programme Share | 120 Countries in 2024
- Primary Teacher Training Gender Parity 2023 | 41 of 80 in Parity Band
- Gender Gap in STEM Share Among Tertiary Graduates 2023 | Women Lower in 99
Green Map creates custom-edited map images using open geographic data sources such as geoBoundaries, Natural Earth, OpenStreetMap, and government open data.
These maps are edited visual materials, not raw data files, and are provided for education, documents, presentations, and graphic reference.