UNESCO Institute for Statistics (UIS) data for 2024 show an enormous spread in the number of children enrolled in pre-primary education across the 130 countries and areas with observations in this extract. China reports about 40.9 million enrolled children and India about 37.8 million. Together, those two observations account for almost 49% of the sum across all 130 rows.
The observed values add to about 160.7 million children. This is a sum of the reporting countries and areas in the dataset, not automatically a complete world total. Countries differ in population size, age structure, formal pre-primary age ranges and education-system organization, so the number should be read as a same-year cross-country scale comparison.
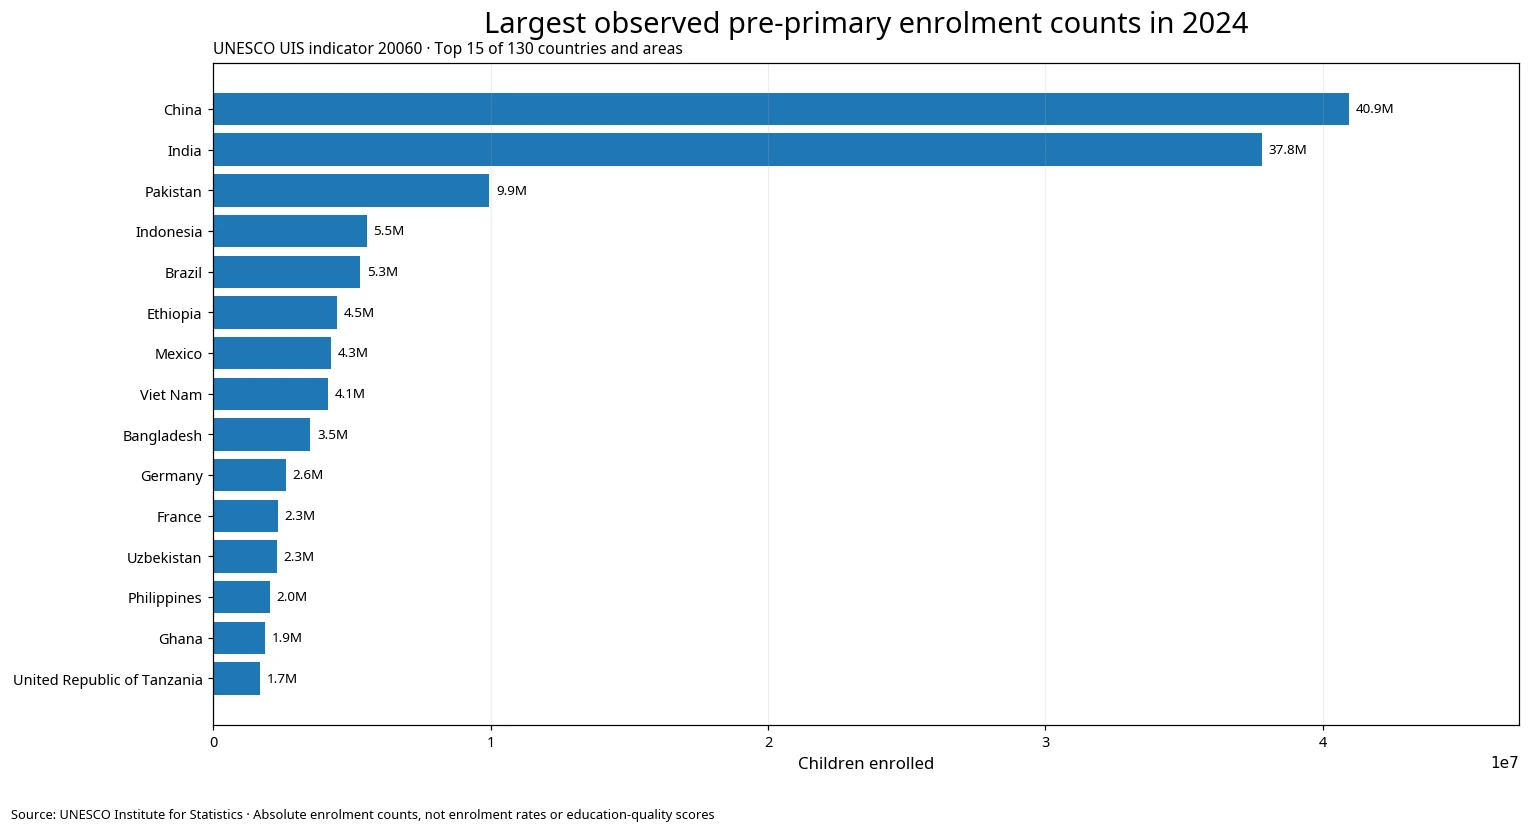
Table of Contents
China and India account for almost half of the observed sum
China’s 40,934,337 enrolled children represent about 25.5% of the 130-row sum. Adding India lifts the top-two share to about 49.0%. Pakistan brings the top three to 55.2%, while the top ten reach 73.7%.
This concentration should not be read as evidence that participation is especially high in those countries. Absolute enrolment counts are strongly influenced by the size of the child population. Large countries can rank highly even when the proportion of eligible children enrolled is not among the highest.
The indicator therefore answers a scale question: how many children are enrolled in the formal pre-primary level counted by UIS? It does not answer the participation question of what percentage of the official-age child population is enrolled. A net or gross enrolment rate is required for that.
Most of the largest observations come from large-population countries
After China and India, Pakistan reports about 9.95 million, Indonesia 5.53 million and Brazil 5.30 million. Ethiopia, Mexico, Viet Nam and Bangladesh are also above 3 million. Germany and France report about 2.61 million and 2.33 million respectively.
| Rank | Country / area | Children enrolled in 2024 | Share of 130-row sum |
|---|---|---|---|
| 1 | China | 40,934,337 | 25.5% |
| 2 | India | 37,791,750 | 23.5% |
| 3 | Pakistan | 9,948,142 | 6.2% |
| 4 | Indonesia | 5,528,358 | 3.4% |
| 5 | Brazil | 5,304,203 | 3.3% |
| 6 | Ethiopia | 4,476,085 | 2.8% |
| 7 | Mexico | 4,254,424 | 2.6% |
| 8 | Viet Nam | 4,132,247 | 2.6% |
| 9 | Bangladesh | 3,496,423 | 2.2% |
| 10 | Germany | 2,613,758 | 1.6% |
| 11 | France | 2,333,896 | 1.5% |
| 12 | Uzbekistan | 2,292,159 | 1.4% |
| 13 | Philippines | 2,045,356 | 1.3% |
| 14 | Ghana | 1,862,212 | 1.2% |
| 15 | United Republic of Tanzania | 1,676,559 | 1.0% |
The top 15 observations together represent about 80.1% of the observed sum. At the other end of the distribution, several small countries and territories report only hundreds or a few thousand enrolled children. That range makes raw rankings less informative unless the reader also considers population scale and the shape of the distribution.
The Republic of Korea reports 846,694 children and ranks 27th among the 130 observations, equal to about 0.5% of the observed sum. Like every other row, this is an absolute enrolment count rather than a participation rate.
The mean is about 1.24 million, but the median is only 180,167
The unweighted mean across the 130 observations is about 1.24 million children, while the median is 180,167. The mean is roughly 6.9 times the median because the very large observations at the top pull the arithmetic average upward.
The first quartile is 19,065 and the third quartile is 608,230. In other words, the middle half of the reporting countries and areas lies roughly between those two enrolment counts. A headline based only on the mean would give an inflated impression of what a typical row in this dataset looks like.
Twenty-three observations are at or above one million. Another 56 are between 100,000 and one million, while 51 are below 100,000. Among the latter group, 26 are below 10,000. The distribution is strongly right-skewed.
Absolute enrolment is different from an enrolment rate or education-quality measure
An absolute enrolment count is useful for understanding the size of a pre-primary education system. It indicates how many children are registered at that education level. It is not standardized for the number of children who are of official pre-primary age.
A country can therefore have a very large number of enrolled children and still have a moderate participation rate if its child population is also very large. Conversely, a small country can have only tens of thousands of enrolled children while enrolling nearly all children in the official age group.
The count also says nothing directly about teacher preparation, class size, daily attendance, programme quality, cost to households or learning outcomes. Those questions require separate indicators. Treating one headcount as a general score for the education system would overstate what the data can support.
Using one reference year improves time comparability
All 130 retained observations are dated 2024. This avoids a common problem in international comparisons where one country’s latest value may be from 2024 while another’s is several years older. A same-year extract gives a cleaner snapshot of system size.
The trade-off is incomplete geographic coverage. Countries or areas without a 2024 observation are outside this comparison. They are not assigned a value of zero because missing data and zero enrolment are not the same thing.
Even with a common year, institutional differences remain. Official entrance ages, programme duration, the boundary between education and childcare, public-private provision and administrative reporting can differ. UIS classifications improve comparability but do not erase every national-system difference.
Enrolment is not the same as attendance
The indicator counts children registered in pre-primary education. It does not reveal how regularly they attend, how many hours they participate, or whether they remain enrolled for the entire school year. Attendance and participation intensity require different administrative or survey measures.
Pre-primary education statistics also refer to programmes classified within the formal education framework. Some childcare, home-based care, informal early learning or services outside the education reporting system may not be captured in the same way. A low enrolment count therefore does not prove that young children receive no care or learning support.
Likewise, a large enrolment count does not establish programme quality. The current series is a scale measure and should remain a scale measure in interpretation.
Top-country shares are not a global participation rate
China and India together make up 49.0% of the observed sum, but that should not be rewritten as a claim that half of all pre-primary children in the world are in those two countries. The denominator is the sum of the 130 observations in this extract, and full worldwide coverage is not established by the dataset itself.
Absolute-count shares naturally give more weight to populous countries. That is appropriate when measuring system volume, but it is not an appropriate basis for ranking policy performance. Comparative policy questions require rates, financing indicators, teacher measures and other context.
The same caution applies to neighboring ranks. Indonesia being above or below Brazil on an absolute-count list does not indicate which system reaches a larger share of its young children or provides better services.
Low counts in small countries and territories are not evidence of failure
The minimum observed value is 18 children. Very small places such as Niue, Tokelau and the Cook Islands naturally report much smaller headcounts than large countries. On a common scale those observations can look negligible even when participation relative to the local child population is high.
In a small territory, a difference of a few dozen or a few hundred children can represent a meaningful share of the relevant age group. In a very large country, a change of hundreds of thousands may represent a much smaller percentage. Absolute counts and rates answer different questions.
For that reason, the featured visual uses a horizontal bar chart of the top 15 counts rather than a world choropleth. A single color scale would be dominated by the two very large observations and would compress most middle-sized countries into a narrow visual range.
What changes when the count is read alongside the net enrolment rate?
The count measures the size of the enrolled population. The pre-primary net enrolment rate measures the share of children in the official age group who are enrolled. Using both indicators separates system scale from coverage.
A country can rank near the top in absolute enrolment and much lower in participation rate, or the reverse. Large child populations create large headcounts, while rates standardize by the relevant age-group population.
Official entrance age adds another piece of context. If countries define the formal pre-primary stage differently, the number of ages included in the system can differ. Enrolment count, net enrolment rate and official entrance age are complementary measures, not interchangeable ones.
Data source and calculation method
The country values come from UNESCO Institute for Statistics indicator 20060, “Enrolment in pre-primary education, both sexes (number),” using the 2024 NATIONAL observations in this comparison. ‘Both sexes’ means girls and boys combined. The unit is a number of enrolled children, not a percentage or index.
The sum, mean, median, quartiles and concentration shares are calculated directly from the 130 non-missing observations. Missing countries are not zero-filled, and no estimates are created from population totals or age-group sizes.
The strongest conclusions supported by the dataset concern the absolute scale and concentration of reported pre-primary enrolment in 2024. Participation rates, education quality, access barriers, causes and policy effects require additional indicators or country-specific evidence.
Frequently Asked Questions
Does a large pre-primary enrolment count mean a high enrolment rate?
No. This indicator is an absolute number of enrolled children. A participation rate requires a denominator such as the population in the official pre-primary age group.
Is the sum of the 130 observations the complete world total?
Not necessarily. It is the sum of the 130 countries and areas with 2024 observations in this extract. Missing places are not treated as zero.
Is enrolment the same as attendance?
No. Enrolment records registration in the education system. Attendance frequency, hours and persistence require separate data.
Why are China and India so large in the ranking?
The indicator is an absolute count and is strongly affected by population scale. The dataset alone does not support converting those large counts into claims about higher participation or better education performance.
Related Articles
- Pre-Primary Net Enrolment Rate in 2024 | 121 Countries and Areas
- Official Pre-Primary Entrance Age | 223 Countries and Areas in 2025
- Pre-Primary Teachers Meeting Minimum Training Requirements | 2024
Green Map creates custom-edited map images using open geographic data sources such as geoBoundaries, Natural Earth, OpenStreetMap, and government open data.
These maps are edited visual materials, not raw data files, and are provided for education, documents, presentations, and graphic reference.