The share of tertiary graduates completing Business, Administration and Law programmes varies widely across the 104 countries and territories with a 2023 UNESCO Institute for Statistics (UIS) observation. Monaco is highest at 82.41%, followed by Andorra at 59.06%, the Turks and Caicos Islands at 50.00%, Bahrain at 42.64%, and Colombia at 42.56%. The country-row median is 25.89%.
This is a composition measure among tertiary graduates, not the share of the total population holding a business or law degree. The denominator is all tertiary graduates represented in 2023, and the numerator is graduates from programmes classified in Business, Administration and Law. A value of 30% therefore means roughly 30 of every 100 tertiary graduates in that observation completed a programme in this broad field.
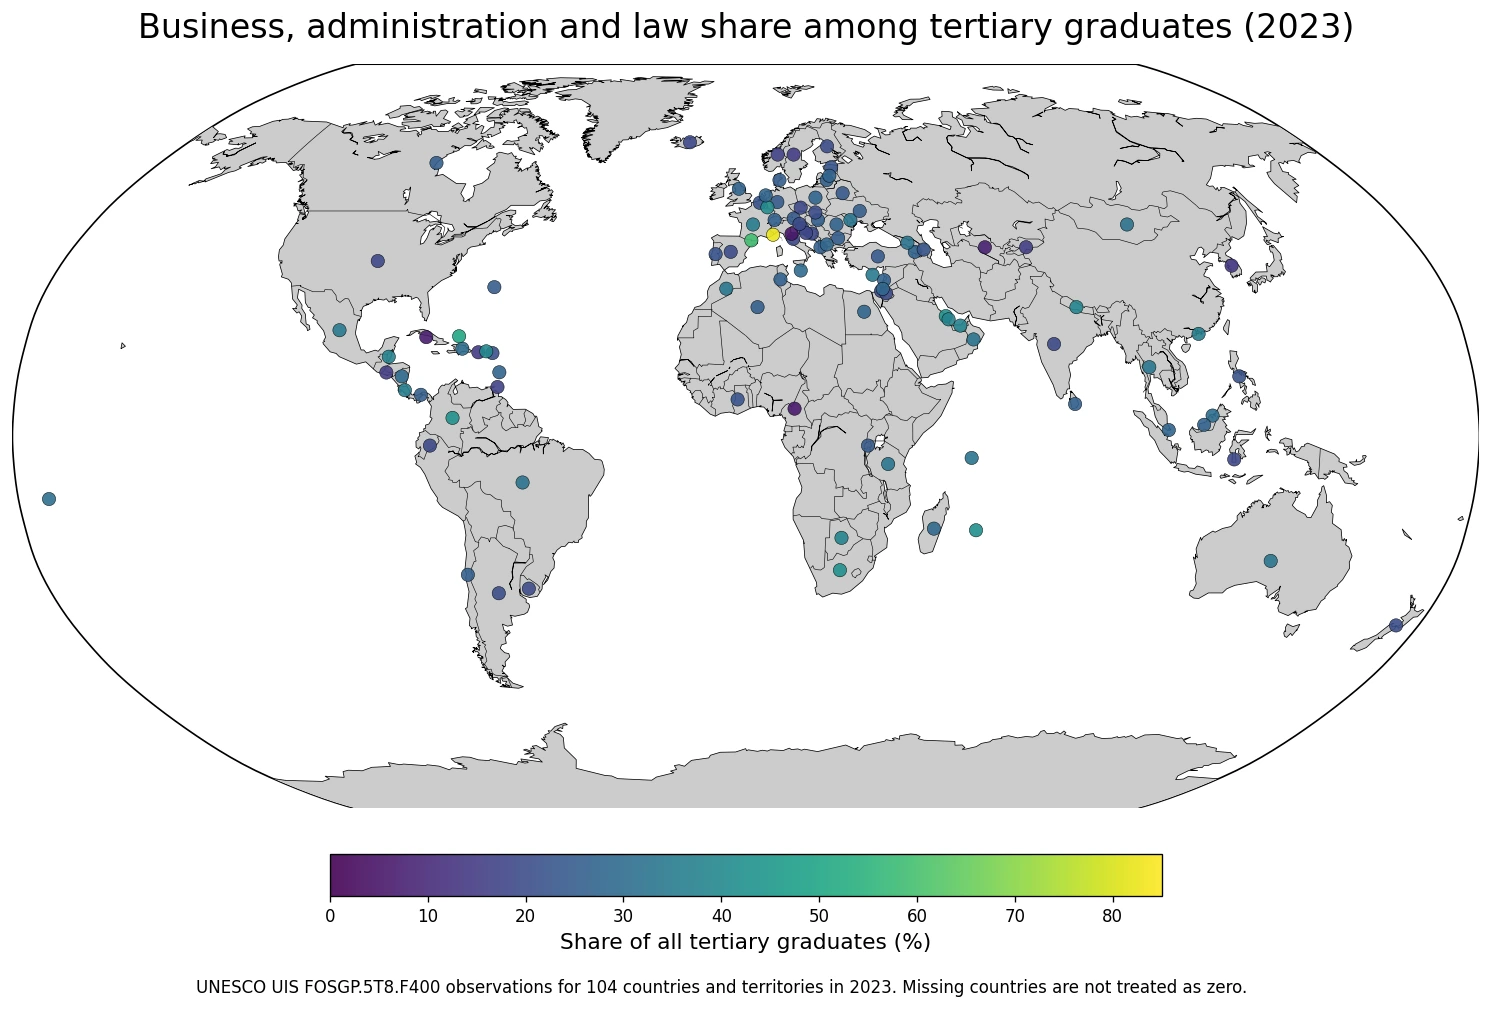
Table of Contents
Monaco stands out at 82.41%
Monaco records 82.41%, more than 23 percentage points above second-place Andorra at 59.06%. The Turks and Caicos Islands reports 50.00%, followed by Bahrain at 42.64%, Colombia at 42.56%, South Africa at 42.36%, Mauritius at 42.14%, and Luxembourg at 41.46%.
| Rank | Country or territory | Business, Administration and Law share |
|---|---|---|
| 1 | Monaco | 82.41% |
| 2 | Andorra | 59.06% |
| 3 | Turks and Caicos Islands | 50.00% |
| 4 | Bahrain | 42.64% |
| 5 | Colombia | 42.56% |
| 6 | South Africa | 42.36% |
| 7 | Mauritius | 42.14% |
| 8 | Luxembourg | 41.46% |
| 9 | British Virgin Islands | 39.85% |
| 10 | Nepal | 38.68% |
| 11 | Belize | 37.99% |
| 12 | Botswana | 37.96% |
| 13 | United Arab Emirates | 37.89% |
| 14 | Qatar | 37.45% |
| 15 | Costa Rica | 36.23% |
Very small tertiary systems deserve special care when interpreting high shares. A narrow set of institutions or programmes can have a large effect on the graduate mix, and a very high percentage does not imply a large absolute number of graduates. A large country with a lower percentage can still produce far more graduates in absolute terms.
The center of the distribution is the 20–30% band
48 observations fall between 20% and 29.9%, making it the largest band, while 24 are between 30% and 39.9%. 20 fall between 10% and 19.9%, 5 between 40% and 49.9%, and 3 are at least 50%. Only 4 observations are below 10%.
| Graduate-share band | Countries or territories | Share of observations |
|---|---|---|
| Below 10% | 4 | 3.8% |
| 10–19.9% | 20 | 19.2% |
| 20–29.9% | 48 | 46.2% |
| 30–39.9% | 24 | 23.1% |
| 40–49.9% | 5 | 4.8% |
| 50% or more | 3 | 2.9% |
The unweighted mean is 27.00% and the median 25.89%. The middle half of observations lies between 20.15% and 32.48%. Monaco’s extreme value pulls the mean upward, but the typical country observation remains in the mid-20s.
Business, Administration and Law is broader than a business degree
In UNESCO’s ISCED-F 2013, Business, Administration and Law is broad field 04. Narrow field 041 Business and administration includes accounting and taxation, finance, banking and insurance, management and administration, marketing and advertising, secretarial and office work, wholesale and retail sales, and work skills. Narrow field 042 covers law.
The indicator should therefore not be relabelled as the share of business-school or management graduates alone. It combines a wide set of programmes, while economics is classified under Social Sciences rather than automatically included in field 04.
The Gulf shows a cluster of relatively high shares
Bahrain records 42.64%, the United Arab Emirates 37.89%, Qatar 37.45%, and Oman 32.75%. All four are above 30%, and three are above 37%. The map therefore shows a regional cluster of relatively high graduate shares around the Gulf.
The cluster does not by itself establish a labour-market or economic cause. Programme supply, private and public tertiary structures, international student composition, student choice, and the size of other fields can all affect the percentage. Those explanatory variables are not contained in FOSGP.5T8.F400.
Latin America also contains several high-share observations
Colombia is at 42.56%, Costa Rica 36.23%, Mexico 34.84%, and Brazil 32.29%. Argentina is lower at 20.31% and Chile at 25.89%, showing that graduate-field composition can differ substantially within the same broad region.
Neighbouring or regionally similar countries therefore should not be assumed to have the same graduate mix. The map is useful both for identifying clusters and for spotting sharp differences between nearby education systems. Broad differences are more defensible than fine decimal-place rankings because national programme structures and reporting practices can still vary.
Southern Africa and island systems also show high values
South Africa records 42.36%, Mauritius 42.14%, and Botswana 37.96%. Cameroon, by contrast, is at 6.04%, the second-lowest observation in the dataset. The African values therefore span almost the full international range.
A high or low share does not directly rank economic development. Because the denominator is all tertiary graduates, growth in health, engineering, education, ICT or other fields can reduce the Business, Administration and Law share even when the absolute number of field-04 graduates is unchanged or rising.
European microstates illustrate extreme neighbouring differences
Monaco is at 82.41%, Andorra 59.06%, and Luxembourg 41.46%, while San Marino is lowest overall at 4.98%. France records 35.69% and Germany 24.43%. In the Nordic group, Sweden is 15.56%, Norway 17.14%, Finland 20.01%, Denmark 25.22%, and Iceland 18.82%.
These contrasts show that geographic proximity alone does not determine field composition. Small tertiary systems can also be especially sensitive to which institutions and programmes are available in a given year.
Low percentages do not imply a small business or legal workforce
San Marino is at 4.98%, Cameroon 6.04%, Cuba 6.89%, and Uzbekistan 7.75%. The Republic of Korea records 13.90%, followed by Puerto Rico at 14.28%, Kyrgyzstan 15.39%, El Salvador 15.40%, and Sweden 15.56%.
| Low-end order | Country or territory | Business, Administration and Law share |
|---|---|---|
| 1 | San Marino | 4.98% |
| 2 | Cameroon | 6.04% |
| 3 | Cuba | 6.89% |
| 4 | Uzbekistan | 7.75% |
| 5 | Republic of Korea | 13.90% |
| 6 | Puerto Rico | 14.28% |
| 7 | Kyrgyzstan | 15.39% |
| 8 | El Salvador | 15.40% |
| 9 | Sweden | 15.56% |
| 10 | Trinidad and Tobago | 16.66% |
| 11 | Norway | 17.14% |
| 12 | United States of America | 18.51% |
| 13 | Serbia | 18.57% |
| 14 | Czechia | 18.74% |
| 15 | Iceland | 18.82% |
A lower percentage can coexist with a large absolute number of graduates when the tertiary system itself is large. The indicator also does not show whether graduates work in business, administration, finance, accounting or legal occupations after graduation. Workforce analysis requires graduate counts plus employment, occupation and earnings data.
Large tertiary systems occupy very different positions
The United States records 18.51%, the United Kingdom 27.51%, Germany 24.43%, France 35.69%, Australia 33.29%, Canada 25.52%, and India 19.24%.
These percentages describe the field mix, not the volume of graduates. The United States can have a far larger absolute number of field-04 graduates than Monaco despite a much lower percentage because its tertiary system is vastly larger.
A high share is not a business-climate or legal-system score
The indicator measures the composition of tertiary graduation by field of study. It does not measure the number of firms, entrepreneurship, financial-market depth, public-administration efficiency, legal-service quality, employment rates, or wages.
A country at 40% cannot therefore be described as having a better business environment or stronger legal institutions than a country at 20% on the basis of this series. Those questions require direct economic, governance and labour-market indicators.
The synchronized 2023 reference year is a major advantage
All 104 observations use 2023, avoiding the mixed-year problem common in latest-available field-of-study tables. For a composition indicator with many close values, a common reference year improves the quality of cross-country comparison.
Coverage is still incomplete, and national programme classification and reporting practices are not perfectly identical. Missing countries are not assigned zero, and the simple mean is an unweighted average of country rows rather than a graduate-weighted global share.
Data scope and source
The analysis uses 104 national-level 2023 observations from the UNESCO Institute for Statistics official API indicator FOSGP.5T8.F400. The official metric is the percentage of tertiary graduates completing Business, Administration and Law programmes, both sexes combined.
The observed range is 4.98% to 82.41%, with a median of 25.89% and an unweighted mean of 27.00%. Rankings, quartiles and bands are calculated directly from the supplied values. All 104 statistical rows were matched to representative map locations, and missing observations were not converted to zero.
The main takeaway
Monaco has the highest 2023 Business, Administration and Law share among tertiary graduates at 82.41%, followed by Andorra at 59.06% and the Turks and Caicos Islands at 50.00%. The median across 104 observations is 25.89%, with the largest concentration of countries in the 20–29.9% band. The measure describes graduate field composition, not business competitiveness, legal-system quality, employment outcomes, or absolute graduate numbers.
Frequently Asked Questions
Does Business, Administration and Law mean business degrees only?
No. ISCED-F broad field 04 includes accounting, finance, management, marketing, office work, sales-related programmes and law.
Does a 40% value mean 40% of the population has this type of degree?
No. It means 40% of tertiary graduates represented in that year completed programmes in this field group.
Does a higher share mean a better business environment or legal system?
No. The indicator describes graduate field composition, not business conditions, employment outcomes, wages or legal-system performance.
Related Articles
Green Map creates custom-edited map images using open geographic data sources such as geoBoundaries, Natural Earth, OpenStreetMap, and government open data.
These maps are edited visual materials, not raw data files, and are provided for education, documents, presentations, and graphic reference.