UNESCO Institute for Statistics (UIS) data for 2023 show a wide range in the share of secondary teachers who meet their country’s minimum academic qualification requirements. Across the 88 countries and territories with an observation, the median is 97.1%, and 34 report 100%. At the other end, 10 observations are below 50%, with the lowest value at 11.6% in Venezuela. The overall distribution is therefore concentrated near the top but still contains a distinct group with much lower qualification coverage.
The term ‘qualified teacher’ has a specific UIS meaning. It refers to a teacher who has the minimum academic qualifications required to teach at the relevant level, generally in relation to the subject taught, under that country’s standards. This is not identical to being a ‘trained teacher,’ which concerns completion of minimum organized teacher-training requirements. Keeping those concepts separate is essential when interpreting the indicator.
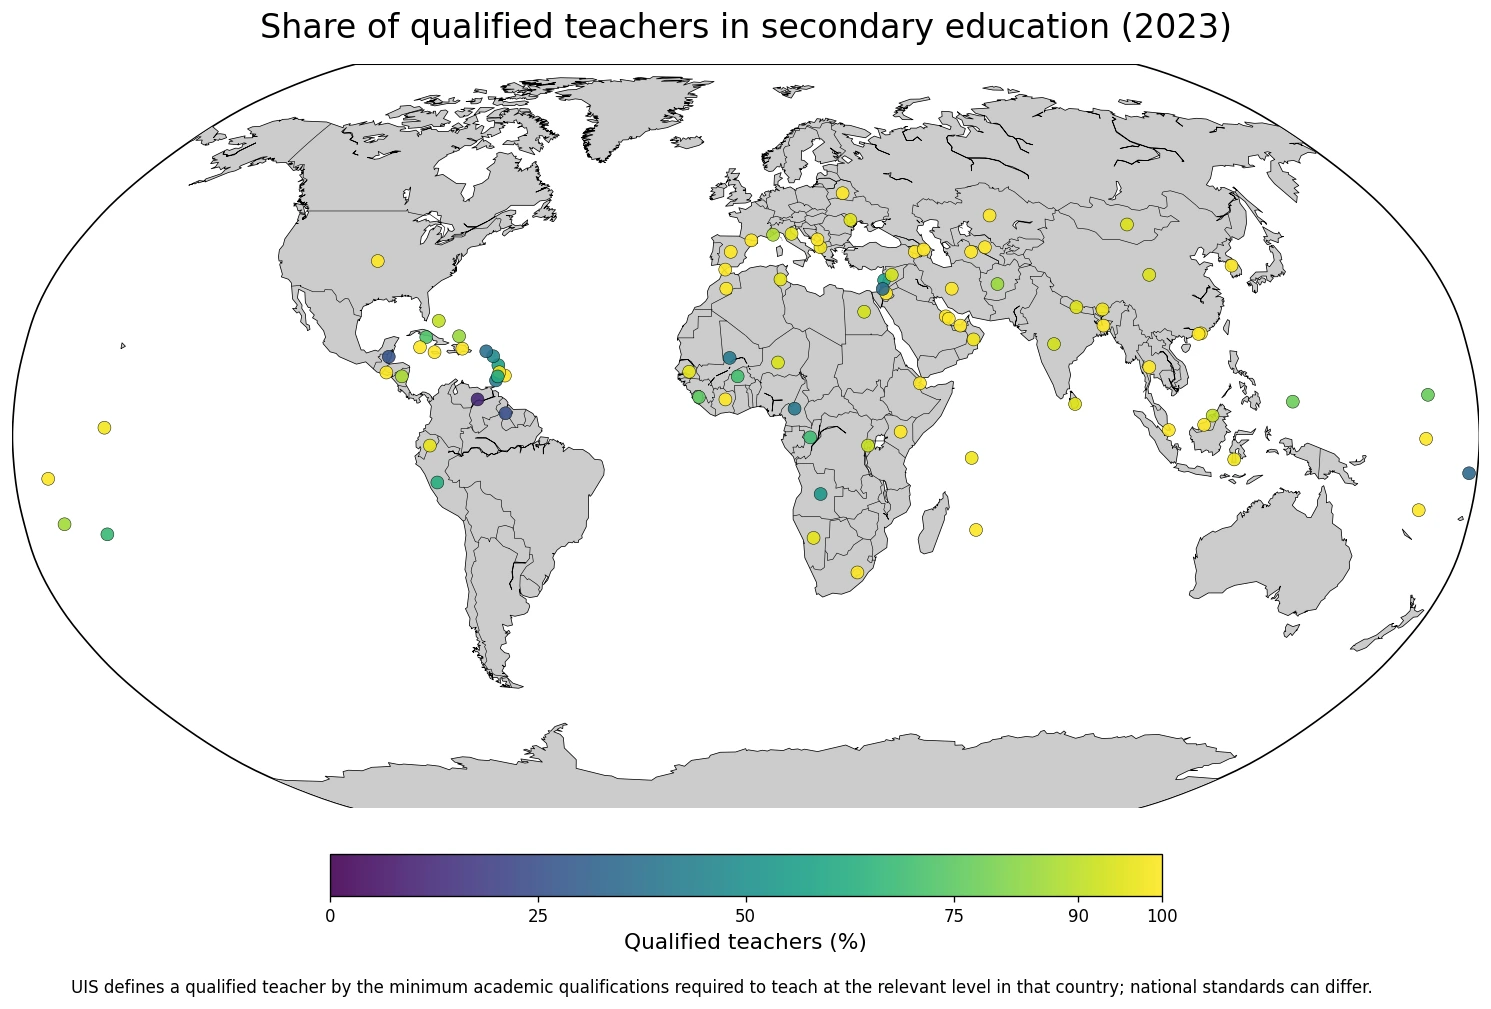
Table of Contents
Thirty-four observations are exactly 100%
34 of the 88 published values are exactly 100%, 52 are at or above 95%, and 61 are at or above 90%. The median of 97.1% reinforces how strongly the available observations are concentrated near full compliance with national minimum academic qualification requirements.
Countries reporting 100% include Andorra, the United Arab Emirates, Armenia, Bangladesh, Bahrain, Barbados, Kenya, Lesotho, Mauritius, Montenegro, Morocco, Jordan, and Jamaica, among others. These observations span several regions. However, because the underlying national qualification standards can differ, a 100% value does not mean that every country is applying the same degree or credential requirement.
Values just below 100% should not be over-ranked
A number of countries sit in the high-90s rather than exactly at 100%. For practical interpretation, the difference between 99.8% and 100% is usually less informative than the broader distinction between near-universal qualification coverage and substantially lower levels. That is why the high end is better read in bands such as 95% or more rather than as a detailed league table.
| Order below 100% | Country or territory | Qualified teachers |
|---|---|---|
| 1 | Belarus | 100.0% |
| 2 | Azerbaijan | 99.9% |
| 3 | Malaysia | 99.9% |
| 4 | Kiribati | 98.4% |
| 5 | Saint Lucia | 98.2% |
| 6 | Seychelles | 98.0% |
| 7 | Oman | 97.9% |
| 8 | Bhutan | 97.9% |
| 9 | Indonesia | 97.8% |
| 10 | Albania | 97.6% |
| 11 | Ecuador | 96.6% |
| 12 | Namibia | 96.5% |
Ten observations are below 50%
10 countries and territories are below the halfway mark. Venezuela is lowest at 11.6%, followed by Guyana at 25.1%, Belize at 26.7%, Tuvalu at 34.1%, Palestine at 35.9%, the British Virgin Islands at 36.9%, Cameroon at 40.6%, Mali at 41.4%, Grenada at 42.0%, and Saint Kitts and Nevis at 48.4%.
| Low-end order | Country or territory | Qualified teachers |
|---|---|---|
| 1 | Venezuela (Bolivarian Republic of) | 11.6% |
| 2 | Guyana | 25.1% |
| 3 | Belize | 26.7% |
| 4 | Tuvalu | 34.1% |
| 5 | Palestine | 35.9% |
| 6 | British Virgin Islands | 36.9% |
| 7 | Cameroon | 40.6% |
| 8 | Mali | 41.4% |
| 9 | Grenada | 42.0% |
| 10 | Saint Kitts and Nevis | 48.4% |
| 11 | Angola | 53.1% |
| 12 | Dominica | 57.1% |
| 13 | Lebanon | 57.6% |
| 14 | Saint Vincent and the Grenadines | 61.2% |
| 15 | Peru | 63.3% |
The low end is geographically diverse, with observations in Latin America and the Caribbean, Africa, and the Pacific. The indicator does not explain why a country’s share is low, so causes should not be inferred from geography alone. Teacher supply, qualification rules, education finance, training systems, recruitment conditions, and reporting coverage would all need separate evidence.
The distribution combines a high ceiling with a long lower tail
The middle half of the observations lies between 83.0% and 100.0%. The upper quartile boundary is 100%, while the lower quartile boundary is about 83.0%. This shows a dataset in which many countries are clustered near 90–100%, but a smaller group extends down through the 70s, 50s, 40s, and even the teens.
| Qualified-teacher share | Countries or territories | Share of observations |
|---|---|---|
| 100% | 34 | 38.6% |
| 95–99.9% | 18 | 20.5% |
| 90–94.9% | 9 | 10.2% |
| 75–89.9% | 8 | 9.1% |
| 50–74.9% | 9 | 10.2% |
| Below 50% | 10 | 11.4% |
The arithmetic mean is 86.0%, below the median of 97.1%, because the relatively small set of low observations pulls the mean downward. For this distribution, the counts at 100%, 90% or more, and below 50% describe the pattern more clearly than the mean alone.
National qualification standards are not identical
The UIS Survey of Formal Education instruction manual defines a qualified teacher as one who has the minimum academic qualifications necessary to teach at a specific level of education in a given country, usually related to the subject taught. The phrase ‘in a given country’ is critical because the required academic credential can vary across national systems.
A 100% result therefore means that all teachers counted in the indicator meet that country’s national minimum academic requirement. It does not establish that every 100% country uses the same degree level, certification structure, or subject requirement. For a strict comparison of qualification standards, the national minimum rules themselves would have to be compared alongside the compliance percentages.
Qualified and trained teachers are different concepts
UIS distinguishes between academic qualification and teacher training. A qualified teacher meets the minimum academic credential required to teach at the level, while a trained teacher has completed the minimum organized teacher-training requirements defined by national policy or law. Training can include pedagogical knowledge, professional knowledge, classroom management, and teaching methods.
A country can therefore show a high qualified-teacher share without necessarily showing the same result on a trained-teacher indicator, and the reverse can also occur. Teacher quality is broader still: academic credentials and training do not fully capture experience, effectiveness, subject knowledge, working conditions, or classroom practice.
A low share is not a direct measure of teaching quality
The indicator is an important measure of staffing conditions, but it does not directly measure student achievement or classroom effectiveness. Meeting the minimum academic requirement does not guarantee identical teaching skill across teachers or countries, and not meeting the formal qualification threshold does not by itself quantify actual classroom performance.
National averages can also hide large internal differences. Rural and urban schools, public and private institutions, or different subnational regions can have very different teacher qualification profiles. A national result of 90% should not be read as proof that every school or district is near 90%.
The map is most useful for locating broad contrasts
The map shows high values spread across multiple world regions, alongside a smaller number of much lower observations that are also geographically dispersed. This means there is no simple single-region explanation for the pattern. The map is useful for locating where large gaps appear, while the explanation for those gaps requires country-specific evidence.
Venezuela, Guyana, and Belize show low observations in the Americas, while Cameroon and Mali are low examples in Africa. At the same time, countries within those same broad regions can report values close to or at 100%. The contrast makes national standards, teacher workforce policy, and recruitment conditions more relevant lines of inquiry than geography alone.
Coverage is limited to the 88 countries and territories with a 2023 value
This comparison includes 88 countries and territories with a 2023 UIS observation. It is not a complete same-year census of every country, so the mean and median calculated here should not be presented as the exact global average for all secondary teachers. Countries without an included value are not assigned zero and are left unplotted.
Reporting systems and participation can also affect which countries appear in a given year. For that reason, the safest interpretation is to describe the distribution among the available observations rather than infer a precise continental or global average beyond the supplied coverage.
Data scope and source
The analysis uses 88 national-level 2023 observations from the UNESCO Institute for Statistics official API indicator QUTP.2T3, titled ‘Percentage of qualified teachers in secondary education, both sexes (%)’. The unit is percent and the indicator covers both sexes.
Missing countries are not converted to zero. The most important interpretation limits are that national minimum academic qualification standards can differ and that a qualified teacher is not the same thing as a trained teacher. Those distinctions should remain visible whenever the percentages are compared across countries.
The main takeaway
The median qualified-teacher share across the 88 available 2023 observations is 97.1%. 34 countries and territories report 100%, and 61 are at or above 90%, yet 10 are below 50% and the minimum is 11.6%. The data therefore show broad high coverage with a smaller but important low-qualification tail. Cross-country rankings should still be interpreted cautiously because each country’s minimum academic standard can differ.
Frequently Asked Questions
What does UNESCO UIS mean by a qualified teacher?
A qualified teacher has the minimum academic qualifications required to teach at the relevant education level and usually the relevant subject under that country's standards.
Is a qualified teacher the same as a trained teacher?
No. Qualified refers to minimum academic credentials, while trained refers to completion of minimum organized teacher-training requirements under national policy or law.
Do countries at 100% have identical qualification standards?
No. A 100% value means all teachers counted meet that country's minimum standard, but the standards themselves can differ across countries.
Related Maps
Green Map creates custom-edited map images using open geographic data sources such as geoBoundaries, Natural Earth, OpenStreetMap, and government open data.
These maps are edited visual materials, not raw data files, and are provided for education, documents, presentations, and graphic reference.