Cross-country comparisons of primary-education finance can be distorted when national spending is converted only at market exchange rates. UNESCO Institute for Statistics (UIS) provides a government-expenditure measure expressed in millions of purchasing-power-parity dollars so that differences in national price levels are reduced. The concept covers general-government spending on primary education, not only a central education ministry. Depending on national institutions, central, regional and local government expenditure can contribute to the total, and the spending concept can include current expenditure, capital expenditure and transfers.
The 2022 comparison set identifies 72 country or area observations for the same indicator and reference year. That coverage should not be interpreted as a complete world total. Nor should a large PPP-dollar total be read as proof that a government gives primary education a higher policy priority. PPP conversion adjusts price levels; it does not divide by population, the number of primary pupils, GDP or the public budget. Large countries and large school systems can therefore record large totals even when their spending intensity is moderate.
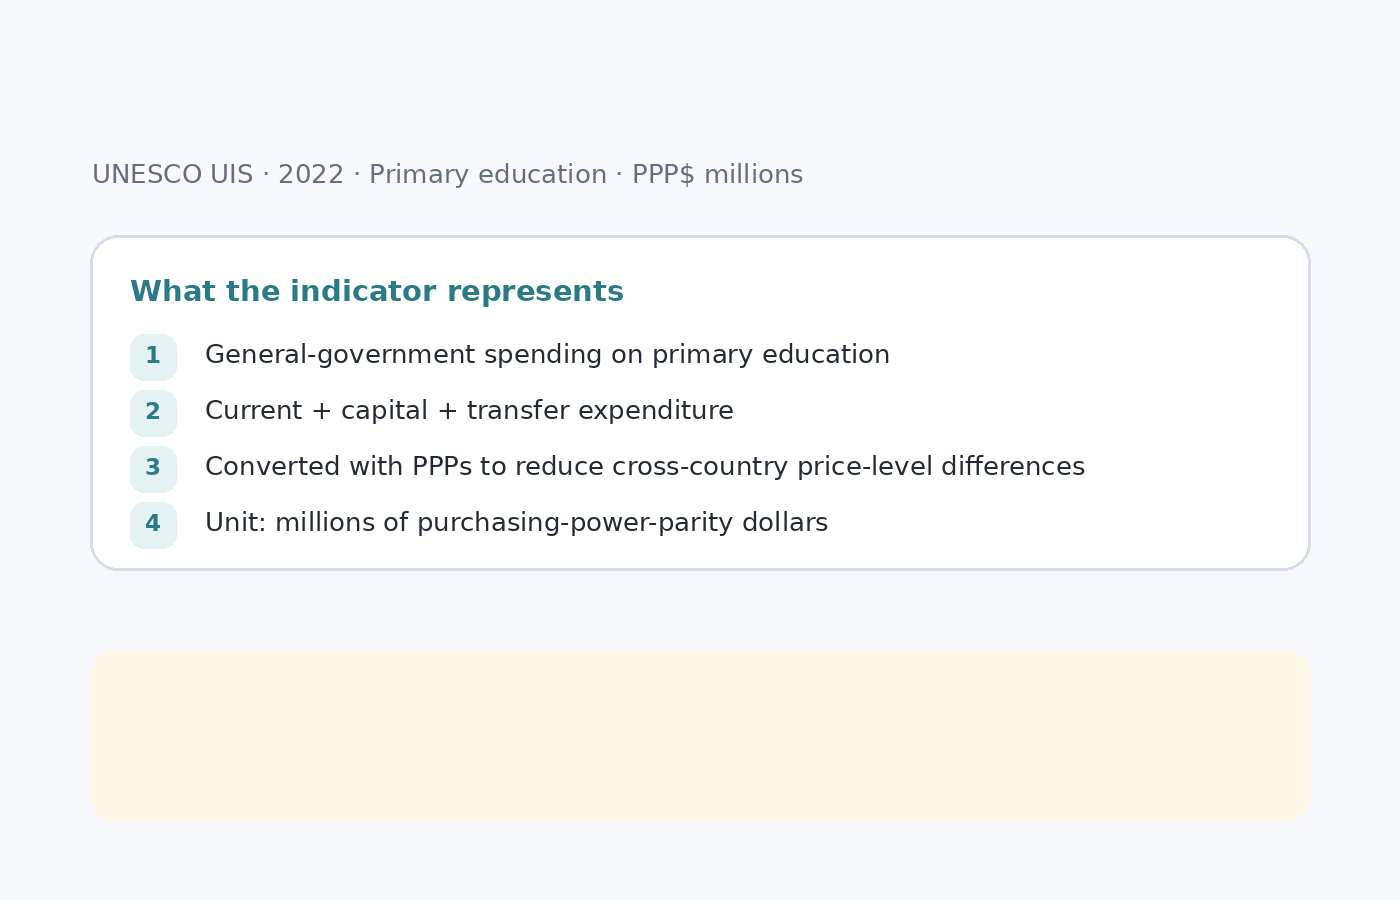
Table of Contents
PPP dollars answer a different question from market-exchange-rate US dollars
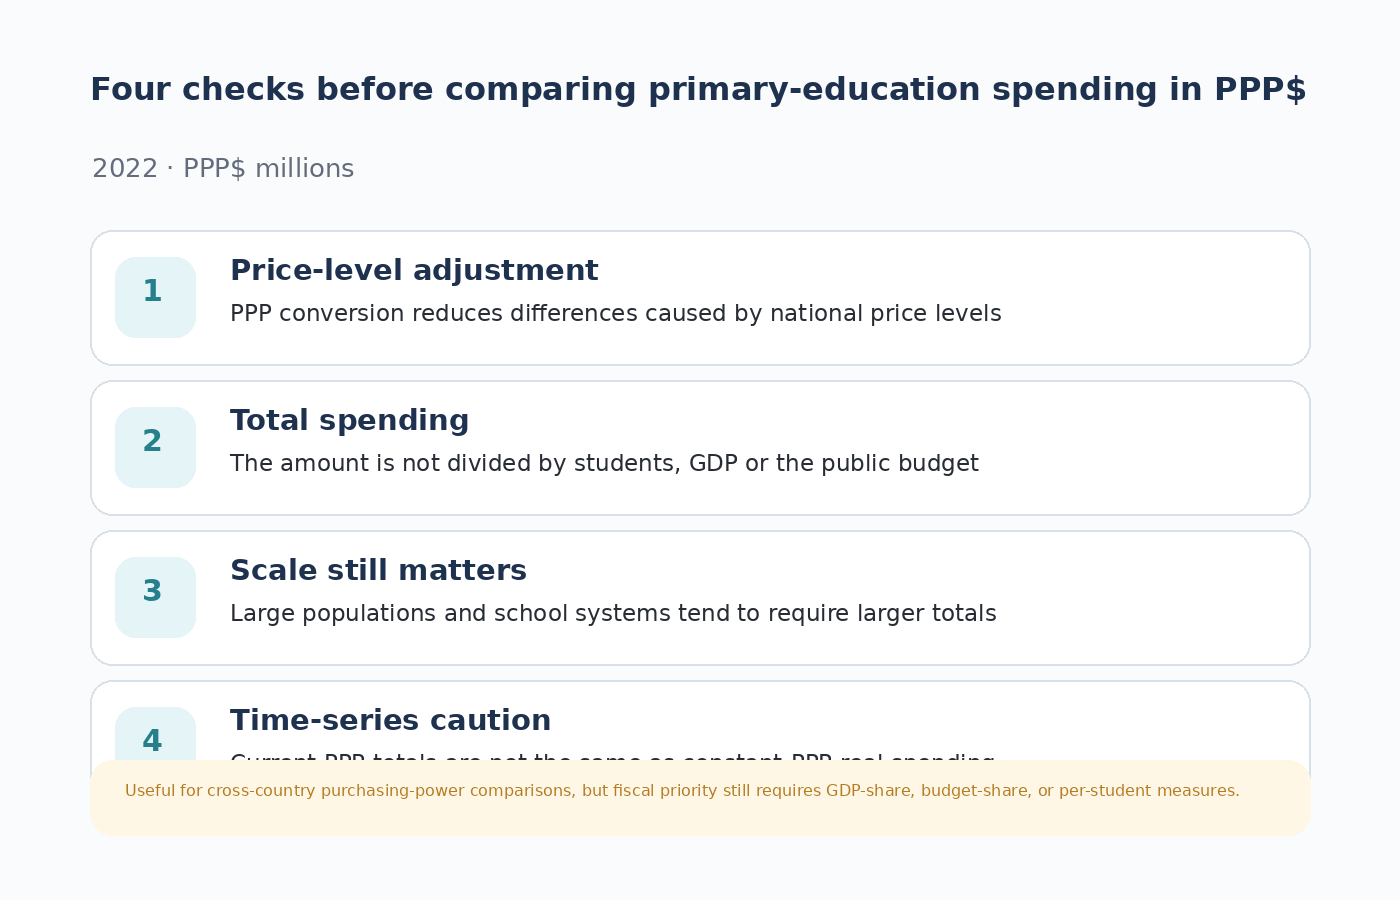
A market exchange rate tells us how currencies trade in foreign-exchange markets. Converting education budgets at that rate can make international totals sensitive to currency appreciation or depreciation. Purchasing power parity instead asks how much currency is needed in each economy to buy a comparable basket of goods and services. A PPP conversion factor is designed to equalize purchasing power across economies, so differences in the converted values are less dominated by national price levels.
That distinction is especially relevant for education because much of the spending pays for domestically produced services. Teacher compensation, local construction, utilities, maintenance and administrative services are purchased largely inside the country. A market-dollar comparison can make those services look unusually cheap in low-price economies. PPP conversion brings the comparison closer to the quantity of goods and services that public spending could purchase domestically, although it remains a broad economy-wide price adjustment rather than a dedicated education-sector price index.
Primary education is harmonized through ISCED level 1
The indicator’s primary-education scope corresponds to ISCED level 1. School systems use different grade structures, entry ages and institution names, so an international comparison cannot assume that a school labelled “primary” has exactly the same duration everywhere. ISCED provides a common classification for the first major stage of formal education that develops basic reading, writing, mathematics and foundational learning. Using ISCED makes the spending level more comparable across different national school structures.
The scope is narrower than total education expenditure. It does not automatically include pre-primary, lower-secondary, upper-secondary or tertiary spending. That matters when a country has a young population and a large primary cohort, when another country has a shrinking cohort, or when responsibilities are distributed differently across levels of government. A primary-education spending total should therefore be compared with other countries only after checking that the education level and government coverage are aligned.
The government-spending concept can include current, capital and transfer expenditure
UIS education-finance concepts are broader than a wage bill. Current expenditure can include compensation, teaching materials, administration and routine operating costs. Capital expenditure can include school buildings and major equipment. Transfers made by government for education purposes can also fall within the spending concept. Funds transferred from international sources to government may be included when they finance education expenditure within the reported scope.
This breadth improves coverage of public financing, but it also means that an unusually large annual change can have many possible explanations. A major school-construction programme, disaster reconstruction, salary reform, decentralization or a change in reported government units can all affect the total. The indicator itself does not identify which component caused a movement. A causal explanation requires national budget detail or metadata rather than inference from the aggregate alone.
PPP conversion does not remove differences in country size
The measure is still an absolute total. A country with a very large population and millions of primary pupils normally requires more schools, more teachers and more operating expenditure than a small country. PPP conversion makes the purchasing power of the money more comparable, but it does not create a denominator. The countries with the largest PPP totals will therefore not necessarily be the countries with the highest resources per pupil.
The same point applies to fiscal priority. If the question is how much of the economy is devoted to education, expenditure as a share of GDP is more appropriate. If the question is how much of the government budget is allocated to education, the denominator should be total government expenditure. If the question is the average amount of public resources associated with each pupil, per-student expenditure is more relevant. PPP totals are useful, but they are one dimension of education finance rather than a universal ranking.
| Measure | Main question | Main caution |
|---|---|---|
| PPP$ total | How large is public primary-education spending after adjusting for price-level differences? | Country size and pupil numbers still matter |
| Nominal US$ total | How large is the spending total at market exchange rates? | Strongly affected by exchange rates and scale |
| Share of GDP | How large is education spending relative to the economy? | The denominator changes with GDP |
| Share of government spending | How much fiscal priority does education receive within the budget? | Depends on the structure of total public expenditure |
| Per-student spending | How much public resource is associated with each learner? | Enrollment definitions and level coverage must match |
Current PPP and constant PPP are not interchangeable in time-series analysis
The word PPP does not by itself make a series a real, inflation-adjusted time series. UIS distinguishes expenditure expressed in PPP dollars from expenditure expressed in constant PPP dollars. A current-PPP measure is useful for comparing purchasing-power-adjusted totals across economies for a given reference period. A constant-PPP measure is better suited to questions about whether the real volume of public resources changed through time because it also addresses price changes across years according to the relevant constant-price methodology.
PPP conversion factors can also be revised when new international benchmark comparisons or national accounts revisions become available. Historical values may therefore move between data vintages. Long-run comparisons are safer when all years come from the same release and the same methodological basis. Mixing values downloaded at different times can combine genuine fiscal change with statistical revisions.
The 72 observations in 2022 are a reporting set, not a world total
The 72 country or area observations identified for 2022 describe the economies with a comparable value in that reference year. A missing value is not zero. It can indicate that no comparable observation was reported, validated or available under the same conditions. Replacing missing countries with zero would create a false claim about their education finance.
The same rule applies to maps and global aggregates. A country should be shown as no data when its value is missing, not placed in the lowest spending class. Adding the available 72 values would produce the sum for the reporting set, not necessarily global government spending on primary education. A true global total would require complete and methodologically compatible country coverage or an official aggregate designed for that purpose.
Higher spending does not directly measure learning outcomes or efficiency
Government primary-education expenditure is an input measure. It does not directly measure literacy proficiency, mathematics achievement, school completion, attendance, teacher effectiveness or equity. Two countries with similar PPP totals can have very different numbers of pupils, teacher salaries, geographic costs, school infrastructure needs and private-sector participation. A higher total is not evidence by itself that public money is used more efficiently, and a lower total is not proof that learning outcomes are weak.
A stronger analysis combines finance measures with participation and outcome indicators. Enrollment describes the size of the current school population, completion measures school progression, learning assessments measure skills, and adult attainment captures the accumulated educational history of older cohorts. Those indicators operate on different time horizons. A 2022 spending figure should not be presented as the direct cause of an adult-attainment percentage built from decades of schooling history.
Choose the denominator before choosing the ranking
The clearest way to compare education finance is to start with the policy question. Use a PPP total when the goal is to compare the purchasing-power-adjusted size of public resources available to primary education. Use a GDP ratio when the question is fiscal effort relative to the economy. Use a government-budget share when the question is priority among public functions. Use per-student expenditure when the school population should be taken into account.
These measures should not be mechanically combined when their reference years, education levels or institutional coverage differ. Dividing a primary-education PPP total by a pupil count from another year can create an unofficial per-student figure that the source does not support. Likewise, subtracting a total-education GDP ratio from a primary-level measure mixes different numerators and denominators. The safest comparison keeps year, level, unit and government coverage aligned.
Source and interpretation notes
The source indicator is UNESCO UIS government expenditure on primary education in millions of PPP dollars, internally identified as X.PPP.1.FSGOV. The UIS Data Browser Glossary defines purchasing power parity as a currency-conversion approach that removes differences in national price levels and defines government education expenditure as general-government current, capital and transfer spending. For a denominator-based comparison, Green Map’s government education spending as a share of GDP article illustrates how a ratio answers a different question from an absolute PPP total.
Frequently Asked Questions
What does government primary-education spending in PPP dollars measure?
It measures general-government spending on primary education after conversion with purchasing-power-parity rates to reduce differences in national price levels. The unit is millions of PPP dollars.
Does a larger PPP total mean a country gives primary education a higher priority?
Not necessarily. PPP adjusts price levels but does not adjust for population, pupil numbers or economic size. GDP-share or government-budget-share measures address fiscal priority more directly.
Is a PPP-dollar series automatically inflation-adjusted over time?
No. A current PPP series is different from a constant-PPP series. Constant PPP is more appropriate for analyzing real changes across years.
Do countries without a 2022 observation have zero spending?
No. Missing data must remain separate from zero because the absence of a comparable value does not mean the government spent nothing.
Related Articles
- Government Education Spending as % of GDP | World Map
- Primary Education Attainment Map | Adults 25+ by Country
- Global Lower-Secondary-or-Higher Attainment Map | Adults 25+ by Country
Green Map creates custom-edited map images using open geographic data sources such as geoBoundaries, Natural Earth, OpenStreetMap, and government open data.
These maps are edited visual materials, not raw data files, and are provided for education, documents, presentations, and graphic reference.