A simple count of women and men studying abroad does not fully describe gender balance in international student mobility. Countries begin with different gender compositions in tertiary education: in some systems women make up a larger share of tertiary students, while in others men do. UNESCO Institute for Statistics (UIS) uses an adjusted gender parity index (GPIA) to compare mobility patterns while taking the underlying gender composition of tertiary enrolment into account.
The indicator examined here is OE.5T8.40535.GPIA. It focuses on outbound internationally mobile tertiary students from each origin country whose destination is South and West Asia. The 2023 country-level series associated with this indicator contains 105 observations. GPIA is an index of relative gender balance, not a count of students, so a larger index value does not automatically mean that more students studied in the destination region.
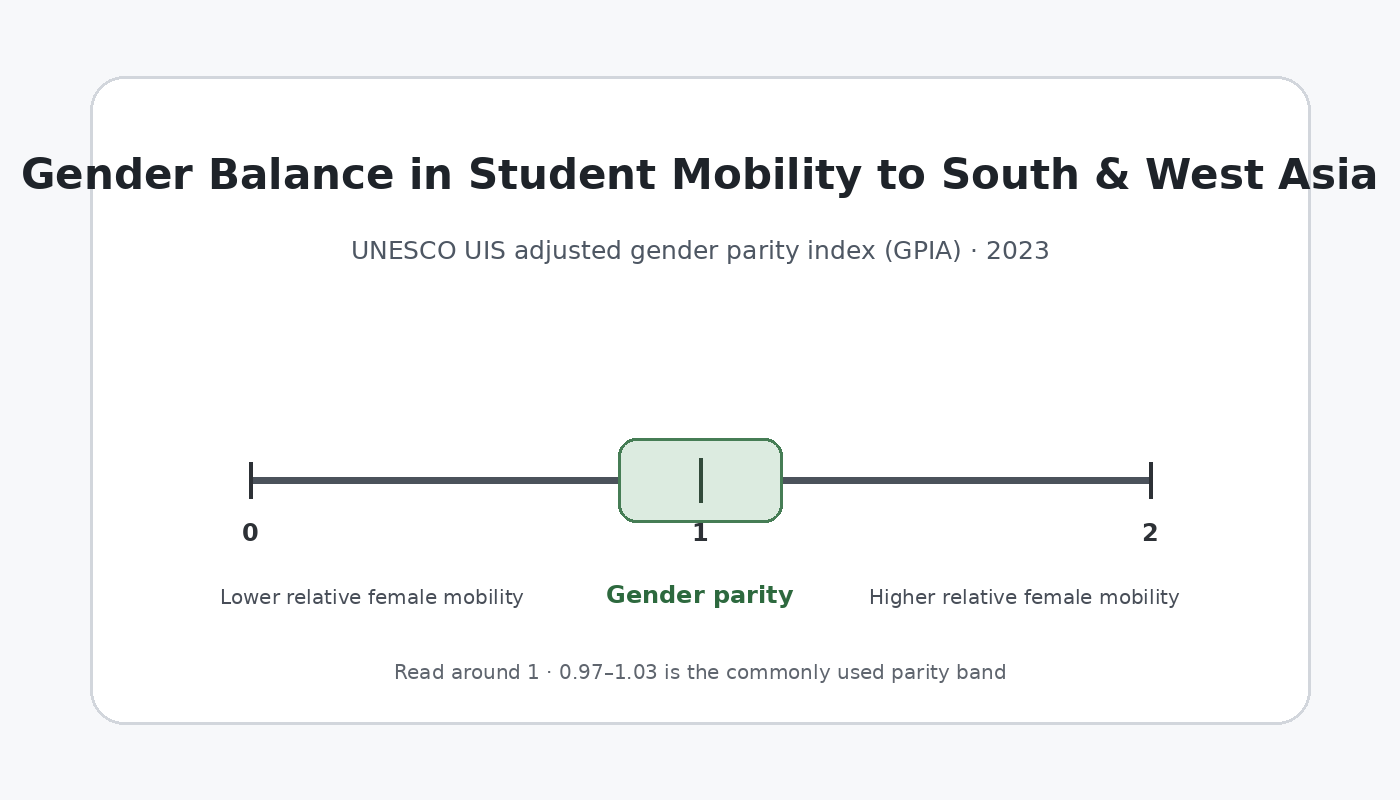
Table of Contents
Internationally mobile students are defined by cross-border study, not simply nationality
UIS defines internationally mobile students as people who physically cross an international border for educational purposes and study in a destination country that differs from their country of origin. For tertiary students, the country of origin is normally the country where the student obtained the upper-secondary qualification that provided access to tertiary education. Where that cannot be operationalized, usual residence may be used, with citizenship as a last-resort proxy.
That definition matters because an international programme is not automatically international student mobility. A student who remains in the origin country while taking distance courses from a foreign institution has not crossed a border for study. Likewise, studying at a foreign institution’s local branch without an international move does not meet the mobility definition. The indicator therefore describes physical student movement rather than a general measure of foreign curriculum exposure or citizenship.
South and West Asia is the destination region in this indicator
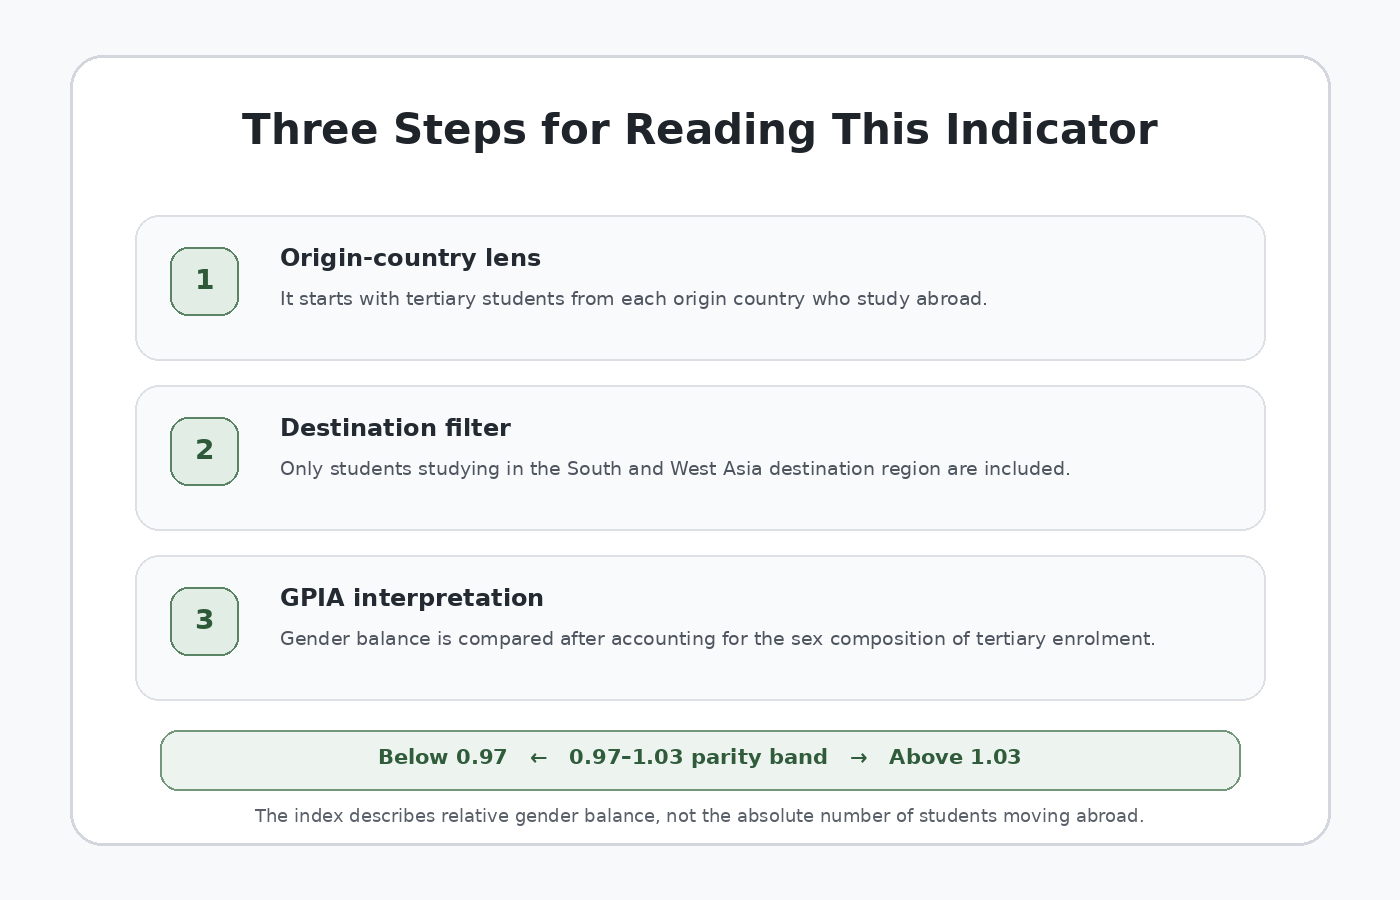
The phrase “studying in South and West Asia” can easily be misread as a description of the students’ origin. It is instead a destination filter. Each row begins with an origin country and looks at tertiary students from that country who are studying abroad; among them, the indicator isolates those studying in the South and West Asia destination region and assesses the gender balance of that mobility flow.
A country can therefore have a large number of outbound students overall but relatively few who choose South and West Asia. Another country can have a smaller outbound population yet a more concentrated connection to this destination region. Total outbound mobility, destination choice and gender balance answer different questions and should not be collapsed into a single ranking.
A GPIA near 1 indicates gender parity
A conventional gender parity index compares the female value of an indicator with the male value. The adjusted version is designed so that disparities favoring women and disparities favoring men can be interpreted more symmetrically around 1. For outbound student mobility, UNESCO’s 2026 higher-education trends report describes the adjusted index as a female-to-male mobility comparison that accounts for gender imbalances in the overall tertiary enrolment population.
A value close to 1 therefore indicates that women and men are represented in mobility to South and West Asia in broadly similar proportions after the adjustment. Values below 1 point toward relatively lower female mobility, while values above 1 point toward relatively higher female mobility. UIS materials commonly use 0.97 to 1.03 as the gender-parity band so that tiny differences around 1 are not turned into artificial gaps.
| GPIA range | Interpretation for mobility to South and West Asia |
|---|---|
| Below 0.97 | Relative female mobility is lower than male mobility |
| 0.97–1.03 | Commonly interpreted as the gender-parity range |
| Above 1.03 | Relative female mobility is higher than male mobility |
This is not a performance ladder. A value of 1.08 is not inherently “better” than 1.01, and a value below 1 is not evidence that an entire higher-education system performs poorly. The index speaks narrowly to relative gender balance in a particular mobility flow. Quality, access, completion, affordability and the absolute volume of student mobility require separate indicators.
GPIA and the female share of mobile students answer different questions
Suppose women make up 60% of tertiary enrolment in an origin country but only 50% of students going to a particular destination. A simple destination count might look perfectly balanced because women and men are present in equal numbers, yet women are underrepresented relative to their share of the tertiary student base. In a country where women are a smaller share of tertiary enrolment, the same 50% destination share would have a different interpretation.
This is why the adjusted index is useful. Rather than asking only “what percentage of these mobile students are women?”, it asks whether women’s and men’s participation in the mobility flow is balanced relative to the underlying tertiary education population. For policy analysis, GPIA is most informative when read alongside female and male student counts, total tertiary enrolment by sex and the broader outbound mobility ratio.
International student mobility was already a major global phenomenon in 2023
UNESCO’s 2026 Higher Education Global Trends Report estimates that about 7.3 million tertiary students were studying abroad in 2023, more than three times the roughly 2.1 million recorded in 2000. Even after that rapid expansion, internationally mobile students accounted for just under 3% of global higher-education enrolment, showing that cross-border study remains important but far from universal.
The report identifies East Asia and the Pacific as the largest sending region, with 26% of outbound students, followed by South and West Asia at 21% and Western Europe and North America at 14%. Those figures describe where outbound students come from. They should not be confused with OE.5T8.40535.GPIA, which uses South and West Asia as the destination and compares gender balance among students going there.
UNESCO also reports that women account for nearly 49% of the internationally mobile student population overall. A near-even global share does not imply that every origin country, destination region or bilateral mobility corridor is gender-balanced. Differences in fields of study, scholarships, language, cost, family circumstances, visa rules, geographic distance and educational networks can produce very different patterns at the country and destination level.
Coverage of 105 observations is not complete world coverage
The 2023 destination-specific series contains 105 national observations. That is substantial cross-country coverage, but it does not mean that every country reported a comparable value. A missing observation is not a zero and should never be assigned a parity status, color or rank by assumption. Any world visualization based on the series should preserve missing data explicitly.
The row count also should not be transformed into a global student-weighted conclusion. A simple average of country-level GPIA values would give a very populous origin country and a small origin country the same weight. Estimating the gender balance of all students moving to the destination region would require the relevant student counts or another defensible weighting scheme.
The index does not identify why a gender gap exists
A GPIA far from 1 can reveal a disparity, but it cannot establish its cause. Destination choice may be shaped by scholarship programmes, subject specialization, tuition, language, geographic proximity, migration networks, family expectations, safety, visa policy, recognition of qualifications, labour-market opportunities or agreements between institutions and governments.
Testing any of those explanations requires additional evidence linked to the same origin countries and reference period. It would be speculative to attribute a low value automatically to family restrictions or safety concerns, just as it would be unwarranted to treat a high value as proof that a particular mobility policy succeeded. GPIA is a descriptive signal that can guide further investigation, not a causal model.
Comparing destination-specific and all-destination indicators adds context
A useful next step is to compare the South and West Asia GPIA with the all-destination outbound GPIA, the total number of outbound students, the outbound mobility ratio and destination-specific counts. If an origin country is close to gender parity across all outbound mobility but shows a large gap for one destination region, the pattern may point toward destination selection rather than a general mobility gap.
If similar disparities appear across many destination regions, the broader structure of outbound opportunity may deserve more attention. Even then, the conclusion should be based on the underlying female and male series rather than one derived index. Destination-specific GPIA is best treated as one layer of a larger mobility profile.
Four checks make comparisons safer
- Reference year: do not mix observations from different years and label the result as a synchronized ranking.
- Destination scope: distinguish the South and West Asia destination series from all-destination outbound mobility.
- Underlying volume: countries with similar GPIA values can have very different numbers of mobile students.
- Missing data: unreported observations are not zeros and should remain explicitly missing in tables and maps.
Data source and interpretation limits
The primary statistical source is the UNESCO Institute for Statistics Data Browser. UIS defines internationally mobile students in its glossary, and destination-specific outbound student indicators are organized under the Data Browser’s Outbound students section. The indicator code used here is OE.5T8.40535.GPIA for reference year 2023.
Global context and the description of adjusted gender parity in outbound mobility are drawn from UNESCO IESALC’s 2026 Higher Education Global Trends Report. UIS databases are revised periodically, so the reference year and extraction date should remain attached to future country-level analyses. Sources were checked on 14 September 2026.
Frequently Asked Questions
Does a GPIA of 1 mean the numbers of female and male mobile students are exactly equal?
Not necessarily. The adjusted measure considers the gender composition of the underlying tertiary enrolment population, so it is not the same as a simple one-to-one count.
Is South and West Asia the students’ origin region in this indicator?
No. It is the destination region. Each country is treated as an origin, and the series focuses on its outbound tertiary students who study in South and West Asia.
What does the 0.97–1.03 range mean?
UIS commonly uses this interval as the gender-parity band. Values farther from 1 indicate a larger relative gender disparity.
Should countries with no observation be treated as zero?
No. Missing or unreported observations are not zero mobility and must remain explicitly missing in comparisons and visualizations.
Related Articles
- Bachelor’s-or-Higher Educational Attainment by Country
- Education-Field Share Among Tertiary Graduates by Country
- Engineering, Manufacturing & Construction Share of Tertiary Graduates
Green Map creates custom-edited map images using open geographic data sources such as geoBoundaries, Natural Earth, OpenStreetMap, and government open data.
These maps are edited visual materials, not raw data files, and are provided for education, documents, presentations, and graphic reference.