The share of pre-primary teachers who meet their country’s minimum teacher-training requirements varies dramatically across the UNESCO Institute for Statistics (UIS) observations for 2024. The verified dataset contains 70 countries and separately reported areas. Its median is 92.05%, while the unweighted mean is 80.35%. Twenty-two observations are exactly 100%, yet the lower end falls to about 8%. The same-year spread is therefore far wider than a simple headline about “qualified teachers” might suggest.
The official series is Proportion of teachers with the minimum required qualifications in pre-primary education, both sexes (%), UIS indicator TRTP.02. Under current SDG 4.c.1 metadata, the concept refers to teachers who have received at least the minimum organized pedagogical teacher training, before or during service, required to teach at the relevant education level in that country. It is not simply a count of university degrees, and it should not be confused with a separate measure of teachers who meet national academic-qualification standards.
The most important comparability warning is built into the official metadata: national minimum training requirements can differ widely. A country reporting 100% has reached its own stated minimum across the teachers covered by the indicator, but that does not prove that its minimum requirement is more demanding than another country’s. For that reason, this analysis describes the distribution of national-standard attainment rather than turning the percentages into a global league table of teacher quality.
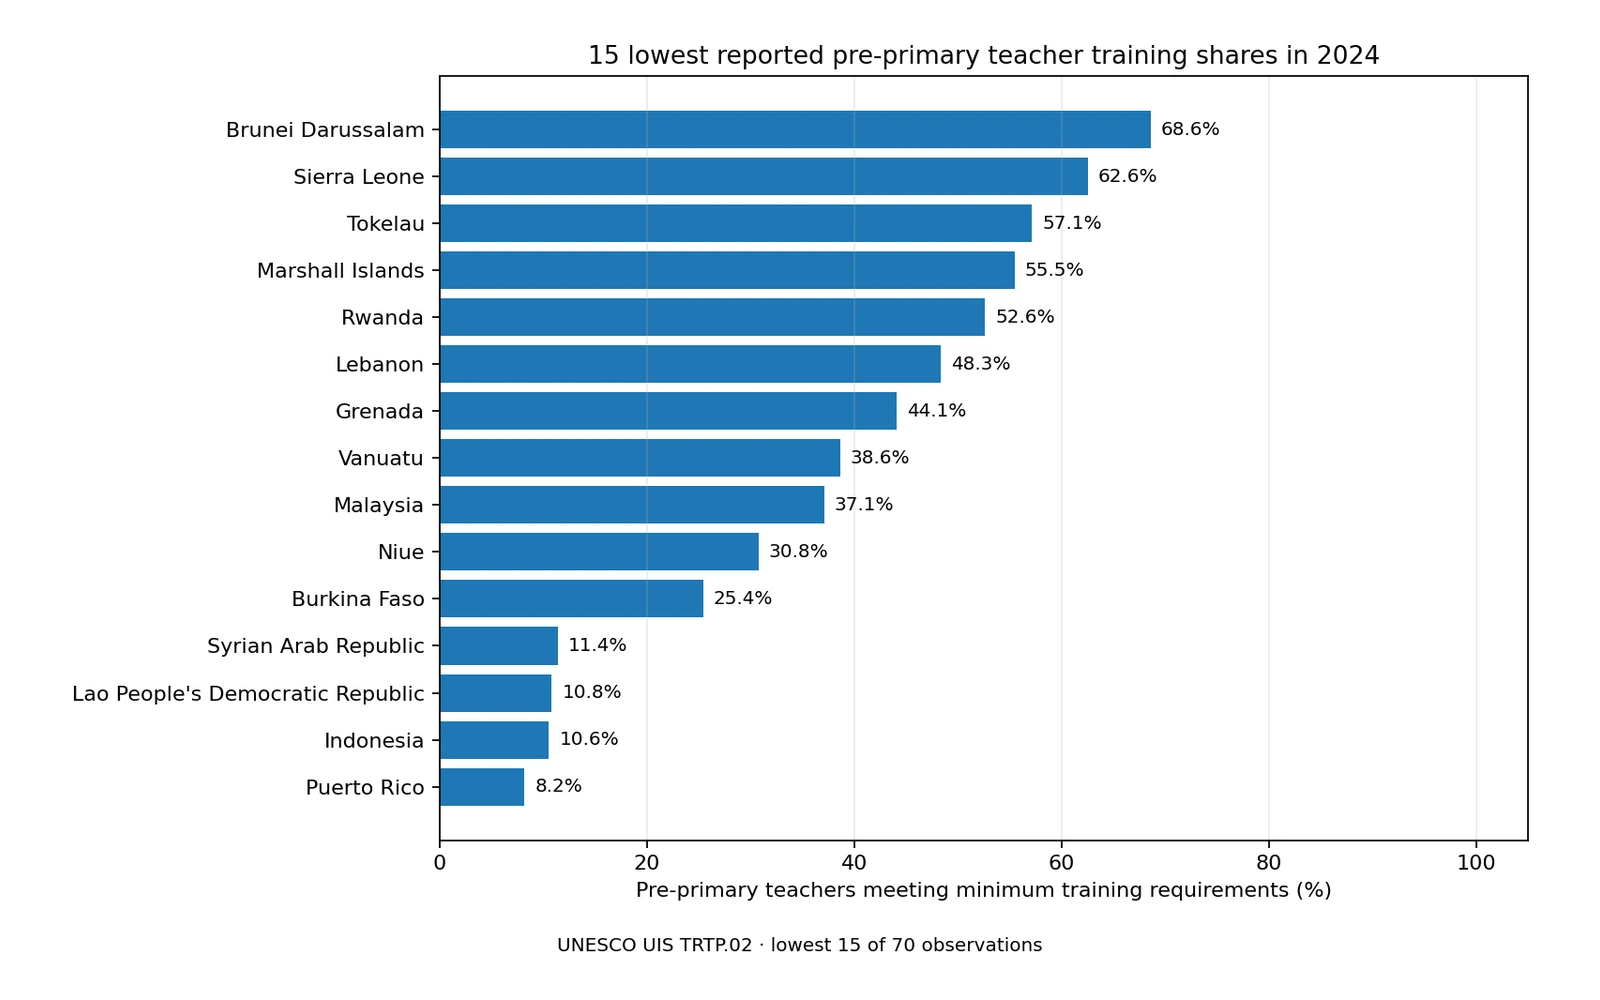
Table of Contents
What the minimum-requirement indicator measures
For SDG indicator 4.c.1, the numerator is the number of teachers at a given education level who have received the minimum organized pedagogical training required to teach at that level, and the denominator is the total number of teachers at the same level in the same academic year. TRTP.02 selects pre-primary education, corresponding to ISCED 02, and combines female and male teachers in the “both sexes” category. A value of 90% therefore means that about 90 of every 100 teachers included in the pre-primary count meet the nationally specified minimum training requirement.
The wording “minimum required qualifications” can be misleading if it is read as an academic-degree statistic. UIS describes 4.c.1 as a trained-teacher indicator centered on organized pedagogical teacher training. Academic qualifications and subject knowledge matter for the teaching profession, but UIS also maintains separate concepts for qualified teachers under national standards. The distinction matters when interpreting country values and when connecting this series to other teacher indicators.
Pre-primary systems also differ institutionally more than many later school levels. Early childhood provision can be organized through preschools, kindergartens, education ministries, local governments, social-service systems and private providers. ISCED gives an international framework for classifying education levels, but national teacher pathways, licensing systems and training durations remain different. The indicator therefore standardizes the percentage calculation more strongly than it standardizes the content of the national requirement itself.
The median is 92.05%, but the mean is only 80.35%
Across all 70 observations, the unweighted mean is 80.35% and the median is 92.05%. The first quartile is 72.92% and the third quartile is 100.00%. In other words, half of the reported country and area values lie roughly between 72.92% and 100%, while the upper quarter is entirely at the 100% ceiling. The minimum, however, is only 8.21%, producing a long lower tail.
| Share meeting the minimum requirement in 2024 | Countries/areas | Share of 70 |
|---|---|---|
| 100% | 22 | 31.4% |
| 90% to <100% | 16 | 22.9% |
| 75% to <90% | 13 | 18.6% |
| 50% to <75% | 9 | 12.9% |
| 25% to <50% | 6 | 8.6% |
| Below 25% | 4 | 5.7% |
Twenty-two observations are exactly 100%, and 38 of 70, or 54.3%, are at least 90%. Expanding the threshold to 75% captures 51 observations, or 72.9%. At the opposite end, 10 observations are below 50% and four are below 25%. The concentration near the top combined with a relatively small set of very low values explains why the mean is almost 12 percentage points below the median.
The 80.35% mean is not a teacher-weighted world average. Each reporting country or area contributes one percentage with equal weight, regardless of whether its pre-primary workforce contains a few hundred teachers or several hundred thousand. A global teacher-level percentage would require the actual number of pre-primary teachers in each reporting system as weights. The statistics here summarize the distribution of the reported national and area percentages only.
The lower tail ranges from about 8% to just under 50%
Puerto Rico has the lowest reported value in the 2024 set at 8.21%. Indonesia is 10.56%, the Lao People’s Democratic Republic 10.83%, and the Syrian Arab Republic 11.44%. Burkina Faso is 25.42%, Niue 30.77%, Malaysia 37.10%, Vanuatu 38.65%, Grenada 44.11%, and Lebanon 48.33%. These ten observations form the entire group below 50%.
| Country/area | Teachers meeting the minimum requirement |
|---|---|
| Puerto Rico | 8.2% |
| Indonesia | 10.6% |
| Lao People’s Democratic Republic | 10.8% |
| Syrian Arab Republic | 11.4% |
| Burkina Faso | 25.4% |
| Niue | 30.8% |
| Malaysia | 37.1% |
| Vanuatu | 38.6% |
| Grenada | 44.1% |
| Lebanon | 48.3% |
Because all 70 observations use 2024 as the reference year, the table avoids one common problem in international education comparisons: mixing a country’s recent value with another country’s much older latest observation. Yet the synchronized year does not eliminate the underlying policy-definition issue. A nationally required training programme may differ in duration, academic level, practicum requirements and the treatment of in-service preparation.
A low percentage should not be translated into a claim that most teachers are ineffective or incapable. It means that, within the reporting framework, a relatively small share of teachers counted at the pre-primary level are reported as meeting that system’s minimum organized teacher-training requirement. Understanding why requires country-specific evidence about training routes, provisional teachers, private-sector coverage, workforce shortages, certification reform and the administrative definition of a teacher.
Twenty-two observations are tied at 100%, so the top is not a meaningful ranking
Andorra, Bahrain, Bhutan, Algeria, Jordan, Kazakhstan, Cambodia, Qatar, Saudi Arabia, Thailand and several other reporting systems are at 100%. The Republic of Korea is also reported at 100% in the 2024 dataset. These ties mean there is no statistical basis in TRTP.02 alone for ranking one 100% country above another.
More importantly, “100% of teachers meet the national minimum” is different from “this country has the highest minimum training standard.” UIS explicitly notes that minimum teacher-training requirements vary widely across countries. A serious comparison of the substance of teacher preparation would need information on the required qualification level, duration of pre-service preparation, supervised teaching practice, in-service requirements, licensing and continuing professional development.
National standards limit fine-grained international comparisons
The limitation section of the UIS metadata is unusually important for this series. The indicator shows the percentage reaching national standards, but national standards are not automatically equivalent. This weakens its usefulness for fine-grained global comparisons because two teachers counted as “meeting the minimum” in different countries may have completed very different training pathways. UIS has worked on international classifications of teacher-training programmes partly to make those differences more transparent.
As a result, small gaps such as 92% versus 95% should not be treated as precise evidence that one system has better-prepared teachers. Large gaps can still flag major differences in the share of the workforce that meets each system’s own requirement, but the indicator cannot identify the cause. It does not reveal whether a low percentage reflects rapid expansion of pre-primary services, teacher shortages, changes in certification rules, the inclusion of assistants or private providers, or other institutional factors.
The “both sexes” label is another boundary. It combines women and men. A country with a 90% overall value could still have a gender difference in training coverage. Gender-specific analysis requires the female and male series separately rather than assuming that the combined percentage applies equally to both groups.
The indicator does not measure teacher supply, class size or learning outcomes
TRTP.02 is a composition measure, not a headcount of available teachers. It does not tell us how many pre-primary teachers a country has, whether there are enough teachers for the number of children enrolled, how many children each teacher serves, how much teachers are paid, or how often they leave the profession. A system can have a high minimum-training share and still face severe teacher shortages, while another can have adequate staffing but a lower share meeting the national training requirement.
It is also not a direct measure of children’s learning or school readiness. The policy logic behind 4.c.1 is that well-prepared teachers are important for education quality, but the percentage itself does not measure language development, numeracy, socio-emotional skills, later achievement or completion. A broader assessment of pre-primary education should combine teacher preparation with participation, child-teacher ratios, public-private provision, financing, facilities, curriculum and learning-environment measures.
Related indicators can add context without becoming substitutes. The private share of pre-primary enrolment describes who operates institutions, not whether their teachers meet training requirements. The share of tertiary graduates in Education describes the composition of higher-education graduates, not the current credential profile of the pre-primary workforce. Government education spending describes fiscal effort relative to the economy. Each answers a different question.
Why SDG 4.c.1 tracks teacher preparation
SDG target 4.c calls for a substantial increase in the supply of qualified teachers by 2030, including through international cooperation for teacher training in developing countries, particularly least developed countries and small island developing States. Indicator 4.c.1 tracks one part of that agenda by looking at the proportion of teachers who meet minimum training requirements at pre-primary, primary, lower-secondary and upper-secondary levels.
The pre-primary component is especially useful because expanding access for young children can create rapid demand for additional staff. A high percentage indicates broad compliance with the national minimum training requirement among the teachers counted, but it still needs to be read alongside the number of teachers and the size of enrolment. A system can increase access quickly and temporarily face a gap between workforce expansion and formal training coverage.
Source and calculation method
The statistical source is UNESCO Institute for Statistics indicator TRTP.02. The official SDG 4.c.1 metadata defines the measure as the percentage of teachers at the relevant education level who have received at least the minimum organized pedagogical teacher training required in the country, using administrative data from schools and other organized learning centres. The definition, calculation method and limitations are documented in the UIS metadata for SDG 4.c.1, while the broader framework is listed on the UIS SDG 4 indicators page.
This analysis uses the 70 verified national and separately reported area rows dated 2024 from the UIS API for TRTP.02. Missing values are not converted to zero. Source percentages are used directly. The mean, median, quartiles, threshold counts and lower-tail ranking are calculated from those 70 observations, with every reporting unit receiving equal weight.
Frequently Asked Questions
What does the pre-primary minimum teacher-training share measure?
It is the percentage of pre-primary teachers who meet the minimum organized pedagogical teacher-training requirement specified for that level in their reporting country or area.
Does a 100% value mean the country has the world’s highest teacher standard?
No. It means all teachers covered by the indicator meet that system’s minimum requirement. The content and level of national minimum requirements can differ substantially across countries.
How many 2024 observations are included?
The verified TRTP.02 dataset contains 70 countries and separately reported areas, all dated 2024. Twenty-two report exactly 100%, and 38 are at or above 90%.
Is the 80.35% mean a global teacher-weighted average?
No. It is an unweighted average of 70 country and area percentages. A global teacher-level rate would need the number of pre-primary teachers in each reporting system as weights.
Related Articles
- Education-field share among tertiary graduates
- Private share of pre-primary enrolment
- Government education spending as a share of GDP
Green Map creates custom-edited map images using open geographic data sources such as geoBoundaries, Natural Earth, OpenStreetMap, and government open data.
These maps are edited visual materials, not raw data files, and are provided for education, documents, presentations, and graphic reference.