By the end of lower secondary education, students are expected to do more than decode individual words. They should be able to connect information across a text and understand central ideas. UNESCO Institute for Statistics (UIS) indicator READ.LOWERSEC measures the proportion of students at the end of lower secondary education who reach at least the minimum proficiency level in reading. The verified 2022 dataset contains 79 countries and separately reported areas, with values ranging from 7.92% to 88.83%. The median is 62.37% and the simple unweighted mean is 58.02%.
This is not a literacy rate for the whole population, and it is not the percentage of people who say they can read. It is a learning-outcome measure tied to assessment results and the internationally defined Minimum Proficiency Level (MPL). Under SDG indicator 4.1.1, UIS monitors minimum proficiency in reading and mathematics at several points in schooling, including the end of lower secondary education. The READ.LOWERSEC series used here is the reading measure for that stage and combines both sexes.
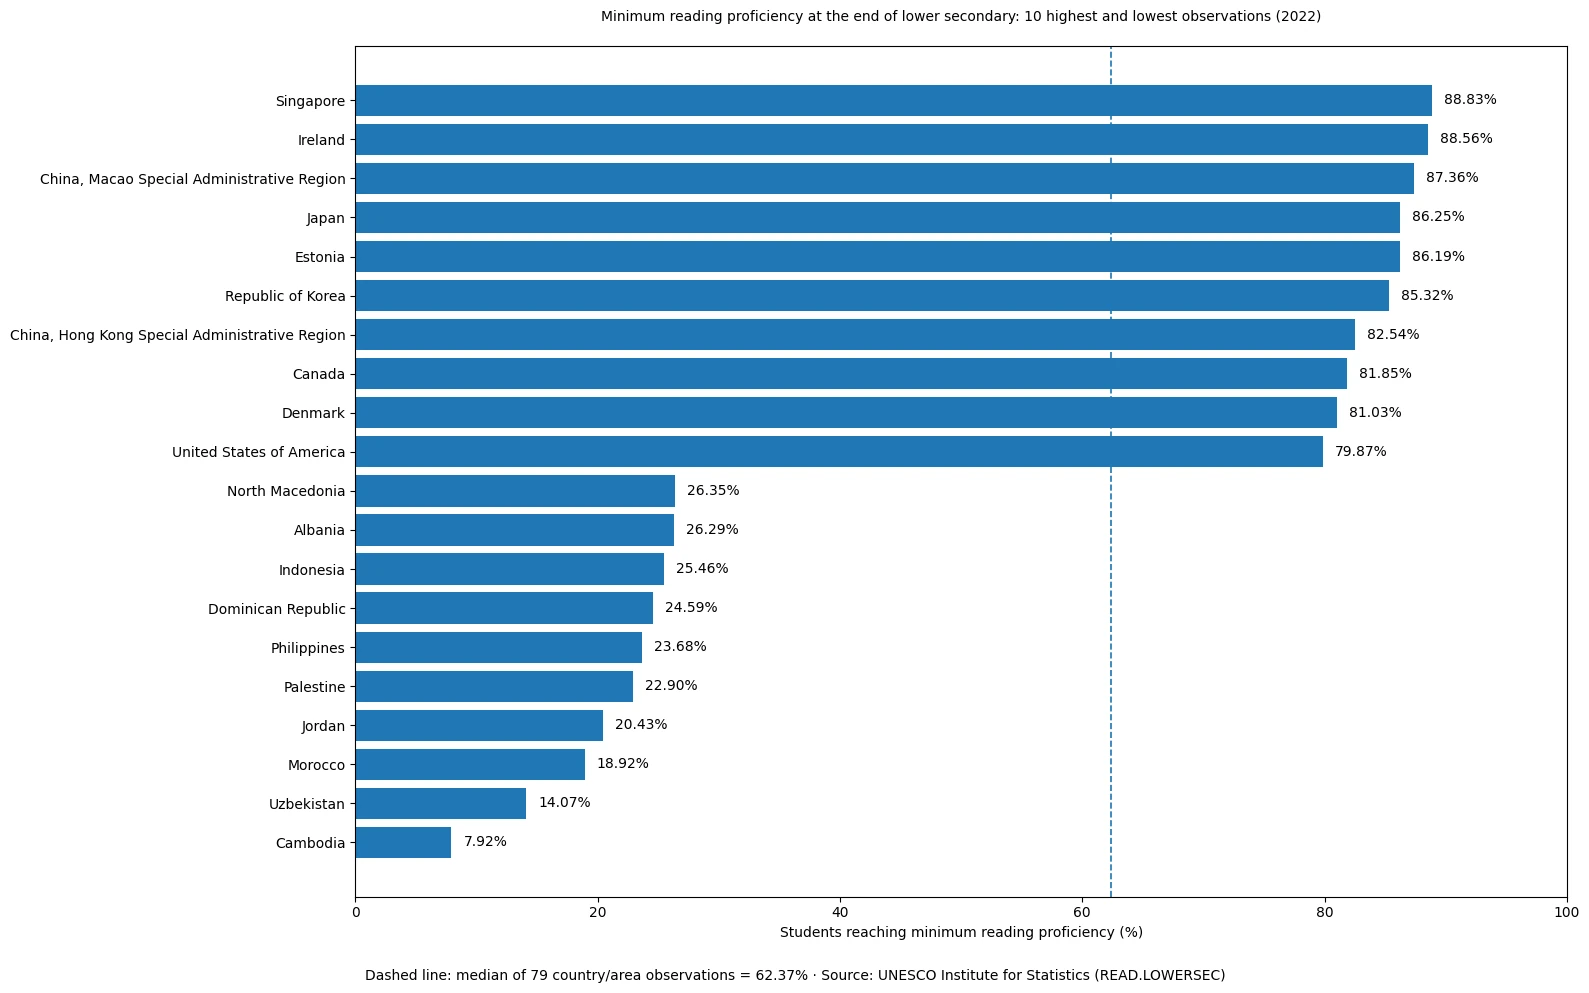
Table of Contents
What minimum reading proficiency means at the end of lower secondary
The Minimum Proficiency Level used for SDG 4.1.1 is a benchmark for the basic knowledge and skills learners should demonstrate in a subject at a particular stage of education. For reading at the end of lower secondary, the benchmark includes being able to locate and connect multiple related pieces of information across sections of texts in order to understand key ideas. A country value of 70% therefore means that about seven in ten students in the relevant assessed population met or exceeded that minimum benchmark. It does not mean students scored 70 points on one universal test.
Cross-country reporting does not require every country to administer an identical examination. UIS can draw on international assessments such as PISA, regional assessments, national assessments, and assessment approaches designed to support reporting against the global MPL. Results are aligned to the common reporting framework. That makes international comparison possible, but it does not erase every difference in assessment programme, sample design, implementation, or national school structure. Tiny decimal gaps should not be interpreted as precise differences in overall education quality.
The phrase “both sexes” also matters. It means the value combines male and female students rather than measuring a gender gap. Separate sex-disaggregated series are needed to study whether boys or girls are more likely to meet the benchmark. This article uses only the combined values supplied in READ.LOWERSEC and does not infer gender differences from them.
The 79 observations have a median of 62.37% and a very wide spread
Across the 79 observations, the lowest value is 7.92% and the highest is 88.83%, a gap of 80.91 percentage points. The first quartile is 40.64% and the third quartile is 76.95%, so even the middle half of the observations spans 36.31 percentage points. The unweighted mean of 58.02% is lower than the 62.37% median because a substantial lower tail pulls the average down. Neither number is an official student-weighted world rate. Each country or area contributes one observation regardless of student population.
| 2022 minimum-reading-proficiency range | Countries/areas | Share of 79 |
|---|---|---|
| Below 20% | 3 | 3.8% |
| 20% to <40% | 17 | 21.5% |
| 40% to <60% | 18 | 22.8% |
| 60% to <80% | 32 | 40.5% |
| 80% or more | 9 | 11.4% |
The largest band is 60% to below 80%, containing 32 observations. Nine are at 80% or higher, while 20 are below 40%. The distribution therefore cannot be summarized as a narrow cluster around one common level. At the same time, the dataset covers only 79 countries and areas. Countries without a verified value in this set are not zero and are not part of the ranking. The distribution describes the available 2022 observations, not every education system in the world.
Singapore, Ireland and Macao have the highest observations in the dataset
Singapore has the highest 2022 observation at 88.83%, followed by Ireland at 88.56%, Macao at 87.36%, Japan at 86.25% and Estonia at 86.19%. The Republic of Korea is 85.32%, followed by Hong Kong at 82.54%, Canada at 81.85%, Denmark at 81.03% and the United States at 79.87%. The gap between the first and tenth observations is about 8.96 percentage points, much narrower than the spread across the complete set of 79 values.
| Country/area | Students reaching minimum reading proficiency |
|---|---|
| Singapore | 88.83% |
| Ireland | 88.56% |
| China, Macao Special Administrative Region | 87.36% |
| Japan | 86.25% |
| Estonia | 86.19% |
| Republic of Korea | 85.32% |
| China, Hong Kong Special Administrative Region | 82.54% |
| Canada | 81.85% |
| Denmark | 81.03% |
| United States of America | 79.87% |
These values should not be turned into a single league table of education quality. Minimum reading proficiency is a central learning outcome, but it does not measure every dimension of schooling. It says nothing directly about mathematics performance, school participation, student well-being, curriculum breadth, equity across socioeconomic groups, or the resources available to schools. The dataset also does not identify the causes of higher performance. Teacher policy, family background, language, school organization, assessment design, and many other factors require separate evidence.
Low observations need context rather than a simple label
At the lower end, Cambodia is reported at 7.92%, Uzbekistan at 14.07%, and Morocco at 18.92%. Jordan is 20.43%, Palestine 22.90%, the Philippines 23.68%, the Dominican Republic 24.59%, Indonesia 25.46%, Albania 26.29%, and North Macedonia 26.35%. These values show a low share of students meeting the specified reading benchmark in the reported 2022 data. They should not be used as a label for individual students or as proof that an entire education system is incapable of improvement.
| Country/area | Students reaching minimum reading proficiency |
|---|---|
| Cambodia | 7.92% |
| Uzbekistan | 14.07% |
| Morocco | 18.92% |
| Jordan | 20.43% |
| Palestine | 22.90% |
| Philippines | 23.68% |
| Dominican Republic | 24.59% |
| Indonesia | 25.46% |
| Albania | 26.29% |
| North Macedonia | 26.35% |
The indicator itself does not explain why a value is low. Out-of-school rates, household income, language of instruction, participation in the assessment, teacher supply, class size, education spending, pandemic-related learning disruption, and subnational inequality are all separate variables. National lower-secondary structures also differ. Establishing causal explanations requires country-specific evidence and assessment metadata rather than speculation from one percentage.
A common 2022 reference year improves comparison, but coverage is only 79 countries and areas
One important strength of this dataset is that all 79 observations use the same reference year, 2022. That avoids the common problem of placing a 2015 value beside a 2022 value and treating both as if they represented the same moment. Within this set, the temporal basis is therefore relatively clean and the cross-country distribution is easier to interpret.
The limitation is geographic coverage. Learning-outcome indicators require assessment evidence that can be reported against the relevant global benchmark, so coverage can be much smaller than for population or school-enrolment statistics. A country that is missing from the 79 observations is not missing because its performance is assumed to be low or high; it simply lacks a verified value in this dataset. For that reason, “highest among the 79 available 2022 observations” is more accurate than claiming an unconditional world ranking.
Learning proficiency is different from completion, enrolment and being out of school
READ.LOWERSEC measures achievement among the relevant assessed student population, not the share of all young people in an age cohort who have learned to read at that level. A country can have strong results among students who remain in school while also facing a completion or out-of-school problem. Another country may have broad participation but weaker average learning outcomes. Access and learning are both important, but one does not substitute for the other.
UIS notes that learning-proficiency indicators can be read alongside completion measures to obtain a broader picture of how many children or young people in a cohort both reach the end of the stage and achieve the expected learning threshold. This is especially useful when participation in schooling is uneven. For practical analysis, minimum reading proficiency should therefore be paired with lower-secondary completion, out-of-school, and enrolment indicators rather than treated as a complete summary of educational opportunity.
Broad performance bands are more useful than tiny decimal rankings
A difference such as 86.25% versus 86.19% should not be treated as a meaningful gap in national education quality. Learning assessments often use samples, and results can be affected by sampling uncertainty and measurement procedures. Broad bands such as 80% or more, 60–80%, 40–60%, and below 40% are more stable for describing the shape of the distribution. In this dataset, the largest group is 60–80%, while one quarter of the observations are below 40%.
The 2022 cross-section also cannot tell us whether a country is improving or deteriorating. A value of 70% in 2022 says nothing by itself about the direction of change from 2018 or 2015. Trend analysis requires earlier observations for the same indicator and careful attention to whether assessment programmes, linking methods, or reporting frameworks changed. The analysis here is intentionally a single-year comparison.
Data source and calculation method
The core values come from the UNESCO Institute for Statistics official READ.LOWERSEC series. It corresponds to the reading component of SDG indicator 4.1.1 at the end of lower secondary education. All 79 retained observations are dated 2022, and the percentages are used as published by the official source. The mean, median, quartiles, distribution bands, and highest and lowest tables were calculated directly from those 79 values. Missing countries were not assigned zero and no unreported values were estimated.
Official methodological context is available from UNESCO UIS SDG 4 indicators, the UIS metadata page for indicator 4.1.1, and the UIS Learning Data Resource Center explanation of Minimum Proficiency Levels. These sources describe the indicator as a measure of whether students demonstrate the basic reading knowledge and skills expected at the relevant stage.
What this dataset can and cannot answer
The 2022 comparison can show how widely minimum reading proficiency differs across the 79 available country and area observations, where the upper and lower parts of the distribution sit, and how many observations fall into broad proficiency bands. It adds a learning-outcome perspective that enrolment and formal education-duration indicators cannot provide on their own.
It cannot rank every education system in the world, establish a causal explanation for a country result, estimate the reading proficiency of all young people including those outside the assessed population, or reveal gender, income, urban-rural, or language gaps from the combined value alone. Those questions require disaggregated assessment data and additional indicators covering access, completion, socioeconomic conditions, teachers, and education finance.
Frequently Asked Questions
What does minimum reading proficiency at the end of lower secondary measure?
It is the share of students in the relevant assessed population who meet or exceed the internationally defined minimum reading benchmark for the end of lower secondary education.
Are all 79 observations from the same year?
Yes. All 79 observations used here are dated 2022. The dataset does not cover every country, so countries without a value should not be treated as zero.
Is the 62.37% median a global student proficiency rate?
No. It is the median of 79 equally weighted country and area observations. It is not weighted by the number of students in each country.
Does a higher percentage mean the entire education system is better?
No. The indicator measures one learning outcome—minimum reading proficiency. It does not by itself measure enrolment, completion, mathematics, equity, student well-being, or overall education quality.
Related Articles
Minimum reading proficiency is a learning-outcome measure. Adult educational attainment, the legal duration of compulsory schooling, and the balance between general and vocational programmes answer different questions. The related pages below add context without treating those measures as substitutes for test-based learning outcomes.
- Lower-secondary-or-higher educational attainment among adults age 25+
- Compulsory education duration by country in 2025
- Share of secondary students enrolled in vocational programmes
Green Map creates custom-edited map images using open geographic data sources such as geoBoundaries, Natural Earth, OpenStreetMap, and government open data.
These maps are edited visual materials, not raw data files, and are provided for education, documents, presentations, and graphic reference.