Pre-primary participation differs sharply across the countries and areas that reported a 2024 value to the UNESCO Institute for Statistics (UIS). In the 121-row comparison used here, the net enrolment rate ranges from 1.78% to 99.85%. Because every retained observation is dated 2024, the comparison avoids one of the most common problems in international education tables: mixing one country’s recent value with another country’s much older latest observation.
The coverage is not universal. These 121 rows represent countries and separately reported areas with a usable 2024 observation in this extract, not every country in the world. Missing countries are not assigned a zero. The safest way to read the results is therefore as a same-year comparison of reporting places, with the indicator definition and coverage kept visible.
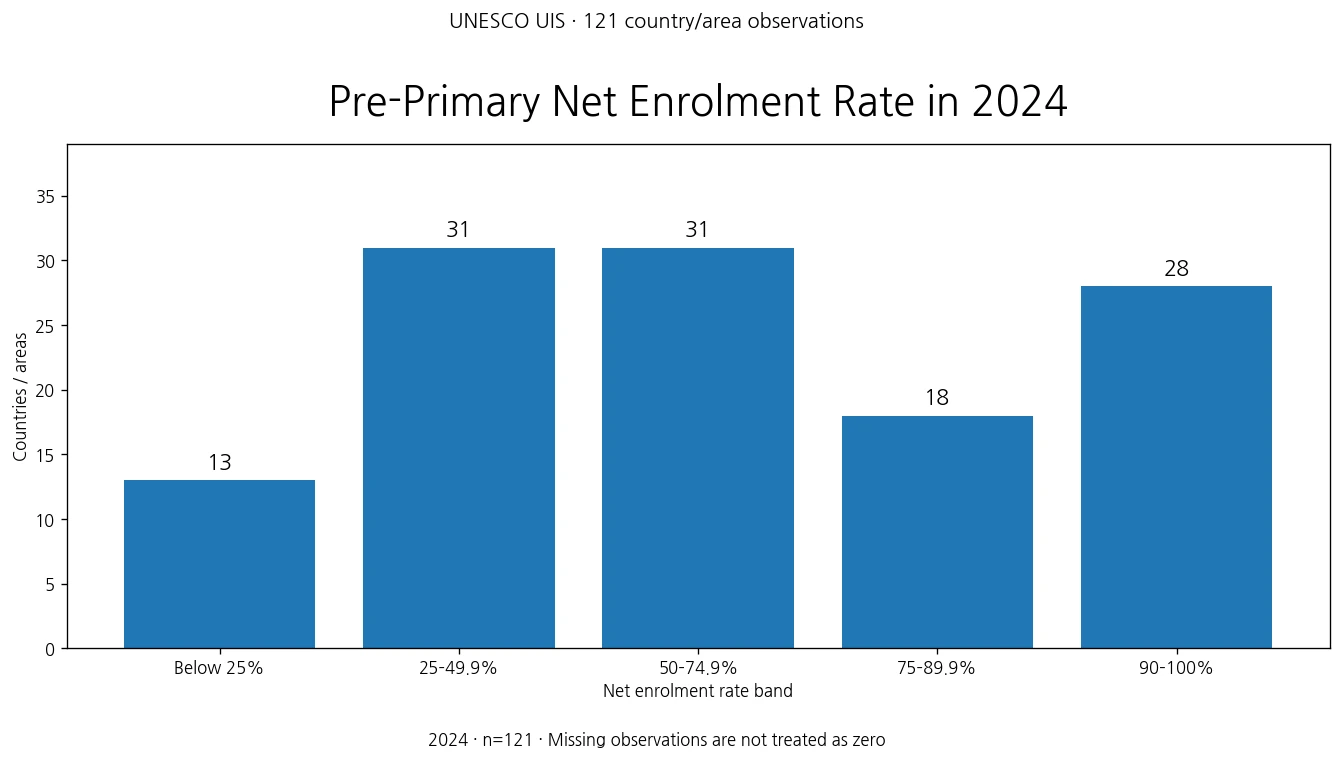
Table of Contents
What the pre-primary net enrolment rate measures
UIS defines the pre-primary net enrolment rate as the percentage of children of the official age for pre-primary education who are enrolled in pre-primary education. The numerator is the number of enrolled children who fall inside that official age group, while the denominator is the total population of the same official age group. It therefore answers a participation question about age-appropriate enrolment rather than asking what share of enrolled pupils happen to be the expected age.
This is different from a gross enrolment ratio. A gross ratio can include pupils outside the official age range and may therefore exceed 100%, while a net rate focuses on children in the age range for which the programme is intended. It is also different from a net attendance rate derived from household surveys. Enrolment statistics usually rely on administrative registration, whereas attendance indicators ask whether children actually attended during a reference period.
The official age span and the way early-childhood programmes are organized can vary across national systems. International education classifications improve comparability, but a single percentage cannot erase every institutional difference. The rate is best used as a measure of participation in formally classified pre-primary education, not as a complete measure of all childcare, early-learning services, or school readiness.
The median across the 121 observations is 65.81%
The simple unweighted mean of the 121 observations is 62.18%, while the median is 65.81%. The 25th percentile is 39.48% and the 75th percentile is 87.92%, placing the middle half of reporting countries and areas between roughly 39.5% and 87.9%. The gap between the minimum and maximum is about 98.1 percentage points, showing that same-year participation levels remain highly dispersed.
| Net enrolment rate band | Countries / areas | Share of 121 |
|---|---|---|
| Below 25% | 13 | 10.7% |
| 25–49.9% | 31 | 25.6% |
| 50–74.9% | 31 | 25.6% |
| 75–89.9% | 18 | 14.9% |
| 90–100% | 28 | 23.1% |
Twenty-eight observations, or 23.1% of the set, are at 90% or above, and 20 reach at least 95%. At the other end, 44 observations (36.4%) are below 50% and 13 are below 25%. These are country-row statistics, not a population-weighted global enrolment rate. A large country and a small island area each count once in the mean, so the 62.18% average must not be rewritten as the share of all pre-primary-age children worldwide who are enrolled.
Twenty-eight countries and areas are at 90% or higher
The upper end of the 2024 distribution is close to universal age-appropriate enrolment. The Republic of Moldova is highest in this dataset at 99.85%, followed by Grenada at 99.72%, France at 99.42%, Costa Rica at 99.17%, Hong Kong at 99.12%, and Cuba at 99.03%. Jamaica, Andorra, Israel, and Belarus are also above 98%.
| Country / area | Year | Pre-primary net enrolment rate |
|---|---|---|
| Republic of Moldova | 2024 | 99.85% |
| Grenada | 2024 | 99.72% |
| France | 2024 | 99.42% |
| Costa Rica | 2024 | 99.17% |
| China, Hong Kong Special Administrative Region | 2024 | 99.12% |
| Cuba | 2024 | 99.03% |
| Jamaica | 2024 | 98.70% |
| Andorra | 2024 | 98.63% |
| Israel | 2024 | 98.44% |
| Belarus | 2024 | 98.27% |
Decimal-place rankings near the ceiling should not be overinterpreted. A rate of 99.0% and a rate of 99.8% both indicate very high participation among children in the official pre-primary age group. The indicator does not measure classroom quality, staffing, hours of provision, affordability, local access gaps, or learning outcomes, so it cannot turn a small difference near 100% into a broad judgement about the strength of an education system.
Forty-four observations are below 50%, including thirteen below 25%
At the lower end, Chad records 1.78%, Niger 7.07%, Burkina Faso 7.54%, South Sudan 8.77%, Côte d’Ivoire 10.17%, and the Syrian Arab Republic 10.92%. These values mean that a relatively small share of children in the official pre-primary age group were registered in the formal pre-primary programmes counted by the indicator. They do not, by themselves, explain why participation is low.
| Country / area | Year | Pre-primary net enrolment rate |
|---|---|---|
| Chad | 2024 | 1.78% |
| Niger | 2024 | 7.07% |
| Burkina Faso | 2024 | 7.54% |
| South Sudan | 2024 | 8.77% |
| Côte d’Ivoire | 2024 | 10.17% |
| Syrian Arab Republic | 2024 | 10.92% |
| Niue | 2024 | 20.00% |
| Senegal | 2024 | 21.29% |
| Micronesia (Federated States of) | 2024 | 21.74% |
| Samoa | 2024 | 22.68% |
Possible explanations for low participation can include the supply and location of programmes, household costs, whether provision is compulsory or publicly funded, the division between education and childcare systems, population structure, and the coverage of administrative reporting. None of those explanatory variables is contained in this indicator table. Establishing causes requires additional country-specific evidence rather than inferring them from the enrolment rate alone.
Selected 2024 observations show a wide gap among large and mid-sized countries
The same-year comparison remains broad even among familiar economies. Germany reports 95.55%, Australia 85.80%, Brazil 82.41%, Mexico 66.06%, India 56.69%, Indonesia 45.60%, and Egypt 26.83%. The Republic of Korea is at 95.60%, placing it in the upper band of this reporting set.
| Country | Year | Pre-primary net enrolment rate |
|---|---|---|
| Republic of Korea | 2024 | 95.60% |
| Germany | 2024 | 95.55% |
| Australia | 2024 | 85.80% |
| Brazil | 2024 | 82.41% |
| Mexico | 2024 | 66.06% |
| India | 2024 | 56.69% |
| Indonesia | 2024 | 45.60% |
| Egypt | 2024 | 26.83% |
Coverage matters just as much as the percentages. The United States, Japan, and mainland China do not have a row in this 121-observation 2024 extract. Their absence must not be read as zero enrolment. A broader latest-available comparison could include more countries, but it would usually introduce different reference years. This article instead prioritizes a synchronized 2024 comparison and accepts the narrower coverage that comes with it.
Using a single reference year improves comparability
International datasets often maximize geographic coverage by keeping the latest non-empty value for each country. That approach is useful for broad maps, but it can place a 2024 observation beside another country’s 2021 or much older value. Education systems and reporting practices can change over several years, so a mixed-year ranking can create false precision.
Here every retained row is dated 2024, which removes that specific time mismatch. The trade-off is that only 121 reporting countries and areas remain. Same-year coverage and maximum geographic coverage are different analytical goals. The results are therefore best described as a 2024 comparison among places with reported values, not a complete league table of every country in the world.
A net enrolment rate is not a score for education quality or childcare access
A high net enrolment rate says that a large share of children in the official age group are registered in programmes classified as pre-primary education. It does not show how much they learn, how many hours they attend, whether classes are well staffed, or whether families can access affordable provision close to home. Likewise, a lower rate does not prove that every child outside formal pre-primary education receives no care or early learning, because some services may sit outside the education statistics used for this indicator.
The measure also answers a different question from the private share of pre-primary enrolment. A private-share indicator uses enrolled pupils as its denominator and describes how enrolment is split between institutional sectors. The net enrolment rate uses the official-age population as its denominator and measures participation. A country could therefore have high participation with mostly public provision, or low participation with a high private share among the children who are enrolled.
Three checks make the country comparison safer to use
- Check the official age group: the age range for pre-primary education is defined within each national system, so similar percentages can sit inside different institutional arrangements.
- Keep country-level summaries separate from global population rates: the mean and median here give each of the 121 rows equal weight and do not estimate the share of the world’s children enrolled.
- Do not convert missing observations to zero: a country without a 2024 row is simply outside this same-year comparison. Treating missing data as zero would distort both rankings and the distribution.
Data source and calculation method
The source indicator is UNESCO Institute for Statistics NER.02.CP. The UIS Data Browser glossary defines the net enrolment rate in pre-primary education using the official-age population as the denominator, and the measure also appears as SDG 4 thematic indicator 4.2.4.
This analysis uses 121 non-missing country or area observations dated 2024 from the UIS public data feed. The mean, median, quartiles, distribution bands, and high/low tables were calculated directly from those values. Missing observations were not replaced with zero, and displayed percentages are rounded to two decimal places. The results describe reported participation and should not be used to infer causal effects or education quality.
Frequently Asked Questions
What does the pre-primary net enrolment rate mean?
It is the percentage of children in the official pre-primary age group who are enrolled in pre-primary education. It is different from a gross enrolment ratio and from attendance measures.
What is the median in the 2024 comparison?
The median across the 121 reported observations is 65.81%, while the simple unweighted mean is 62.18%. These are country-row summaries, not population-weighted world rates.
Should a country missing from the 2024 table be treated as 0%?
No. A missing row means there is no observation in this 121-row same-year extract. Missing data are not zero and should not be used that way in rankings or summaries.
Related Articles
- Private share of pre-primary enrolment across countries
- Primary-or-higher educational attainment among adults 25+
- Government education spending as a share of GDP
Green Map creates custom-edited map images using open geographic data sources such as geoBoundaries, Natural Earth, OpenStreetMap, and government open data.
These maps are edited visual materials, not raw data files, and are provided for education, documents, presentations, and graphic reference.