National electricity-access averages can hide large differences between cities and rural communities. World Bank series EG.ELC.ACCS.RU.ZS measures the percentage of the rural population with access to electricity. The latest-observation table contains 214 country and separately reported economy rows, but this article uses only the 210 observations actually dated 2024 so that the map and ranking hold the reference year constant.
Across those 210 same-year observations, the median is 100.0% and the unweighted mean is 84.3%. Exactly 122 countries and economies are reported at 100.0%, while 35 remain below 50% and 17 are below 25%. The distribution therefore combines a very large near-universal-access group with a smaller but severe low-access tail.
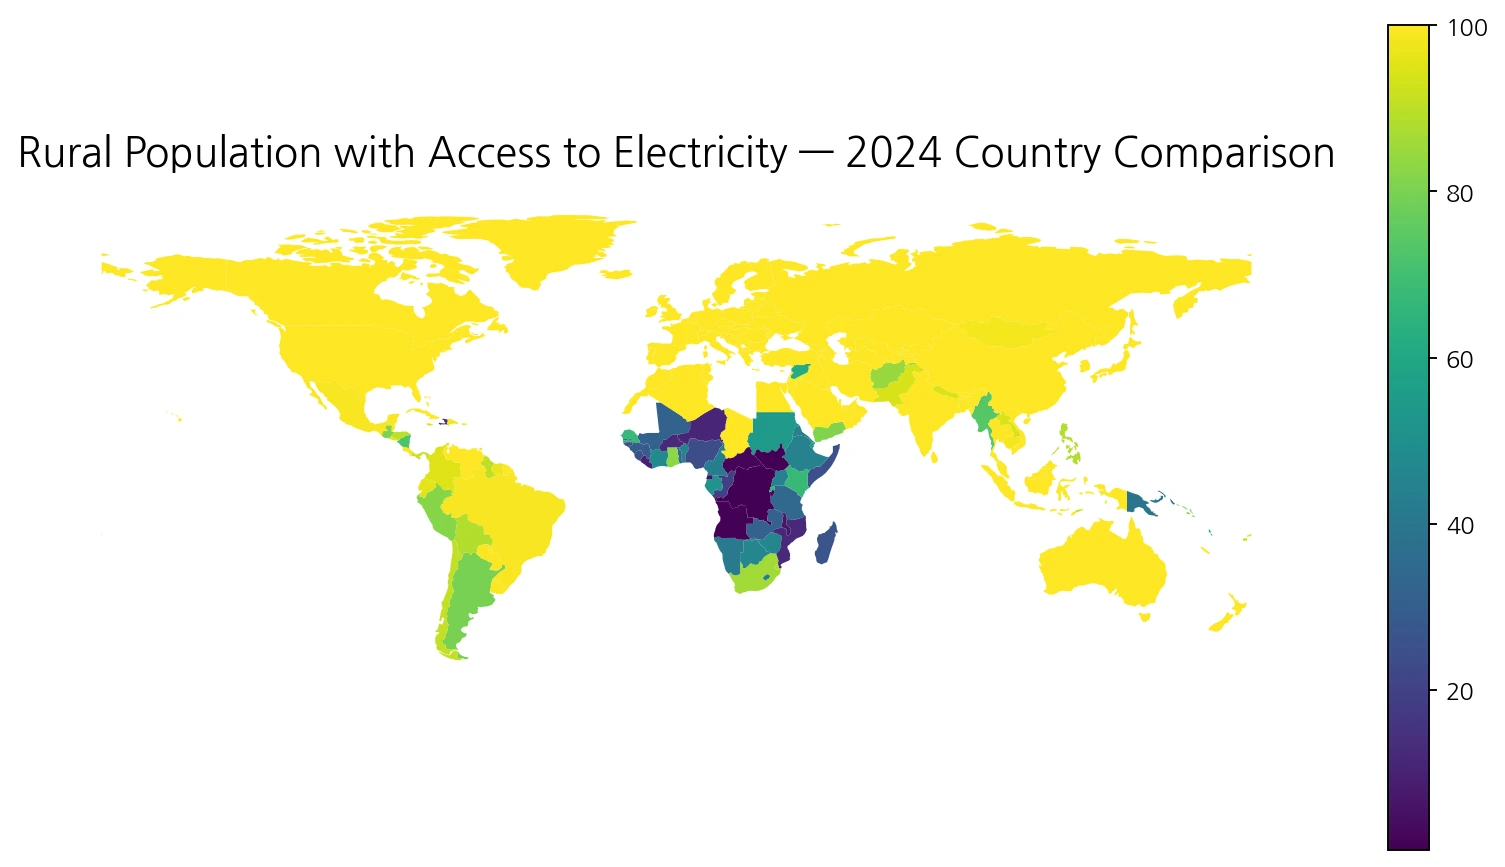
Table of Contents
What rural electricity access measures
The World Bank defines this indicator as the percentage of the rural population with access to electricity. The denominator is rural population, not the country’s total population. That distinction matters because a country can have a very high national access rate while still having a lower rate in rural communities, particularly when most people live in urban areas.
This is not a measure of electricity generation, installed power capacity, electricity use per person, prices, or outage frequency. A reported 100% also does not mean every household receives identical reliability or affordability. Electricity access describes a basic infrastructure outcome; quality, continuity, cost, and consumption require separate indicators.
122 observations are at 100%, but 35 remain below 50%
Of the 210 observations, 122 are exactly 100.0%, or 58.1% of the sample. 59 are below 90%, 45 are below 75%, and 35 are below 50%. Seventeen are below 25%, and eight are below 10%. The median reaches 100% because more than half of the observations are at the top of the scale, while the much lower 84.3% mean reflects the depth of the low-access tail.
| 2024 rural access range | Countries/economies | Share of 210 |
|---|---|---|
| 100% | 122 | 58.1% |
| 99% to <100% | 10 | 4.8% |
| 90% to <99% | 19 | 9.0% |
| 75% to <90% | 14 | 6.7% |
| 50% to <75% | 10 | 4.8% |
| 25% to <50% | 18 | 8.6% |
| Below 25% | 17 | 8.1% |
The 84.3% mean is not the share of the world’s rural population with electricity access. It gives each country or separately reported economy one equal statistical weight. A rural-population-weighted global rate would require rural population counts for each country. The mean and median here are used only to summarize the cross-country distribution.
South Sudan, the Democratic Republic of the Congo, and Angola are lowest
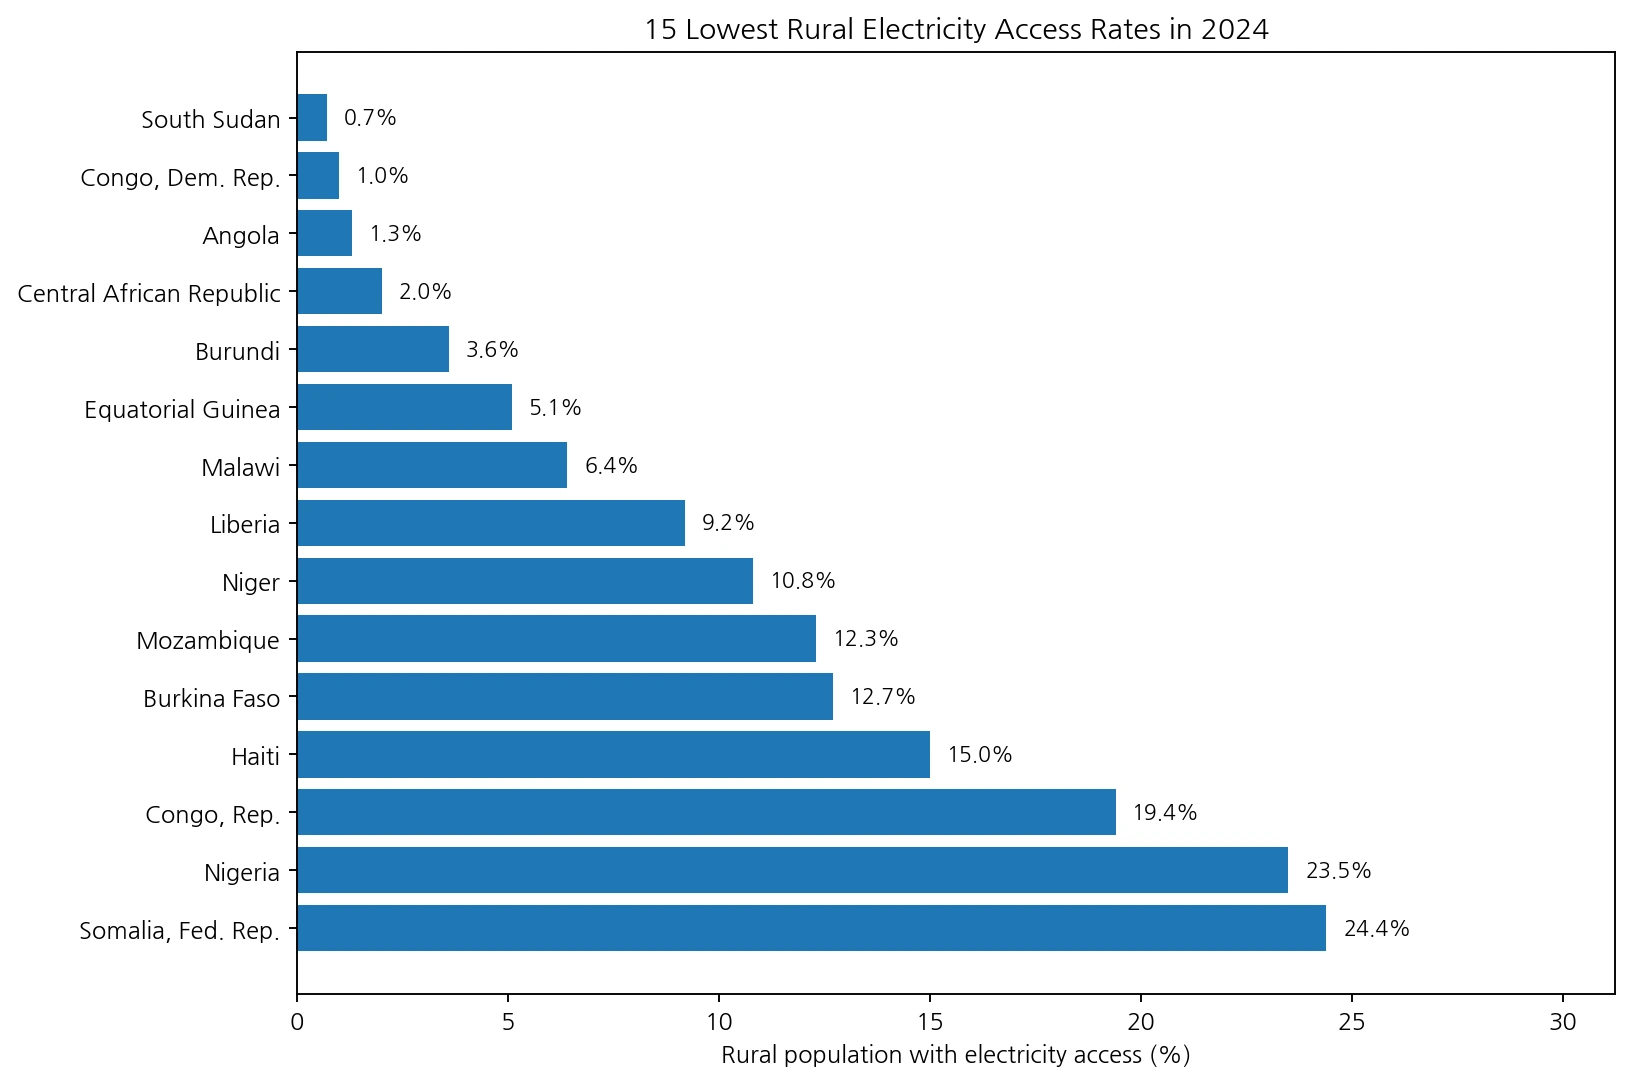
South Sudan has the lowest 2024 observation at 0.7%, followed by the Democratic Republic of the Congo at 1.0% and Angola at 1.3%. The Central African Republic is 2.0%, Burundi 3.6%, Equatorial Guinea 5.1%, Malawi 6.4%, and Liberia 9.2%. Niger is 10.8%, Mozambique 12.3%, Burkina Faso 12.7%, and Haiti 15.0%.
| Country/economy | 2024 rural electricity access |
|---|---|
| South Sudan | 0.7% |
| Congo, Dem. Rep. | 1.0% |
| Angola | 1.3% |
| Central African Republic | 2.0% |
| Burundi | 3.6% |
| Equatorial Guinea | 5.1% |
| Malawi | 6.4% |
| Liberia | 9.2% |
| Niger | 10.8% |
| Mozambique | 12.3% |
| Burkina Faso | 12.7% |
| Haiti | 15.0% |
| Congo, Rep. | 19.4% |
| Nigeria | 23.5% |
| Somalia, Fed. Rep. | 24.4% |
Many of the lowest observations are concentrated in Sub-Saharan Africa, but the map itself does not establish why. Settlement dispersion, grid-extension costs, off-grid systems, household income, conflict, utility finance, and policy can all matter. Those explanatory variables are not contained in this indicator column, so the strongest use of the map is to identify where the measured rural-access gap is largest before moving to country-specific evidence.
Large economies range from universal access to major rural gaps
Korea, the United States, Japan, China, Germany, France, the United Kingdom, Canada, and Australia are all reported at 100.0% in 2024. India is 99.9%, Indonesia 99.7%, Bangladesh 99.6%, and Brazil and Mexico 99.2%. Pakistan is lower at 94.0% and South Africa at 86.3%, while Ethiopia is 44.8% and Nigeria only 23.5%.
| Country/economy | 2024 rural electricity access |
|---|---|
| Korea, Rep. | 100.0% |
| United States | 100.0% |
| Japan | 100.0% |
| China | 100.0% |
| India | 99.9% |
| Indonesia | 99.7% |
| Brazil | 99.2% |
| Mexico | 99.2% |
| Germany | 100.0% |
| France | 100.0% |
| United Kingdom | 100.0% |
| Canada | 100.0% |
| Australia | 100.0% |
| Pakistan | 94.0% |
| Bangladesh | 99.6% |
| Nigeria | 23.5% |
| Ethiopia | 44.8% |
| South Africa | 86.3% |
These rural-only values can reveal infrastructure gaps that are less visible in a total-population indicator. When urban populations are large and highly electrified, the national average can sit much closer to 100% even though rural access is lower. Conversely, a rural value near 100% indicates that the basic access gap is small under the source methodology, but it does not prove that rural and urban households experience the same service quality or electricity costs.
Four older observations are kept out of the 2024 ranking
The source latest-observation table contains 214 rows, but only 210 are dated 2024. Kiribati’s latest retained value is 94.3% in 2020, Libya and Mauritania are each 0.8% in 2012, and Kosovo is 100.0% in 1999. Those values are useful as the latest observations available for those rows, but mixing them into a 2024 league table would combine time differences with geographic differences.
| Country/economy | Latest observation year | Latest value |
|---|---|---|
| Kosovo | 1999 | 100.0% |
| Libya | 2012 | 0.8% |
| Mauritania | 2012 | 0.8% |
| Kiribati | 2020 | 94.3% |
Excluding them from the same-year comparison does not imply that the older observations are invalid. It simply keeps the 2024 map transparent. A location that is gray or absent on the map should also not be interpreted as zero access: it may lack a 2024 observation or may be too small to appear as a separate polygon in the low-resolution boundary layer.
A reported 100% is not a complete measure of electricity service
A rural access value of 100.0% means that access is effectively universal under the reporting method and precision used for this indicator. It does not guarantee uninterrupted supply, identical voltage quality, affordable bills, or equal electricity consumption. Those questions require measures of reliability, affordability, service quality, and demand.
Similarly, there is little value in aggressively ranking 99.9% against 100.0%. Small differences may reflect reporting precision and estimation methods, and a few tenths of a percentage point in a populous country can still represent many people in absolute terms. Because rural population counts are not part of this dataset, this article does not manufacture estimates of the number of rural residents without electricity.
How rural access differs from total electricity access
The total-population electricity-access indicator asks what share of everyone in the country can access electricity. The rural indicator restricts the question to people living in rural areas. The total measure is useful for a national infrastructure overview, while the rural measure is more direct when the goal is to identify whether basic access gaps remain outside urban areas.
Reading total, rural, and urban access together can show where the national average is being pulled upward by highly electrified cities. However, the size of a rural-urban percentage-point gap should not be treated as a complete infrastructure score. Countries differ in rural population shares, settlement density, geography, and the physical scale of network expansion required to reach the remaining population.
Data source and comparison method
The statistical source is World Bank World Development Indicators series EG.ELC.ACCS.RU.ZS. World Bank metadata defines the measure as the percentage of the rural population with access to electricity, with percent of rural population as the unit, annual periodicity, and a current reference period of 1990–2024. The series is linked to the Global Electrification Database and SDG 7.1.1, drawing heavily on nationally representative household surveys and censuses.
All distribution statistics and rankings on this page are calculated directly from the 210 observations dated 2024. World Bank regional and income-group aggregates are not included. ISO-3 codes are joined to a Natural Earth low-resolution country layer, where 165 polygons are directly filled. Small islands and separately reported economies can have valid statistical observations without a clearly visible polygon at this scale.
- World Bank – Access to electricity, rural (% of rural population)
- World Bank DataBank – EG.ELC.ACCS.RU.ZS metadata
Frequently Asked Questions
What does rural electricity access measure?
It measures the percentage of the rural population with access to electricity. The World Bank indicator code is EG.ELC.ACCS.RU.ZS.
Which country has the lowest rural electricity access in the 2024 comparison?
South Sudan is lowest at 0.7%, followed by the Democratic Republic of the Congo at 1.0% and Angola at 1.3%.
Does 100% rural electricity access mean there are no outages?
No. The indicator measures access, not reliability, affordability, service quality, or electricity consumption.
Why are only 210 observations used instead of all 214 latest values?
Four latest values are from 1999, 2012, or 2020, so they are excluded from the same-year 2024 comparison.
Related Articles
These related Green Map articles place rural electricity access beside total electricity access, another rural household-energy service, and the broader renewable-energy structure.
- Global Electricity Access Map – 2024 Country Comparison
- Rural Clean Cooking Access – 2023 Global Map
- Global Renewable Energy Share Map – 2021 Country Comparison
Green Map creates custom-edited map images using open geographic data sources such as geoBoundaries, Natural Earth, OpenStreetMap, and government open data.
These maps are edited visual materials, not raw data files, and are provided for education, documents, presentations, and graphic reference.