Access to drinking water is not only about whether a water source exists. Distance to the source and the type of source determine whether a household meets the international “at least basic” service threshold. This article uses World Bank indicator SH.H2O.BASW.RU.ZS to compare the share of the rural population using at least basic drinking water services across 174 countries and economies in the verified dataset.
The median of the 174 latest observations is 93.4%, while the simple unweighted country/economy mean is 83.7%. 48 observations are at 99% or above, but 14 are below 50%. The mean is not a population-weighted global rural access rate; it is only a summary of the country-level distribution.
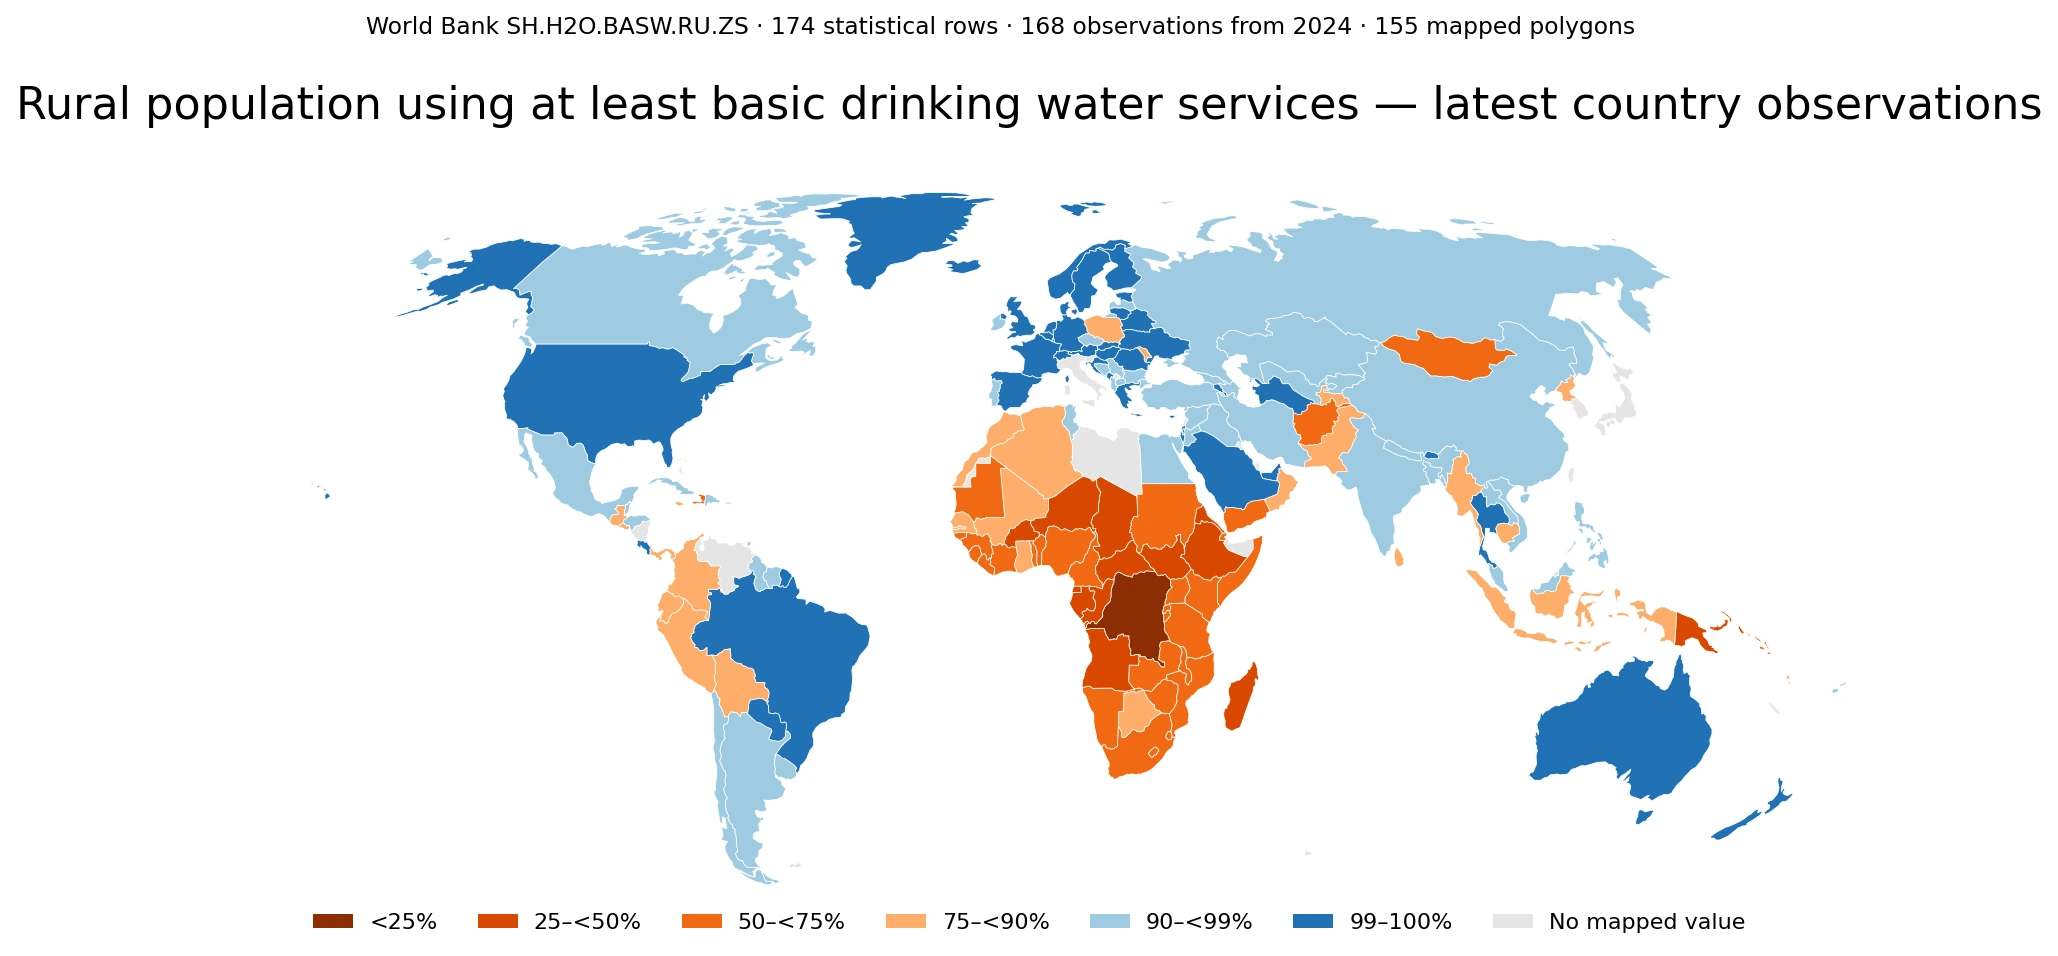
Table of Contents
What “at least basic drinking water services” means
The World Bank metadata follows the WHO/UNICEF Joint Monitoring Programme (JMP). A basic drinking water service means drinking water from an improved source when collection time is no more than 30 minutes for a round trip. Improved sources can include piped water, boreholes or tubewells, protected dug wells, protected springs, and packaged or delivered water.
This threshold should not be confused with the higher “safely managed” service level. People using safely managed services are included within the at-least-basic measure, but the basic threshold alone does not establish that every water-quality parameter is met, that supply is continuously available, or that the source is located on premises. The map is therefore an access indicator, not a direct water-safety score.
Most observations sit in the upper bands, but the lower tail is substantial
48 of 174 observations, or 27.6%, are at 99% or above, and 32 are reported at exactly 100%. At the other end, 47 observations are below 75% and 14 are below 50%. This concentration near the upper end explains why the median is 93.4% even though a meaningful group of countries remains far below that level.
| Rural population using at least basic services | Countries/economies | Share of 174 |
|---|---|---|
| <25% | 1 | 0.6% |
| 25–<50% | 13 | 7.5% |
| 50–<75% | 33 | 19.0% |
| 75–<90% | 29 | 16.7% |
| 90–<99% | 50 | 28.7% |
| 99–100% | 48 | 27.6% |
The distribution shows why one global-looking average can be misleading. Many economies are close to universal basic access, while others have less than half of their rural population within the basic-service threshold. A map and grouped table reveal that gap more clearly than a single summary number.
Countries with the lowest latest observations
| Country/economy | Observation year | Rural population using at least basic services |
|---|---|---|
| Congo, Dem. Rep. | 2024 | 13.8% |
| Central African Republic | 2024 | 27.4% |
| Eritrea | 2016 | 27.8% |
| Equatorial Guinea | 2017 | 30.8% |
| South Sudan | 2024 | 32.5% |
| Burkina Faso | 2024 | 34.4% |
| Angola | 2024 | 36.9% |
| Madagascar | 2024 | 39.3% |
| Chad | 2024 | 43.8% |
| Congo, Rep. | 2021 | 44.2% |
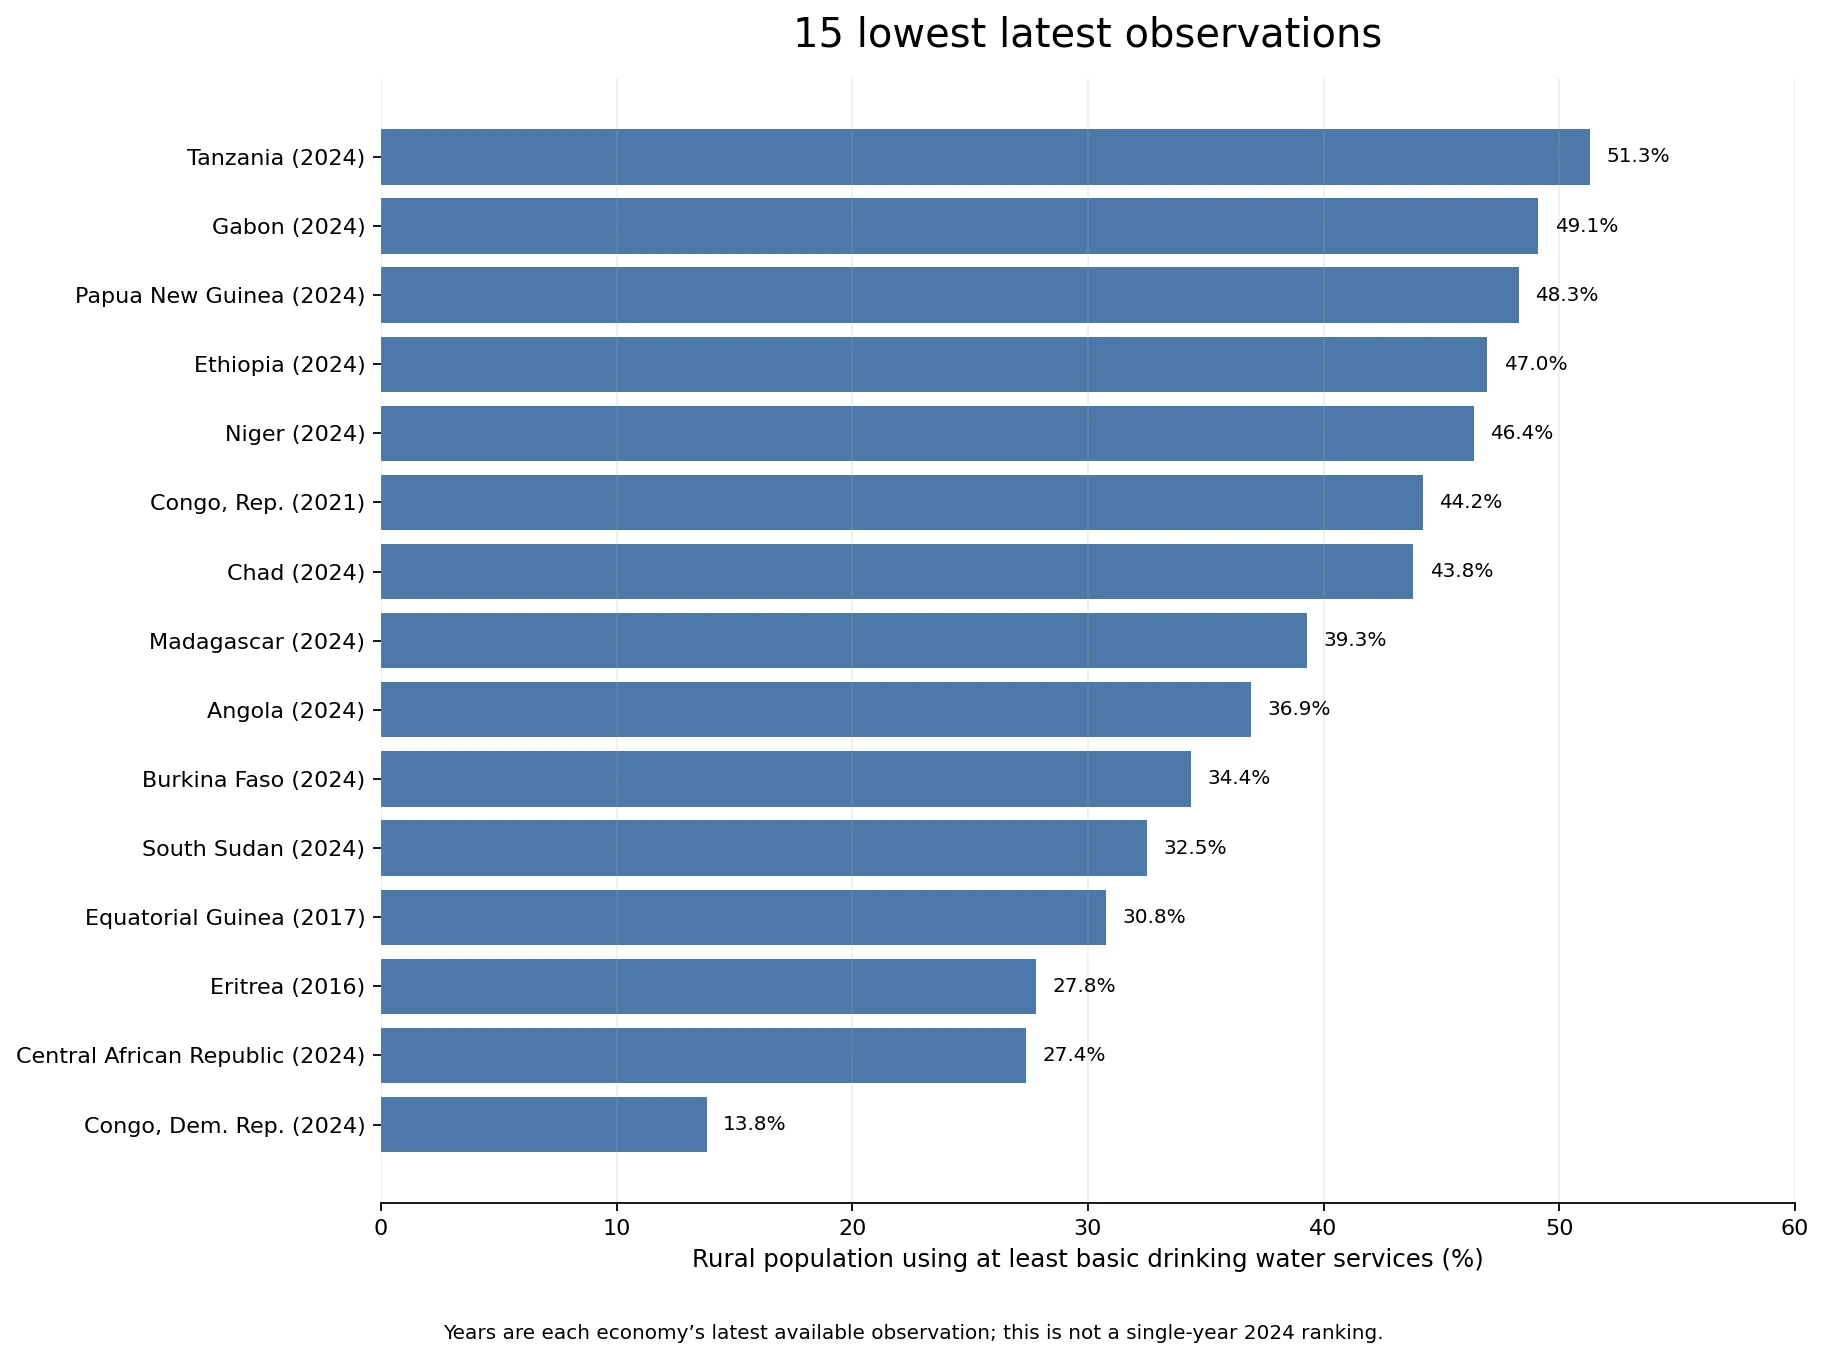
The Democratic Republic of the Congo has the lowest retained observation at 13.8%. The Central African Republic is at 27.4%, Eritrea 27.8%, Equatorial Guinea 30.8%, and South Sudan 32.5%. Burkina Faso is at 34.4%, Angola 36.9%, and Madagascar 39.3%. These percentages use the rural population as the denominator; they are not the total-population drinking-water access rates.
This one indicator cannot establish why access is low. Water networks, dispersed settlement, travel time to sources, maintenance, investment, conflict, disasters, terrain, and climate can all matter, but those explanatory variables are not bundled in this verified CSV. The article therefore describes the observed distribution without assigning unsupported causes.
The clearest low-access cluster is in Sub-Saharan Africa
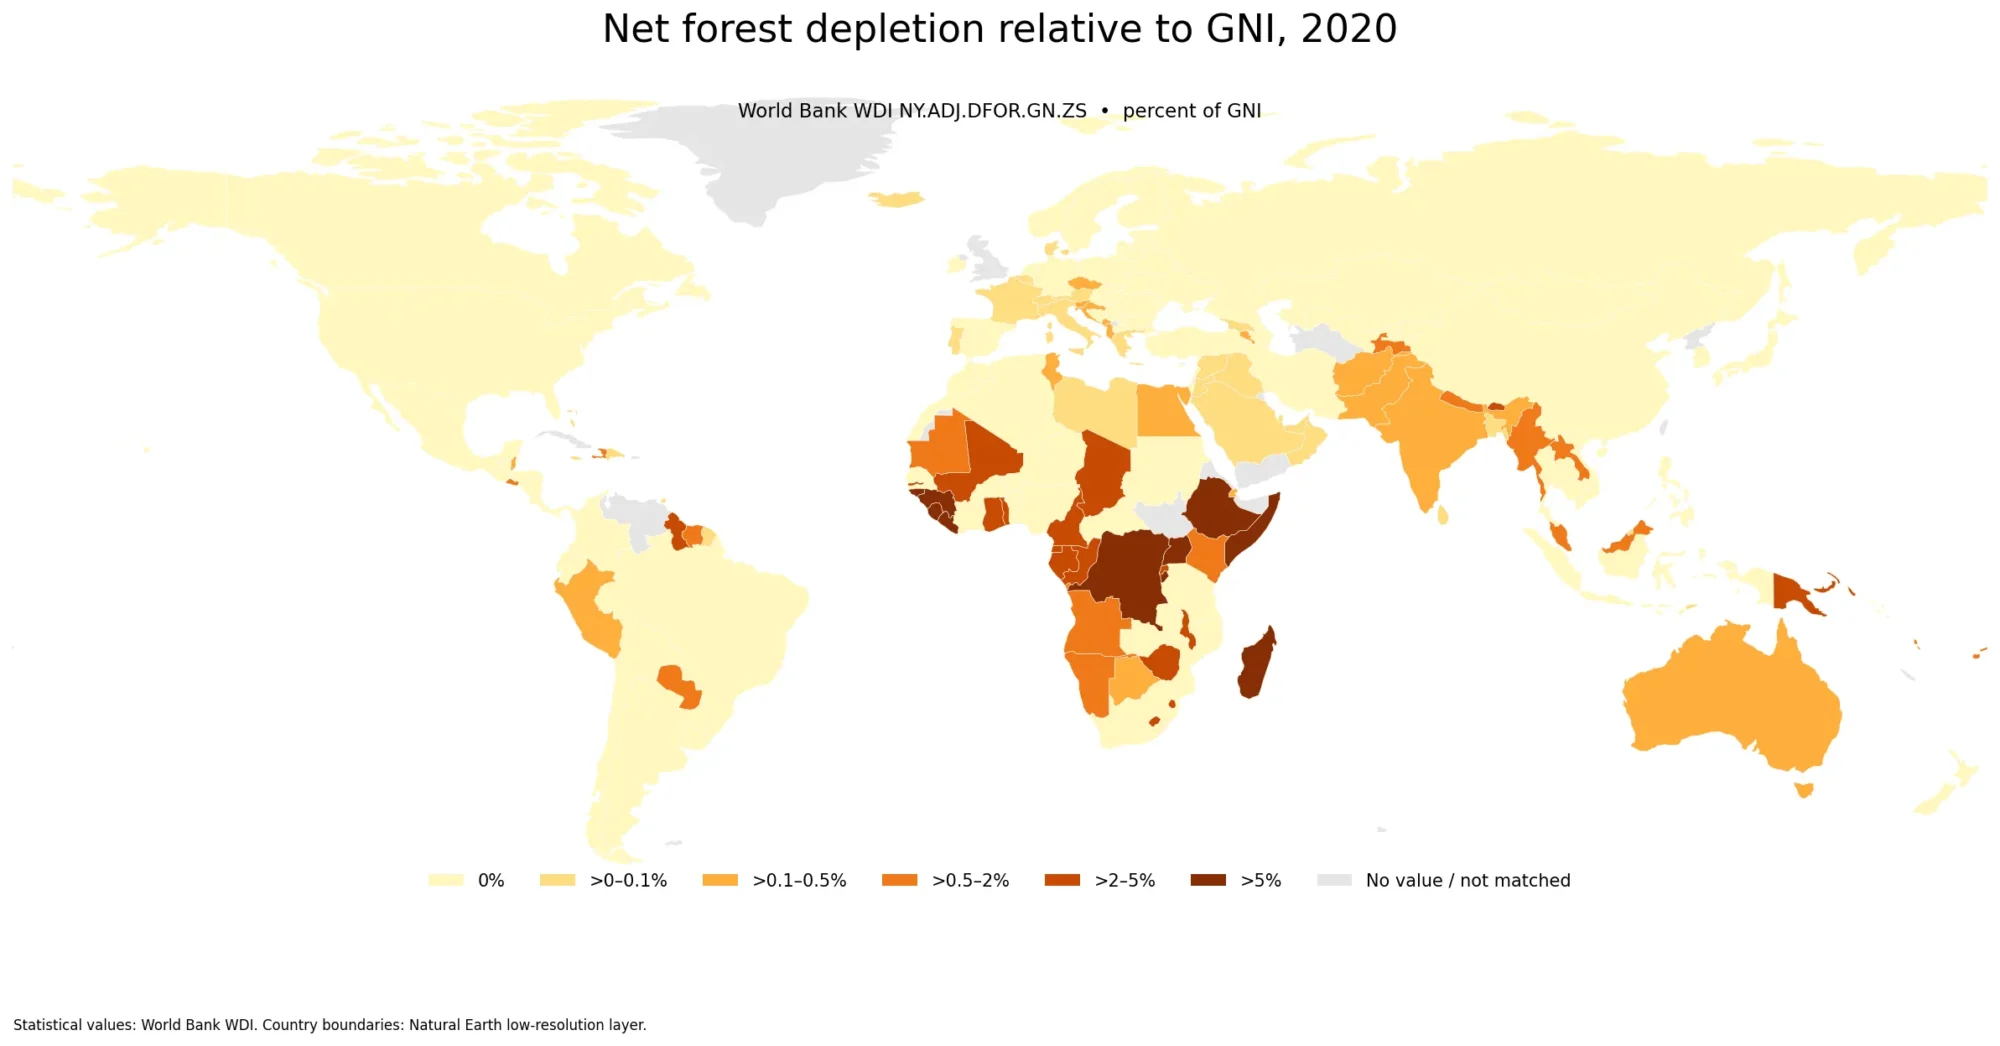
Many of the observations below 50% are in Sub-Saharan Africa, including the Democratic Republic of the Congo, Central African Republic, South Sudan, Burkina Faso, Angola, Madagascar, Chad, Republic of the Congo, Niger, Ethiopia, and Gabon. Papua New Guinea is another observation below 50%, at 48.3%. By contrast, broad areas of Europe, North America, and parts of Latin America and Oceania are in the 90% or higher bands.
That regional pattern should not be turned into a single explanation for an entire continent. African countries span a wide range in the same dataset, and Asia and Latin America also contain both very high and notably lower observations. The map is best used to locate clusters and outliers that deserve additional country-specific research.
Selected large countries on the same indicator
| Country | Observation year | Rural population using at least basic services |
|---|---|---|
| Congo, Dem. Rep. | 2024 | 13.8% |
| Ethiopia | 2024 | 47.0% |
| Nigeria | 2024 | 66.6% |
| South Africa | 2024 | 73.0% |
| Afghanistan | 2024 | 74.8% |
| Indonesia | 2024 | 80.4% |
| Pakistan | 2024 | 89.3% |
| China | 2024 | 93.8% |
| India | 2024 | 94.9% |
| Mexico | 2024 | 97.5% |
| Canada | 2024 | 98.5% |
| Bangladesh | 2024 | 98.8% |
| Germany | 2024 | 100.0% |
| Brazil | 2024 | 100.0% |
| United States | 2024 | 100.0% |
The selected-country comparison is wide: Nigeria is at 66.6%, South Africa 73.0%, Afghanistan 74.8%, Indonesia 80.4%, and Pakistan 89.3%. China is at 93.8%, India 94.9%, Mexico 97.5%, and Bangladesh 98.8%. Brazil, the United States, and Germany are reported at 100% in this table, while Canada is at 98.5%.
These percentages do not provide the number of rural residents without basic service. The same percentage-point gap can correspond to very different numbers of people because rural populations differ greatly in size. Estimating headcounts would require a compatible rural-population series for the same reference year; this package does not add a second unverified dataset.
168 observations are from 2024, while six use earlier years
The dataset stores the most recent non-empty observation for each included country or economy. 168 of the 174 rows are from 2024, but six are older. Calling the entire visualization a “2024 world map” would therefore misstate those six reference dates.
| Country/economy | Latest observation year | Access rate |
|---|---|---|
| Argentina | 2016 | 93.0% |
| Eritrea | 2016 | 27.8% |
| Equatorial Guinea | 2017 | 30.8% |
| St. Vincent and the Grenadines | 2018 | 97.0% |
| Congo, Rep. | 2021 | 44.2% |
| Korea, Dem. People’s Rep. | 2023 | 88.8% |
Argentina and Eritrea use 2016 observations, Equatorial Guinea 2017, St. Vincent and the Grenadines 2018, the Republic of the Congo 2021, and the Democratic People’s Republic of Korea 2023. These rows are useful as the latest available values but should not be precisely ranked against 2024 observations as though all measurements were simultaneous.
Data source and calculation method
The statistical source is the World Bank World Development Indicators metadata for SH.H2O.BASW.RU.ZS and the verified cleaned CSV included in this package. The World Bank identifies the WHO/UNICEF Joint Monitoring Programme for Water Supply, Sanitation and Hygiene as the underlying source. The unit is percent of rural population, and the packaged table keeps one latest non-empty observation per country or economy.
The median, unweighted mean, grouped counts, and low-observation tables were calculated directly from the cleaned CSV. No missing value was converted to zero, and no older value was manufactured or interpolated. The map joins ISO-3 codes to a low-resolution Natural Earth boundary layer: 155 of the 174 statistical observations match visible polygons at this scale. Small islands and some separately reported economies can remain in the statistics without appearing as distinct filled areas.
Frequently Asked Questions
What counts as at least basic drinking water services?
It means drinking water from an improved source when collection time is no more than 30 minutes for a round trip. People using safely managed drinking water services are also included in the at-least-basic measure.
Does this map directly measure drinking-water safety or quality?
No. The basic-service threshold focuses on the type of water source and collection time. It does not by itself prove that every water-quality requirement is met or that supply is continuously available.
Is this a single-year 2024 map?
No. 168 of the 174 latest observations are from 2024, while six economies use their latest available value from 2016 to 2023.
Is the 83.7% mean the global rural drinking-water access rate?
No. It is a simple unweighted mean across the 174 country/economy observations. A population-weighted global rural access rate is a different statistic.
Related Articles
These published Green Map articles provide useful context for comparing basic service access with other household infrastructure indicators.
- Global Clean Cooking Access Map – Country Patterns in 2023
- Global Electricity Access Map – 2024 Population Access by Country
- Global Slum Population Share Map by Country, 2022
Green Map creates custom-edited map images using open geographic data sources such as geoBoundaries, Natural Earth, OpenStreetMap, and government open data.
These maps are edited visual materials, not raw data files, and are provided for education, documents, presentations, and graphic reference.