The Global Arable Land Share Map compares the share of land area classified as arable across countries and economies in 2023. It uses World Bank World Development Indicators series AG.LND.ARBL.ZS. After regional and income-group aggregates are excluded, the supplied master table contains 217 countries and economies, with 206 numeric observations and 11 missing values.
Across the 206 numeric rows, the unweighted median is 10.0% and the simple mean is 13.93%. The first quartile is 3.1% and the third quartile is 21.3%. These are descriptive statistics that give each country or economy equal weight. They are not a land-area-weighted global arable-land percentage.
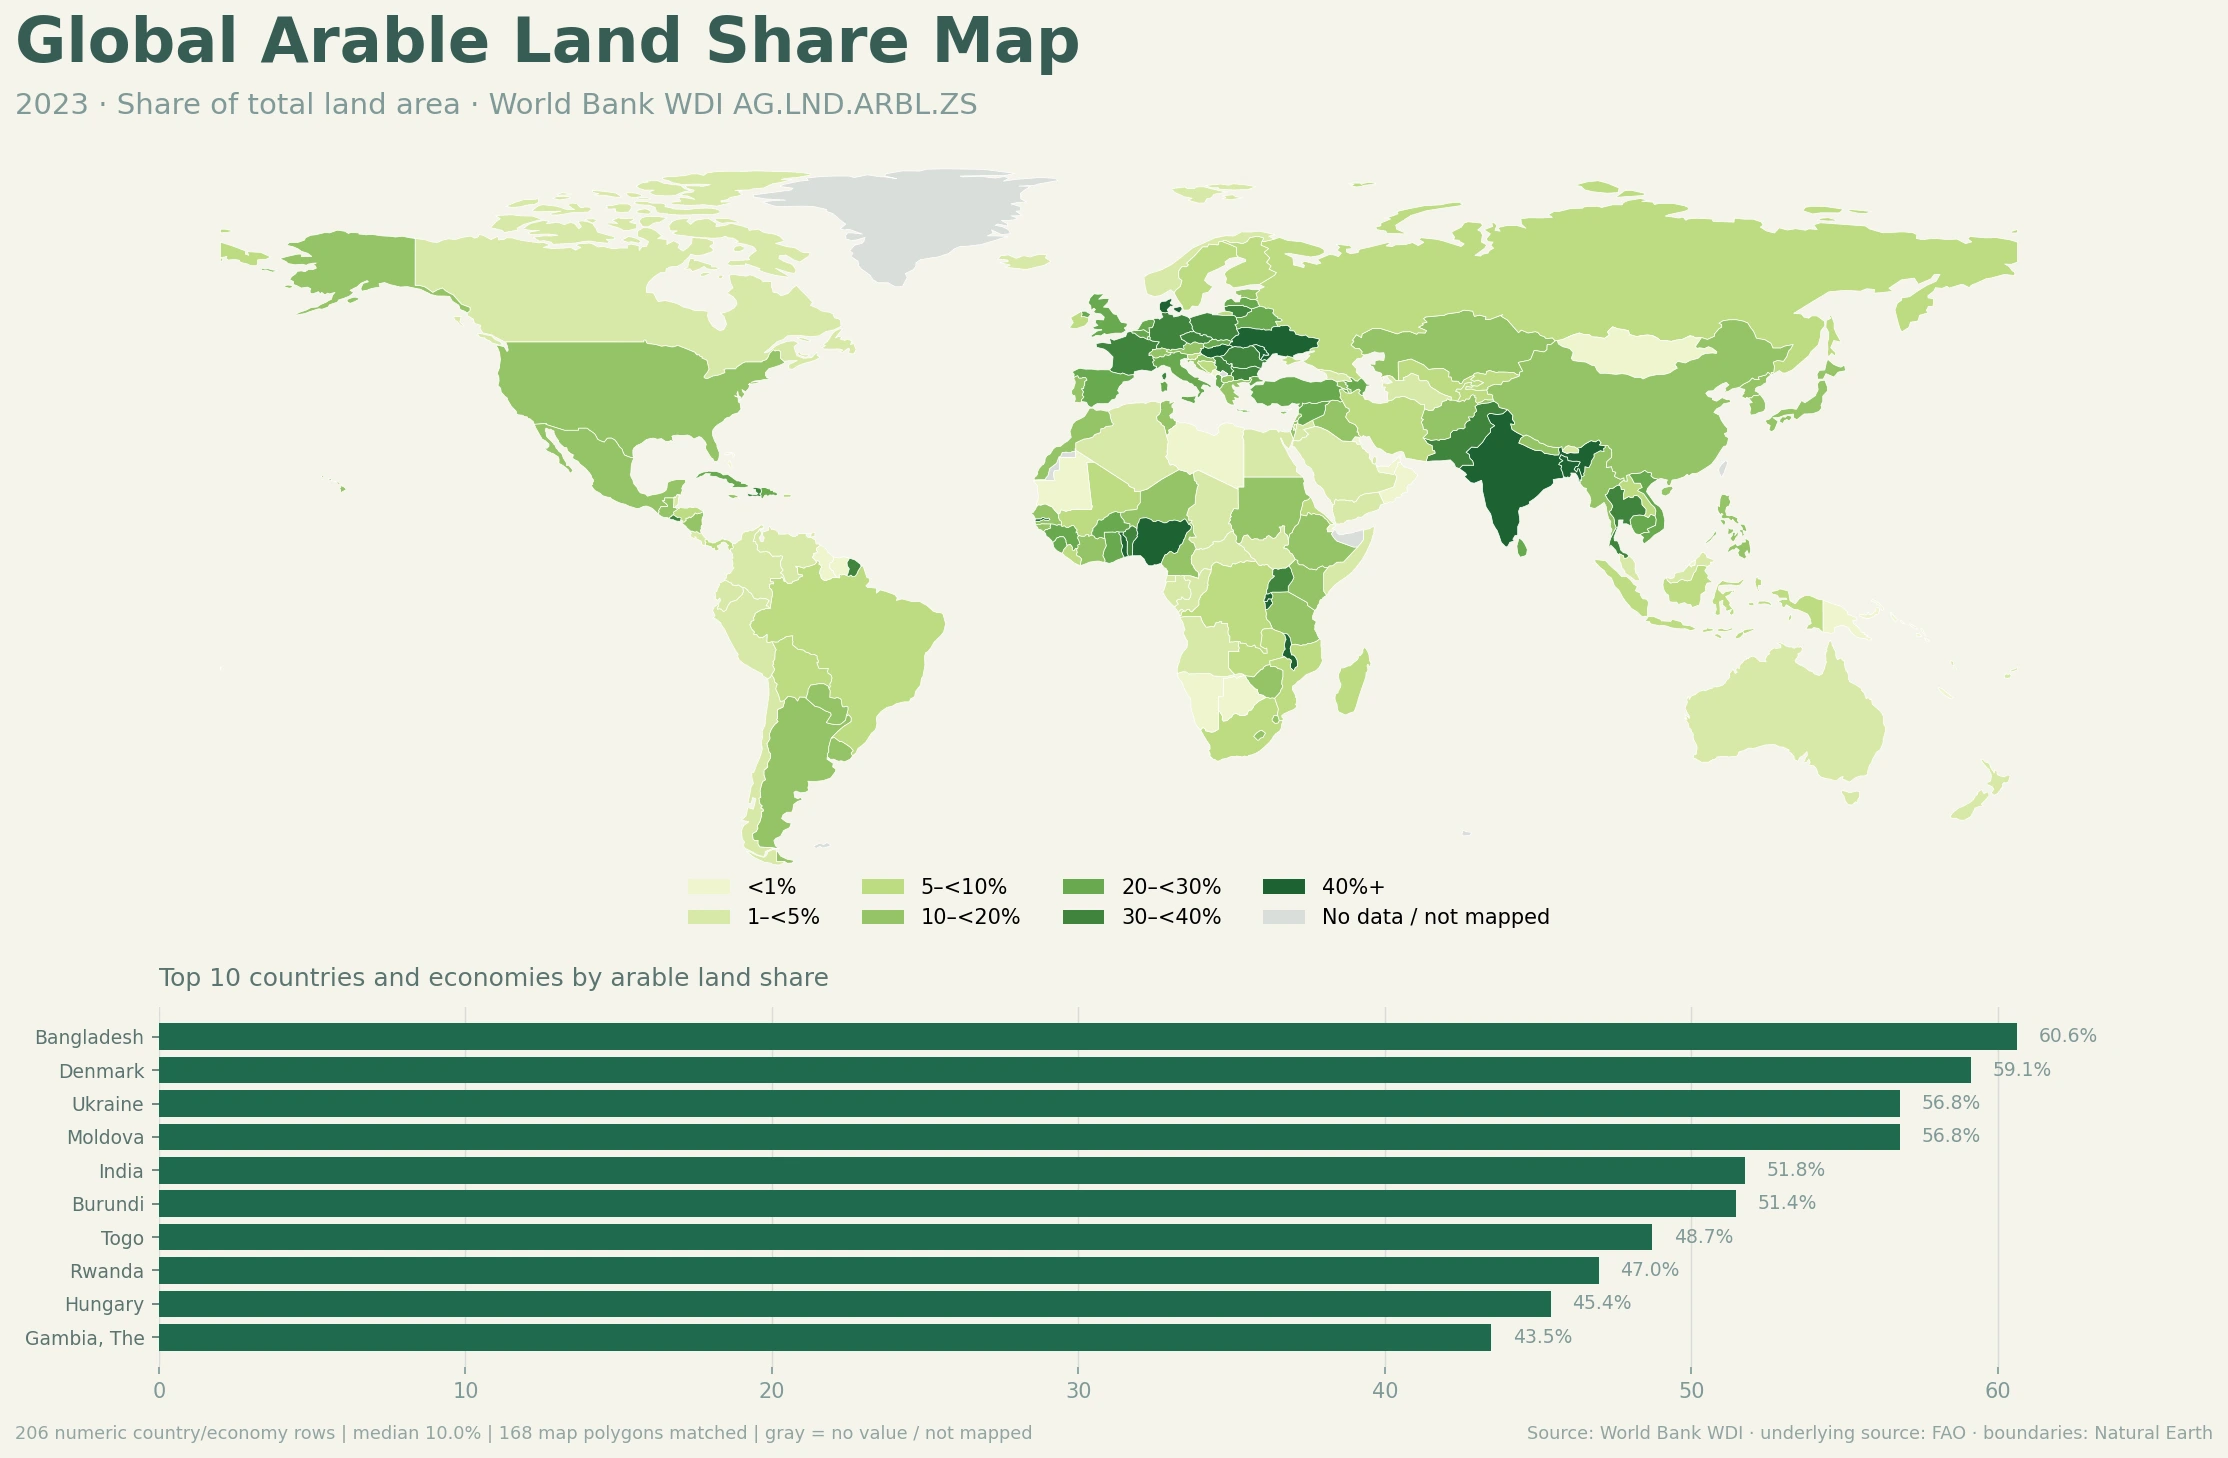
Table of Contents
Arable land is narrower than agricultural land
The World Bank indicator is Arable land (% of land area). Under the FAO definition used by the series, arable land includes land under temporary crops, temporary meadows for mowing or pasture, land under market or kitchen gardens, and land temporarily fallow. Areas double-cropped within the year are counted once, while land abandoned after shifting cultivation is excluded.
This category should not be used as a synonym for agricultural land. Agricultural land is broader because it includes arable land plus permanent crops and permanent pasture. The indicator also does not estimate all land that might be cultivable in the future. It measures land already falling within the statistical arable-land definition.
The center of the 2023 distribution is close to 10%
The largest bin in the supplied data is 10–<20%, containing 49 countries and economies. Another 45 are in the 1–<5% range. In total, 103 of the 206 numeric observations are below 10%, while only 13 are at 40% or more. The median of roughly 10% therefore sits well below the very high values seen in a small group of countries.
| 2023 arable land share | Countries/economies | Share of 206 |
|---|---|---|
| Under 1% | 24 | 11.7% |
| 1–<5% | 45 | 21.8% |
| 5–<10% | 34 | 16.5% |
| 10–<20% | 49 | 23.8% |
| 20–<30% | 24 | 11.7% |
| 30–<40% | 17 | 8.3% |
| 40% or more | 13 | 6.3% |
The class breaks are visual aids, not policy or agronomic thresholds. A country at 9.9% and another at 10.1% can appear in different map classes even though their measured shares are nearly the same. Exact values are more useful when comparing neighboring positions around a boundary.
Bangladesh and several European countries are above 50%
Bangladesh has the highest 2023 observation in the supplied table at 60.6%. Denmark follows at 59.1%, while Ukraine and Moldova are both about 56.8%. India is at 51.8% and Burundi at 51.4%. Togo, Rwanda, Hungary and The Gambia complete the top ten. This ranking is based on share of land area, not on crop output, farm productivity or the absolute number of hectares.
| Country/economy | Arable land share in 2023 |
|---|---|
| Bangladesh | 60.6% |
| Denmark | 59.1% |
| Ukraine | 56.8% |
| Moldova | 56.8% |
| India | 51.8% |
| Burundi | 51.4% |
| Togo | 48.7% |
| Rwanda | 47.0% |
| Hungary | 45.4% |
| Gambia, The | 43.5% |
A percentage comparison can hide scale. A small country with half of its land classified as arable may still have fewer arable hectares than a very large country with a much lower percentage. The map therefore answers a composition question: how much of each country’s land area falls into the arable category? It does not rank total arable area.
Large economies span a wide range
Among major economies in the supplied data, India is at 51.8%, Germany at 33.4% and France at 31.4%. The United Kingdom is 25.0%, Italy 24.0% and Spain 23.0%. The United States is 16.6%, Korea 14.9%, Argentina 14.8%, China 11.5% and Japan 11.1%. Brazil is 6.7%, Canada 4.3% and Australia 4.0%. The spread is too large to summarize with a single “typical” level for rich, populous or geographically large countries.
| Country | Arable land share in 2023 |
|---|---|
| India | 51.8% |
| Germany | 33.4% |
| France | 31.4% |
| United Kingdom | 25.0% |
| Italy | 24.0% |
| Spain | 23.0% |
| United States | 16.6% |
| Korea, Rep. | 14.9% |
| Argentina | 14.8% |
| China | 11.5% |
| Japan | 11.1% |
| Mexico | 10.3% |
| South Africa | 9.9% |
| Indonesia | 9.4% |
| Russian Federation | 7.4% |
| Brazil | 6.7% |
| Canada | 4.3% |
| Australia | 4.0% |
Those differences should not be turned into single-cause explanations. The series alone does not identify the role of climate, soils, topography, water availability, land-use regulation or historical settlement. It also omits permanent crops and permanent pasture from the arable category, which can be important parts of agriculture in some countries.
A low share does not mean agriculture is unimportant
Twenty-four numeric observations are below 1%. The lowest values include the Faroe Islands, Djibouti, Northern Mariana Islands, Oman, Seychelles, New Caledonia, Suriname, Mauritania, Kuwait and Botswana. A low arable-land percentage only means that a small share of land is in the specific temporary-crop, temporary-meadow, garden or temporary-fallow categories. It does not directly measure the economic importance of agriculture or the intensity of production on the land that is cultivated.
Missing values also must be kept separate from zeros. The supplied 2023 master table retains 11 missing rows as NA rather than replacing them with zero or borrowing an earlier year. On the map, gray may indicate a missing value or a geography that did not join directly to the low-resolution boundary layer.
Annual changes can reflect revisions as well as land-use change
The World Bank metadata notes that year-to-year variation may reflect updated or revised data and not only physical change in land area. That matters when using the series as a time trend. A small annual movement should not automatically be described as rapid expansion or loss of cropland without checking the underlying national reporting and revision history.
The denominator is land area, which excludes major inland water bodies such as large rivers and lakes. Consistent use of the official denominator is necessary for cross-country comparison, especially when readers are accustomed to total-area figures that include inland water.
Data source and map method
The analysis uses World Bank World Development Indicators series AG.LND.ARBL.ZS for the single common year 2023. The supplied dataset contains 217 country/economy master rows after aggregate groups are excluded; 206 numeric values are used for the ranking, distribution and descriptive statistics, and 11 missing values remain unfilled. No interpolation or synthetic estimates were added.
The definition and methodology are available in the World Bank WDI metadata glossary. The World Bank identifies FAO as the underlying source. Country values can also be checked on the World Bank indicator page. The map in this article was newly generated from the verified 2023 values and a low-resolution Natural Earth country boundary layer.
Frequently Asked Questions
Is arable land the same as agricultural land?
No. Arable land covers temporary crops, temporary meadows, market or kitchen gardens, and temporary fallow. Agricultural land is broader because it also includes permanent crops and permanent pasture.
Does a high arable-land share mean higher farm productivity?
No. The indicator measures the share of land area in the arable category. It does not directly measure yields, crop output, irrigation, soil quality or agricultural value added.
Do gray countries on the map have zero arable land?
Not necessarily. Gray can represent a missing 2023 value or a geography that could not be matched directly to the low-resolution map boundary. Missing values were not converted to zero.
Does this indicator show land that could potentially be cultivated?
No. World Bank metadata explicitly distinguishes the measured arable-land category from the amount of land that might be potentially cultivable.
Related Articles
For other global comparisons and reference maps on Green Map, see these pages:
- Global Population Growth Map – 2025 Country Comparison
- Global Internet Use Map – 2024 Country Comparison
- South America Map – Printable Country Map Collection
Green Map creates custom-edited map images using open geographic data sources such as geoBoundaries, Natural Earth, OpenStreetMap, and government open data.
These maps are edited visual materials, not raw data files, and are provided for education, documents, presentations, and graphic reference.