
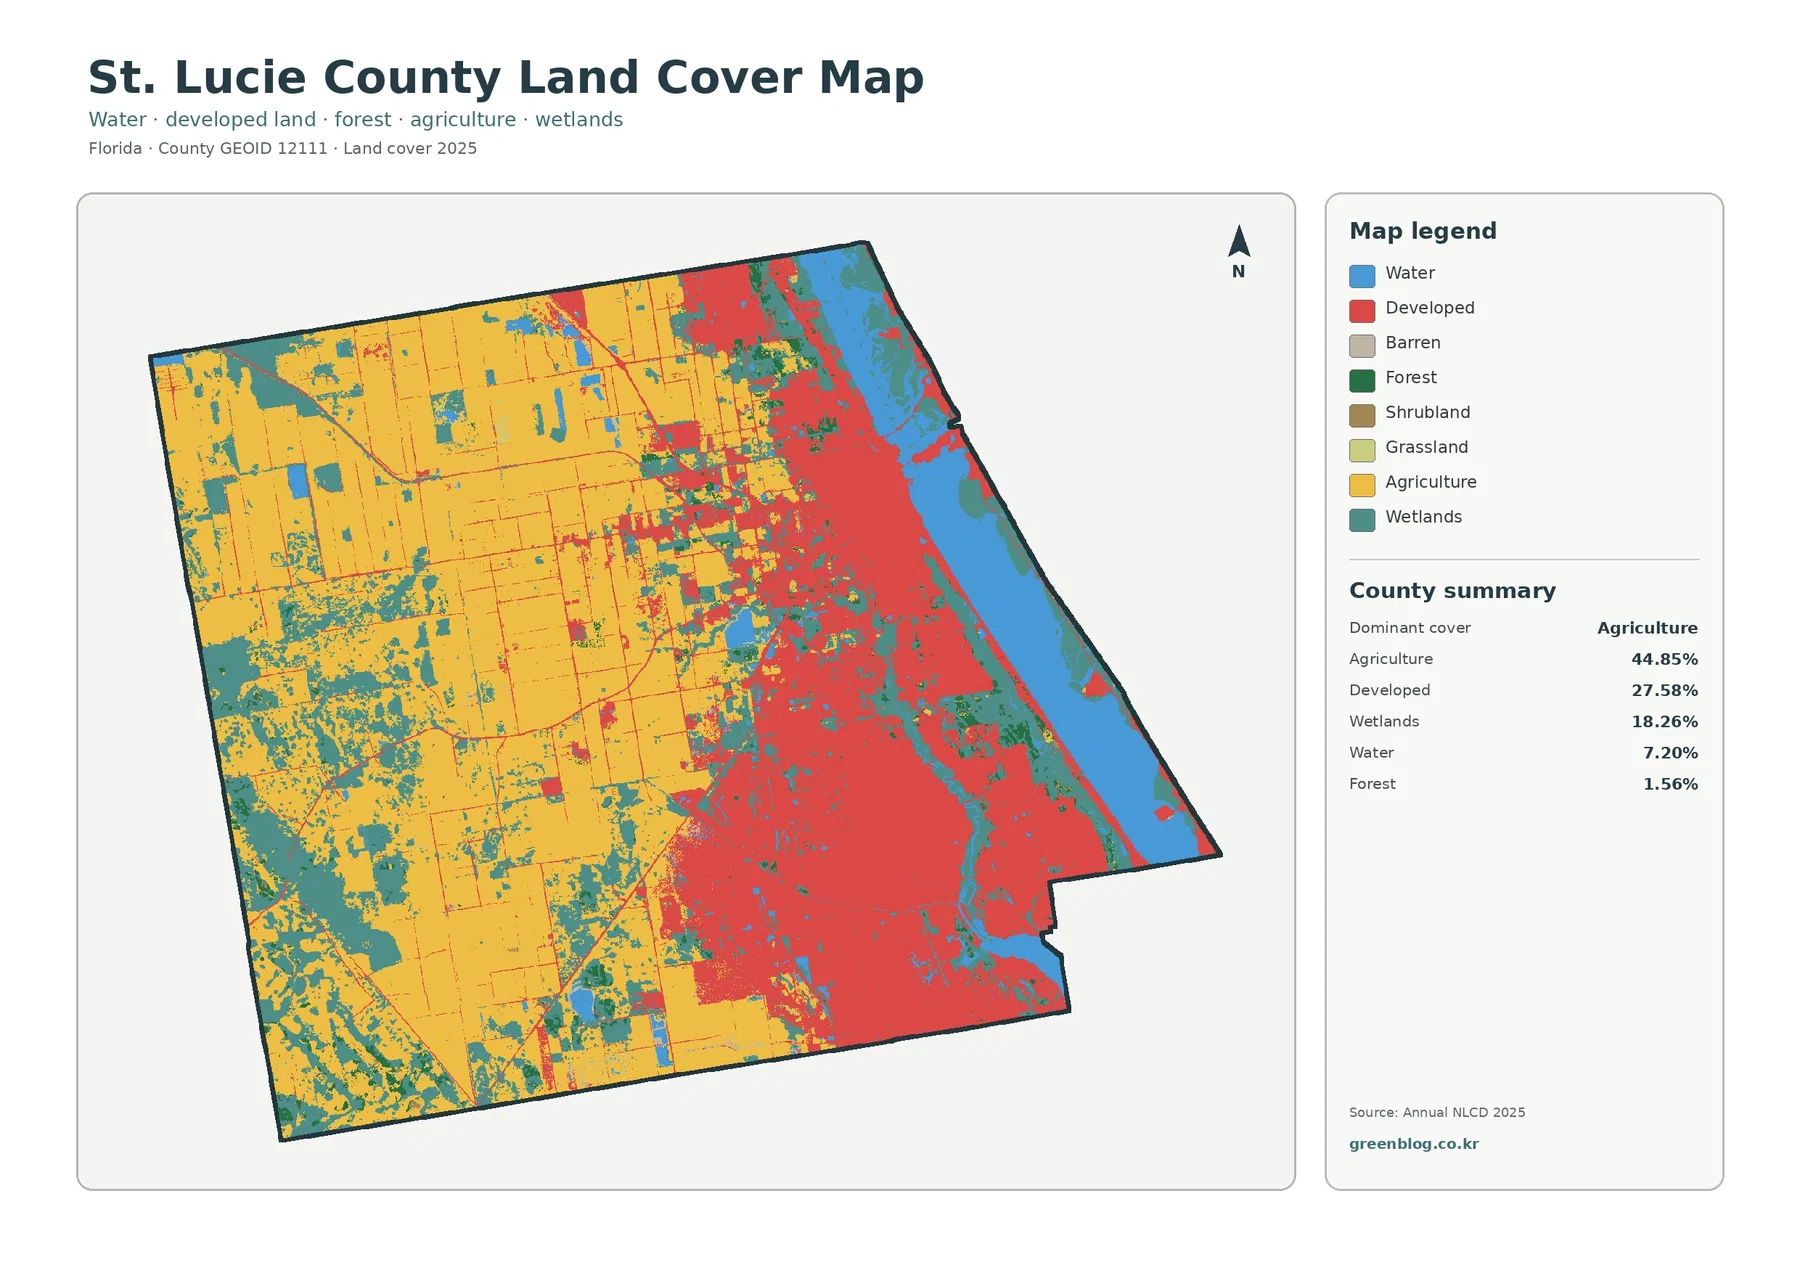
St. Lucie County Florida Land Cover Map: Farmland West, Developed East, and Wetland Pockets
The St. Lucie County Florida Land Cover Map is defined by a strong west-to-east contrast. Agriculture covers 44.85% of the […]
The St. Lucie County Florida Land Cover Map is defined by a strong west-to-east contrast. Agriculture covers 44.85% of the […]
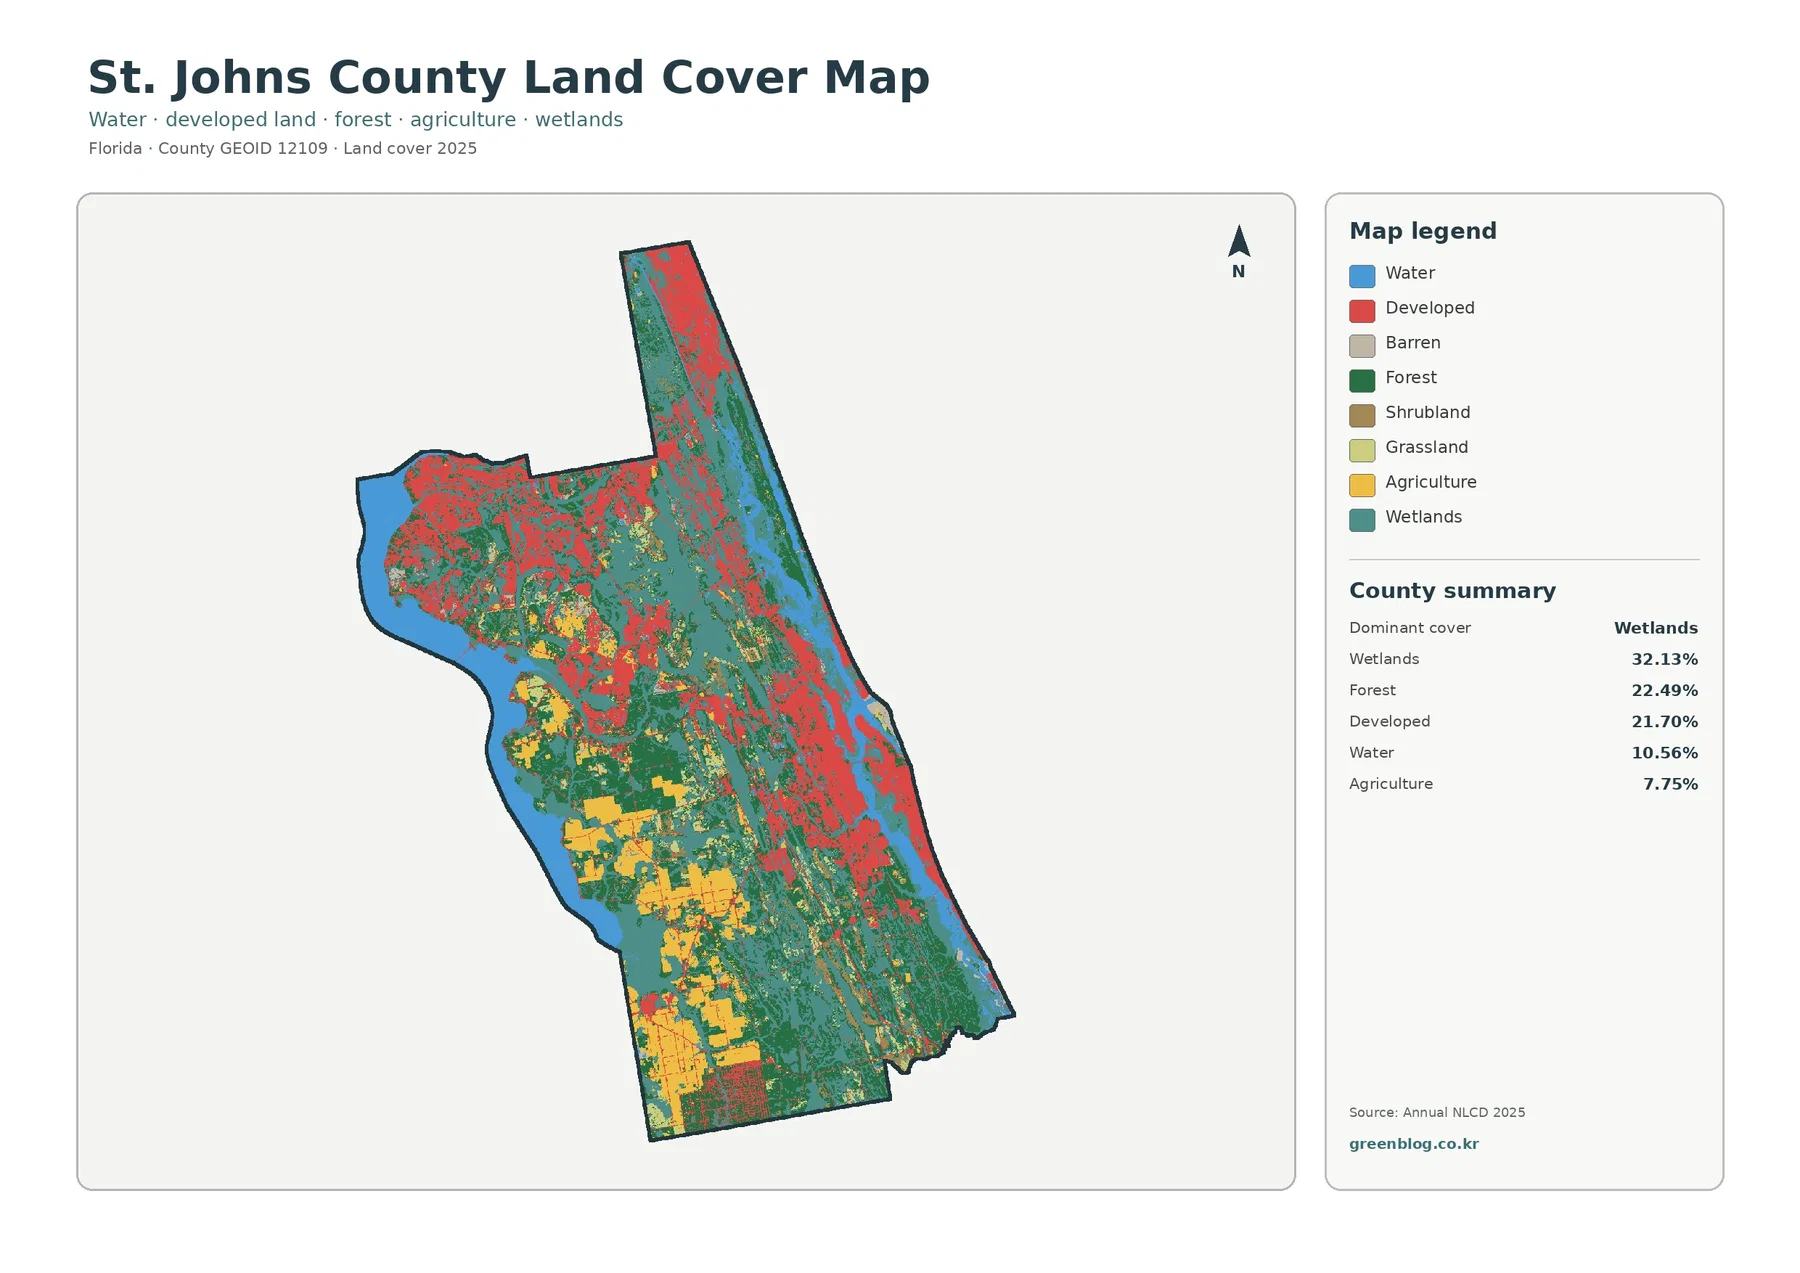
The St. Johns County Florida Land Cover Map shows a county where no single surface type tells the whole story.
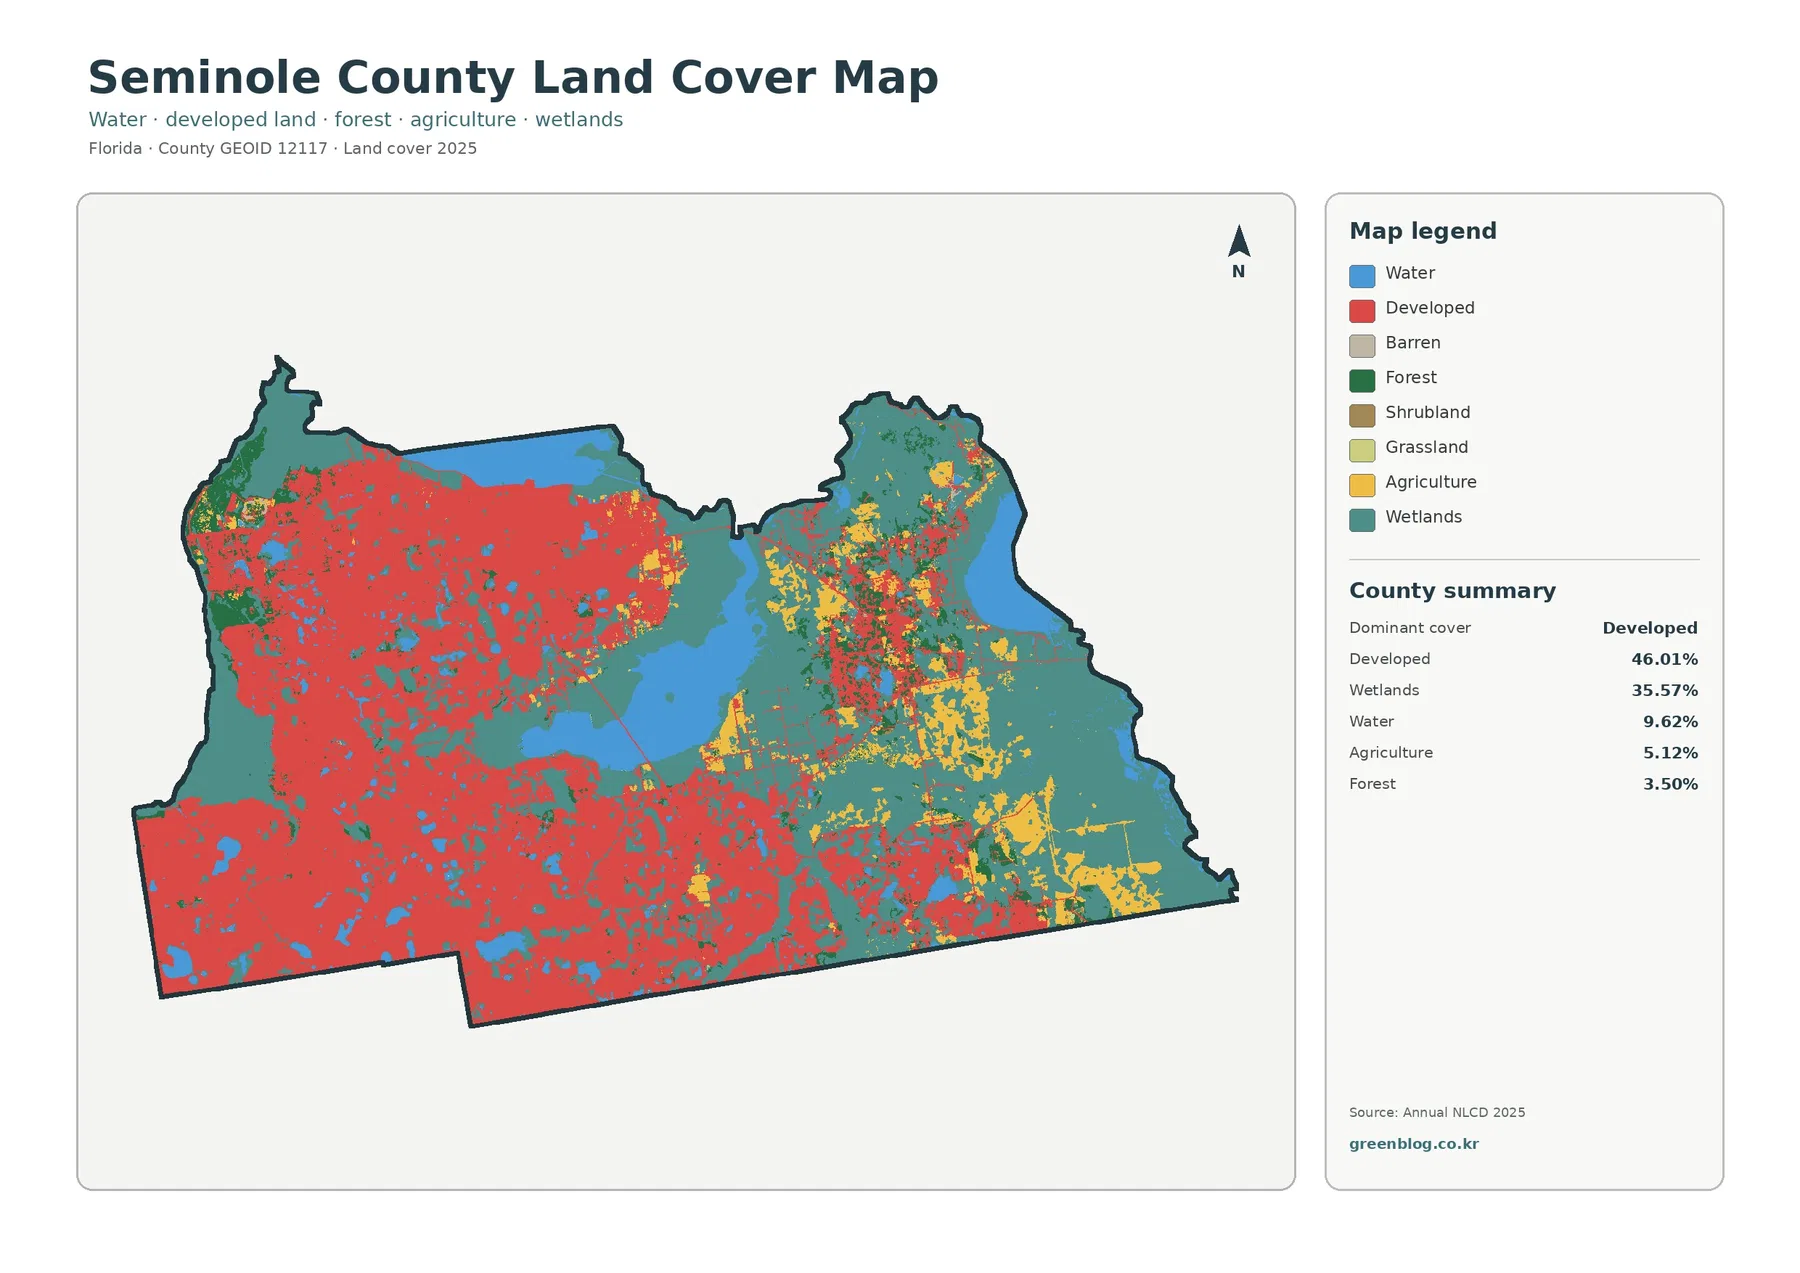
Seminole County’s 2025 land-cover pattern is defined by a strong split between built-up western and southern areas and wet, water-rich
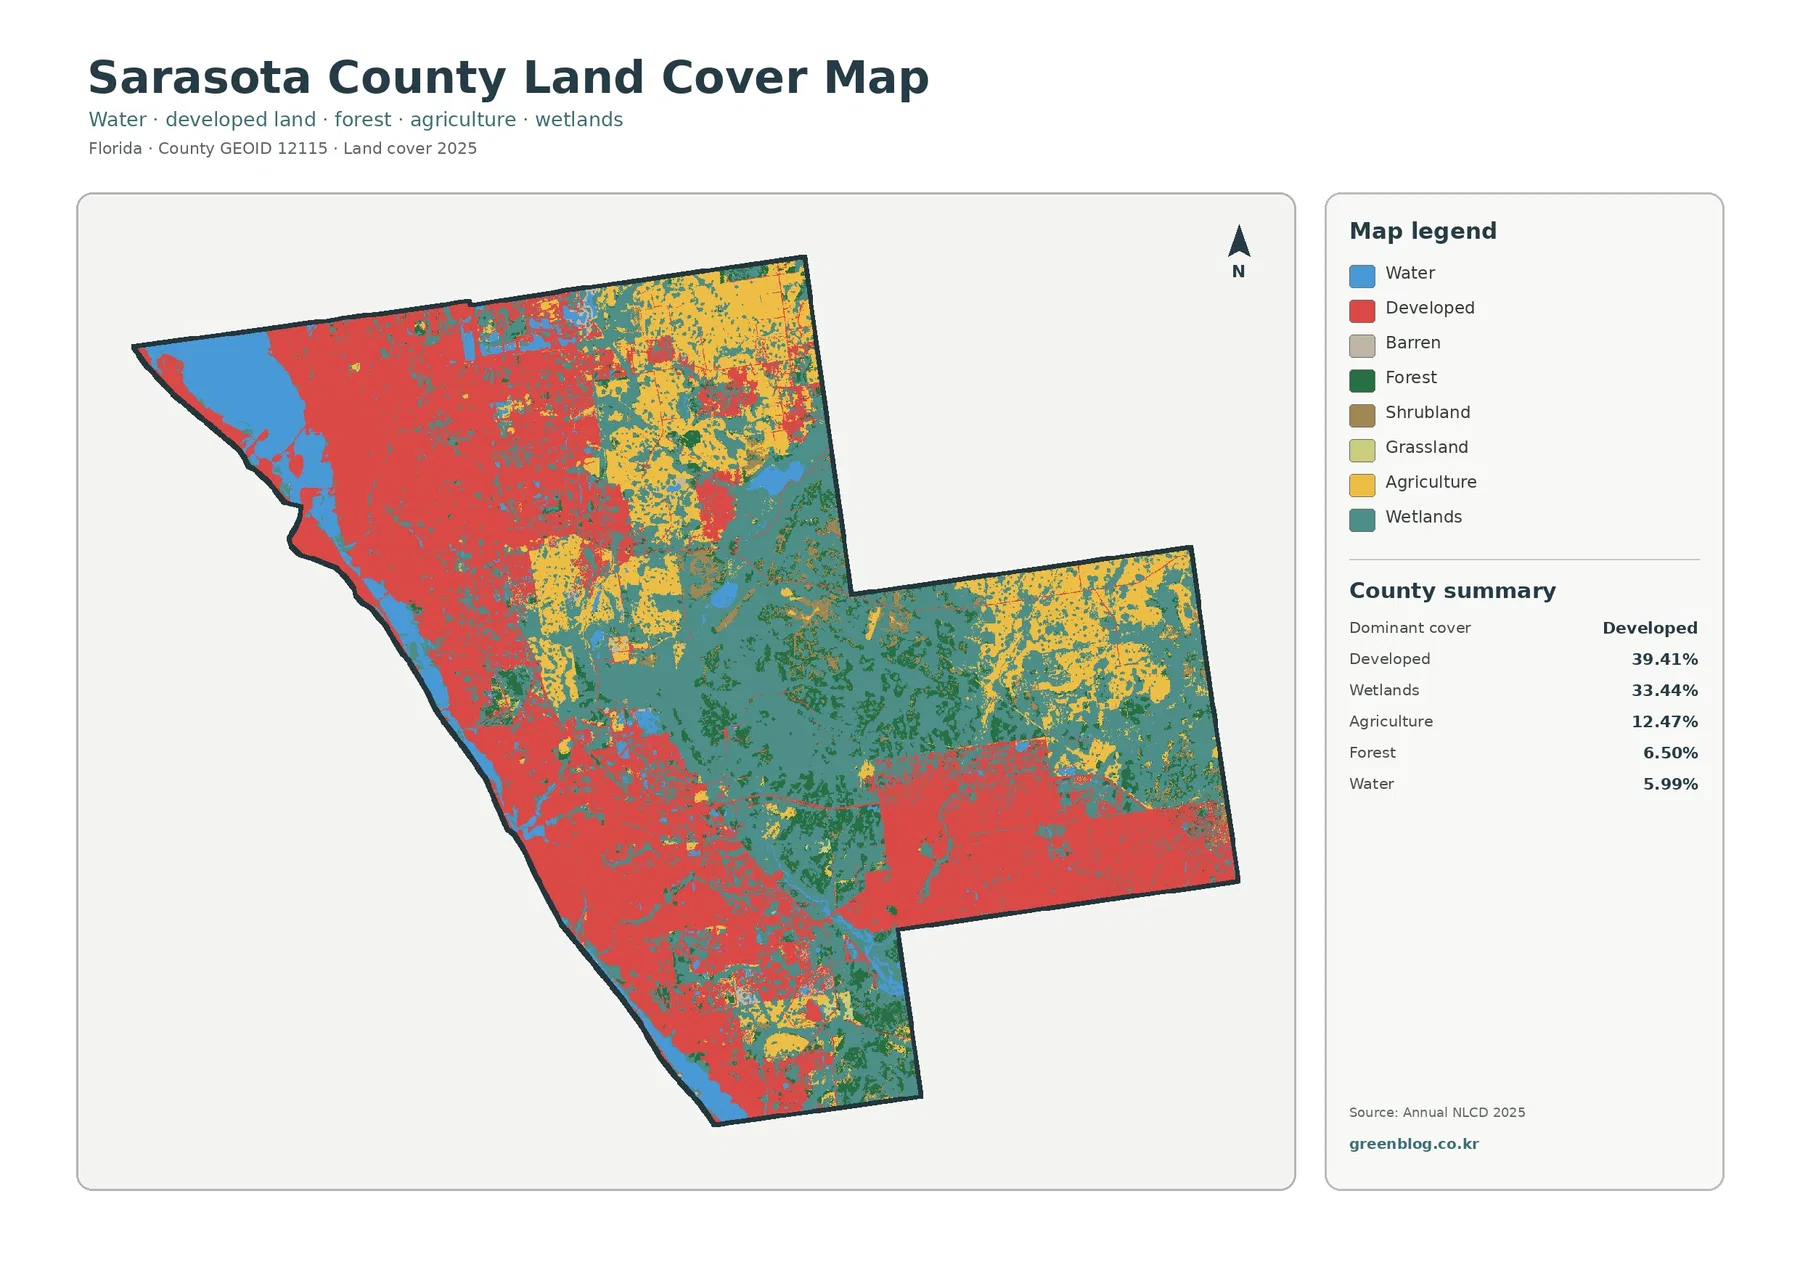
Sarasota County’s 2025 land-cover pattern is split sharply between a developed western side and a wetter, more agricultural interior. The
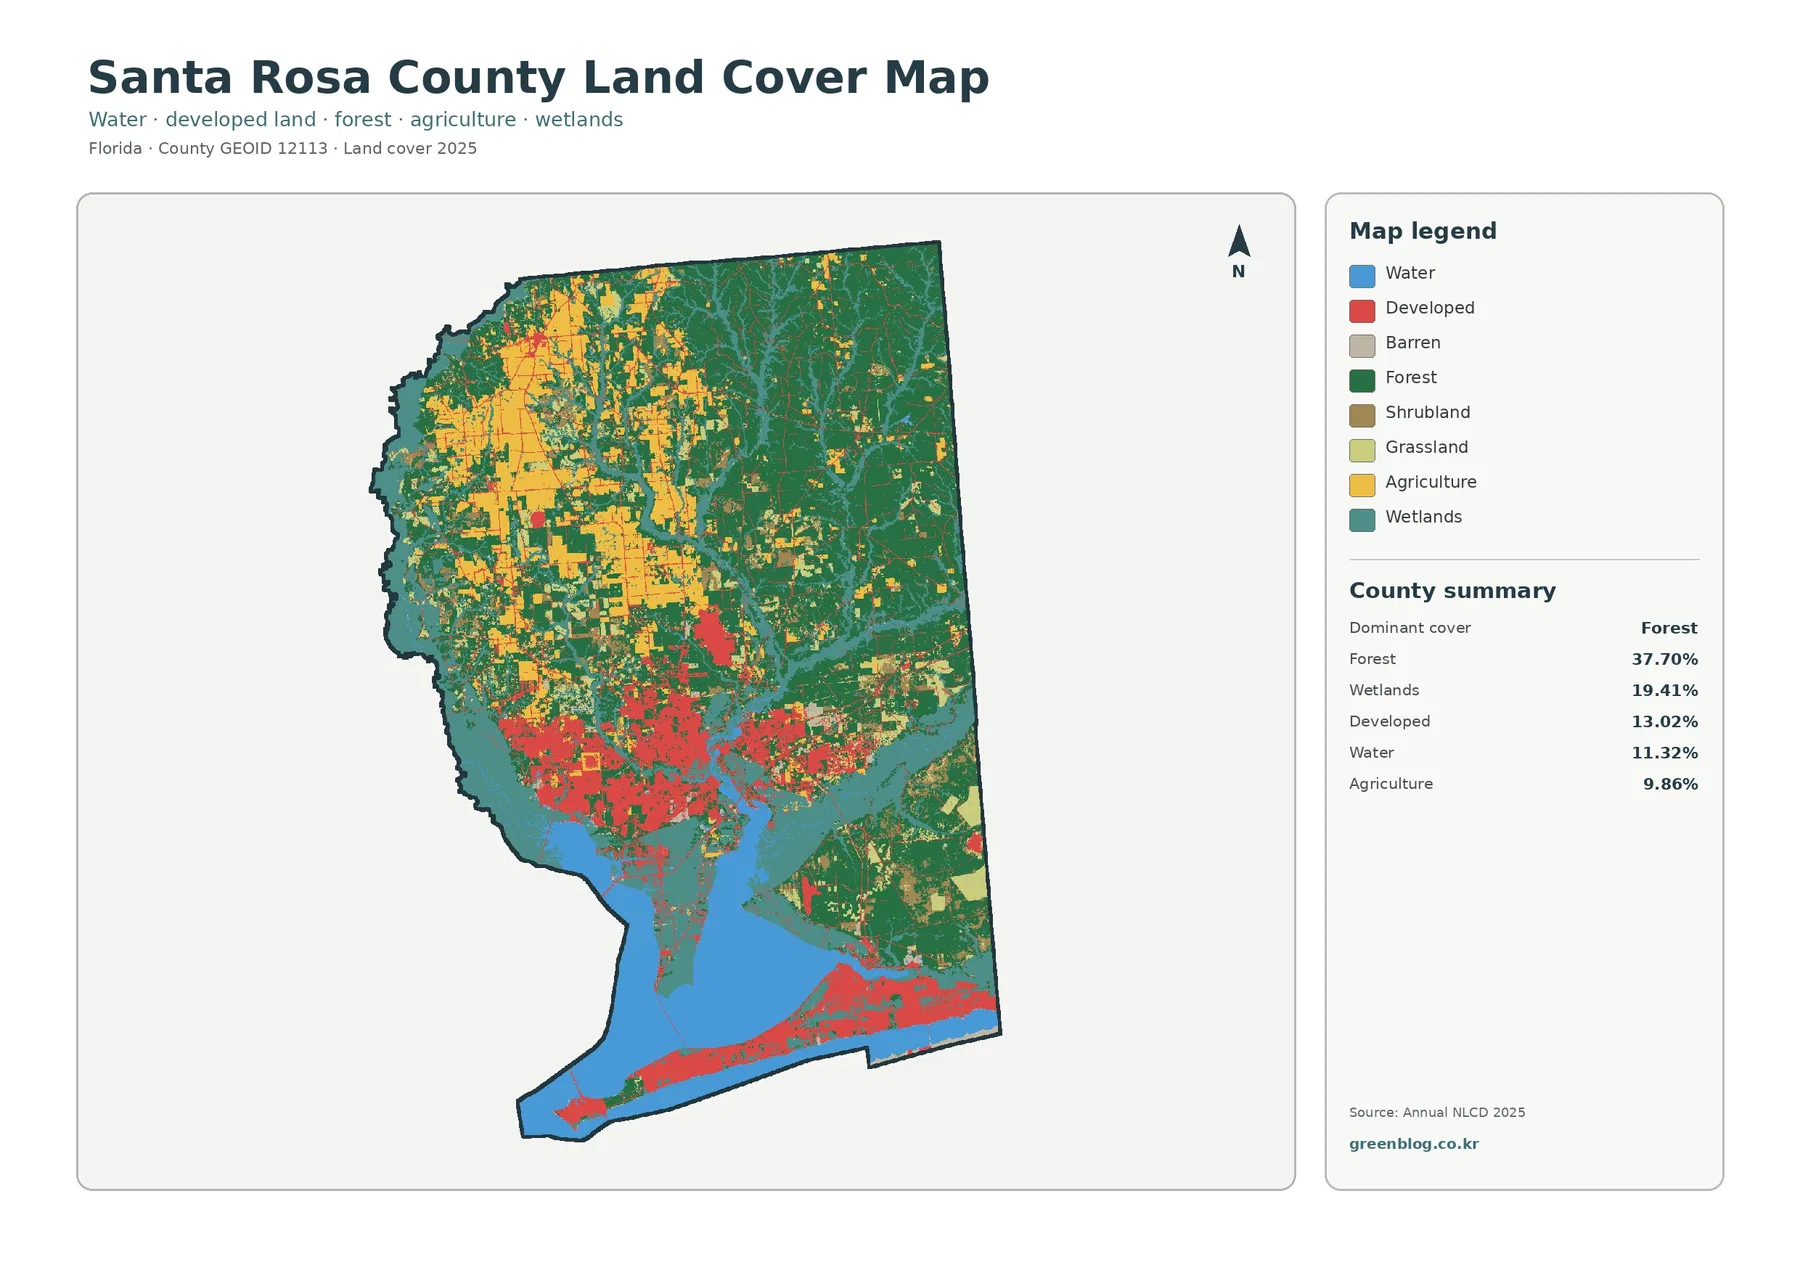
Santa Rosa County has a clear north-to-south contrast in the supplied 2025 land-cover data. Forest is the largest class at
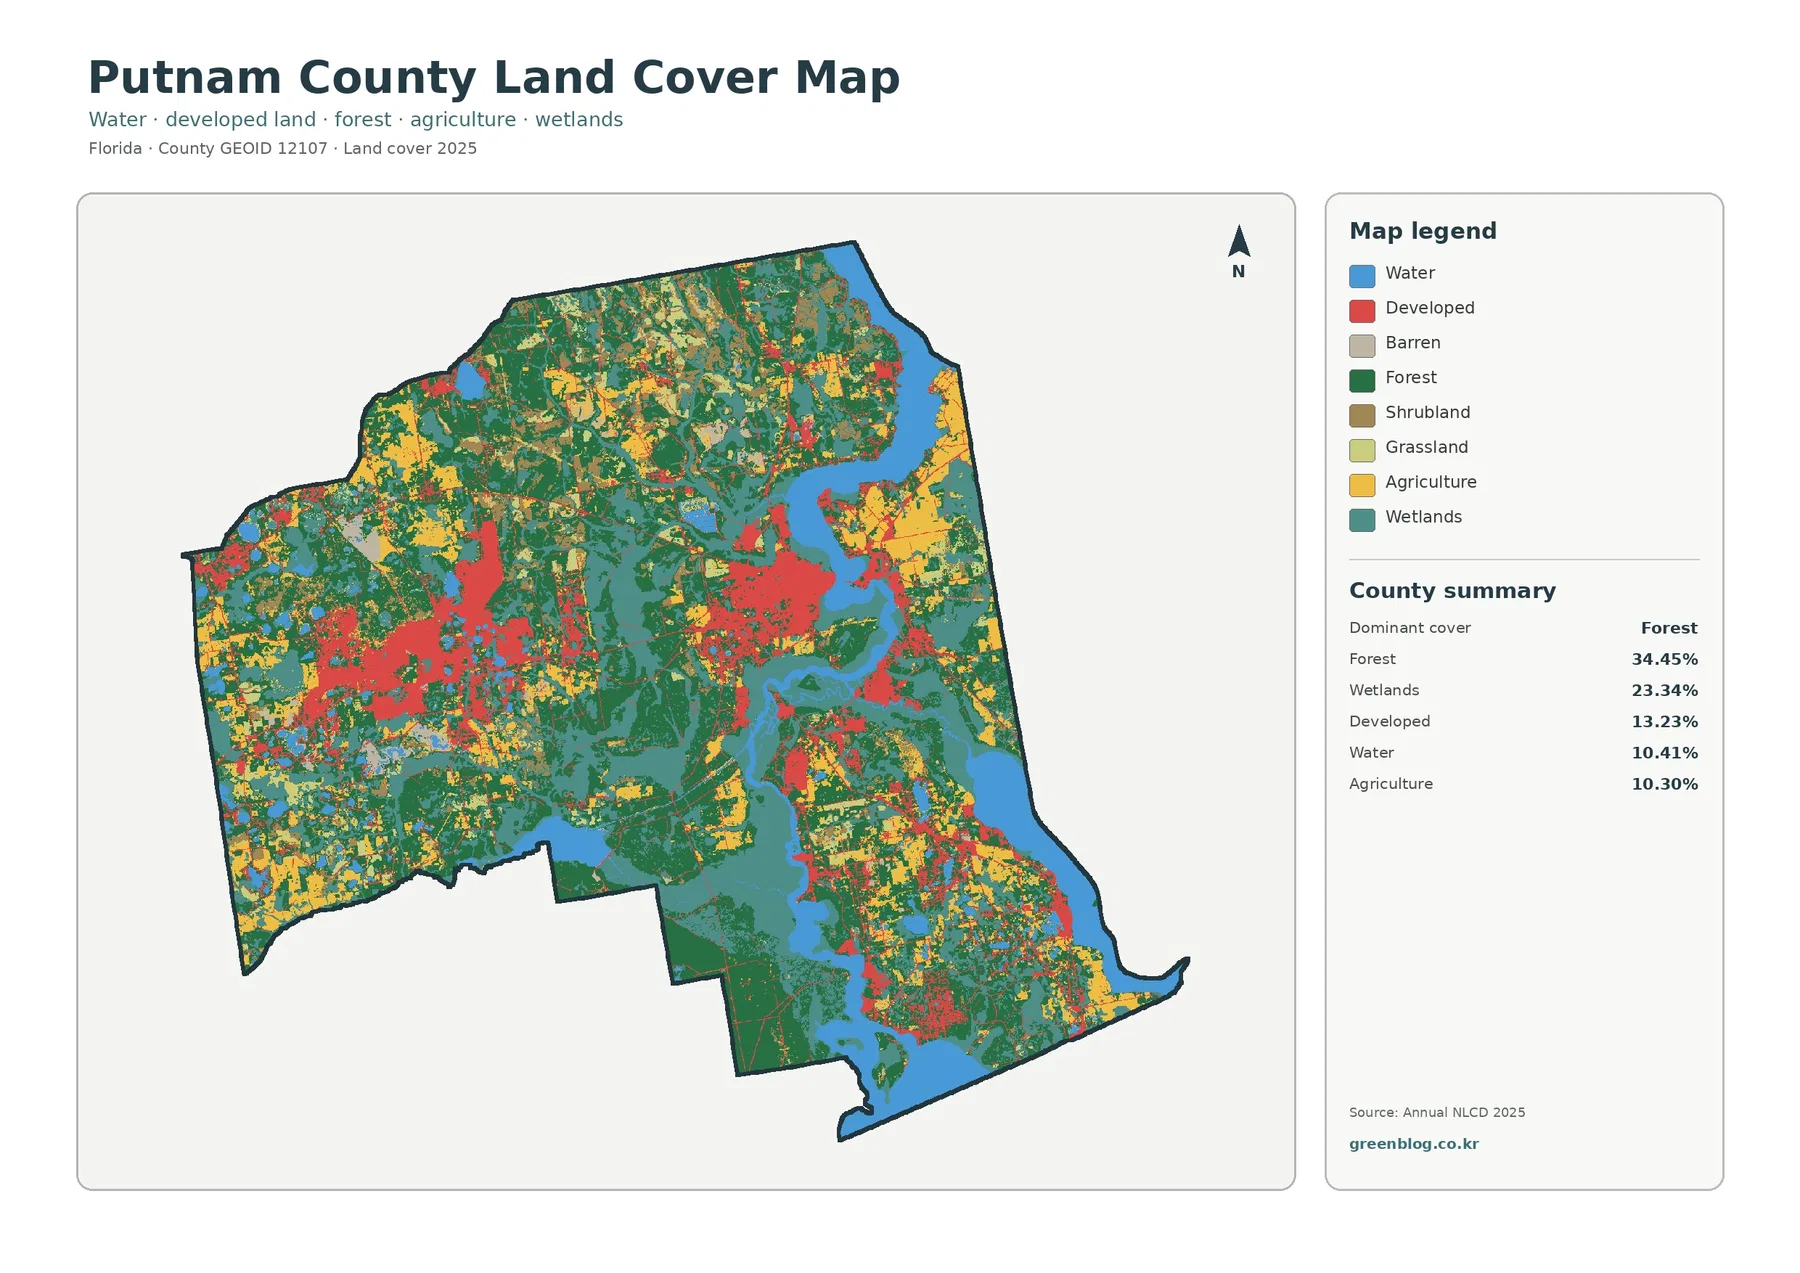
The Putnam County Florida Land Cover Map is defined by a mix rather than a single overwhelming surface. Forest is
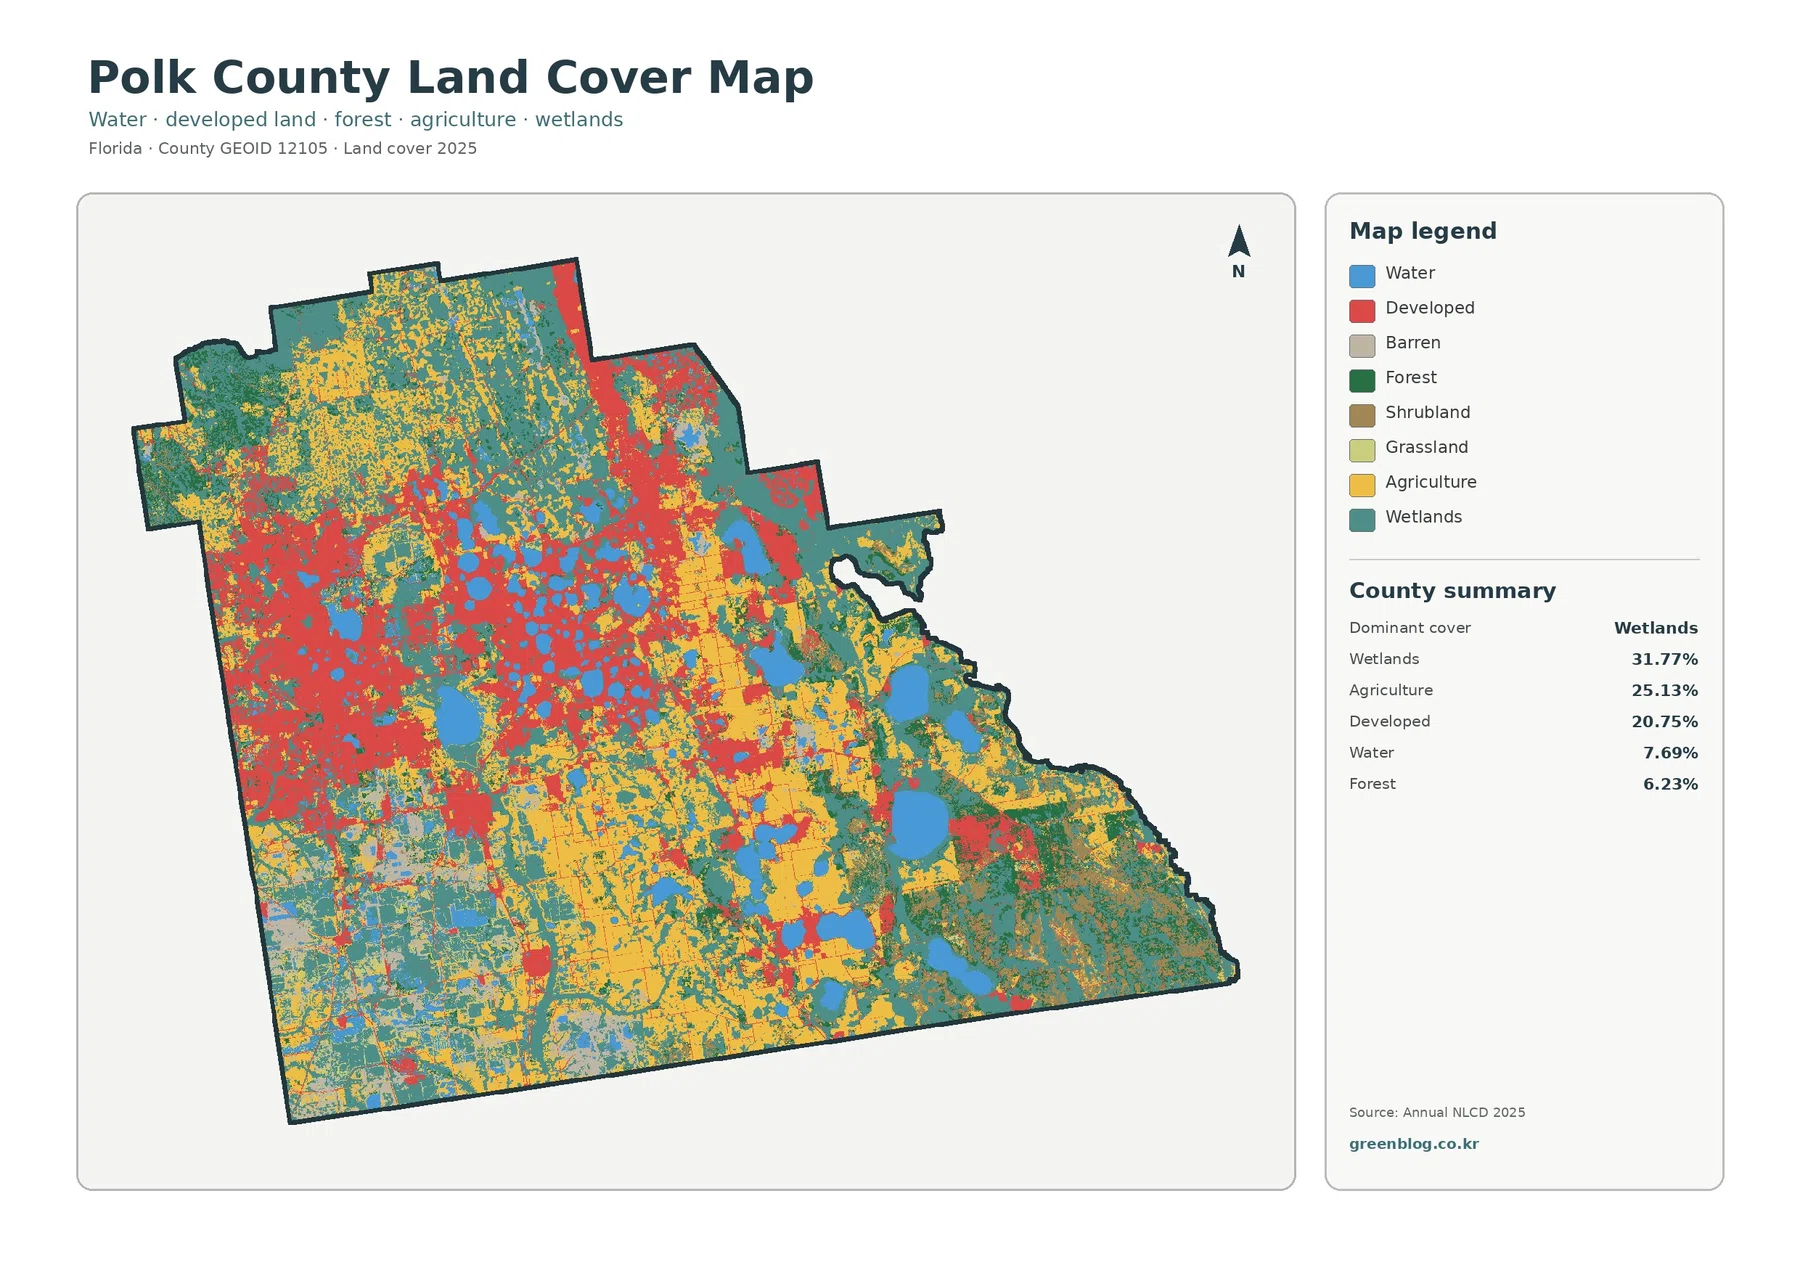
The Polk County Florida Land Cover Map does not have a single land-cover class that overwhelms the rest of the
Polk County Florida Land Cover Map: Wetlands, Working Land, and a Lake-Rich Interior Read More »
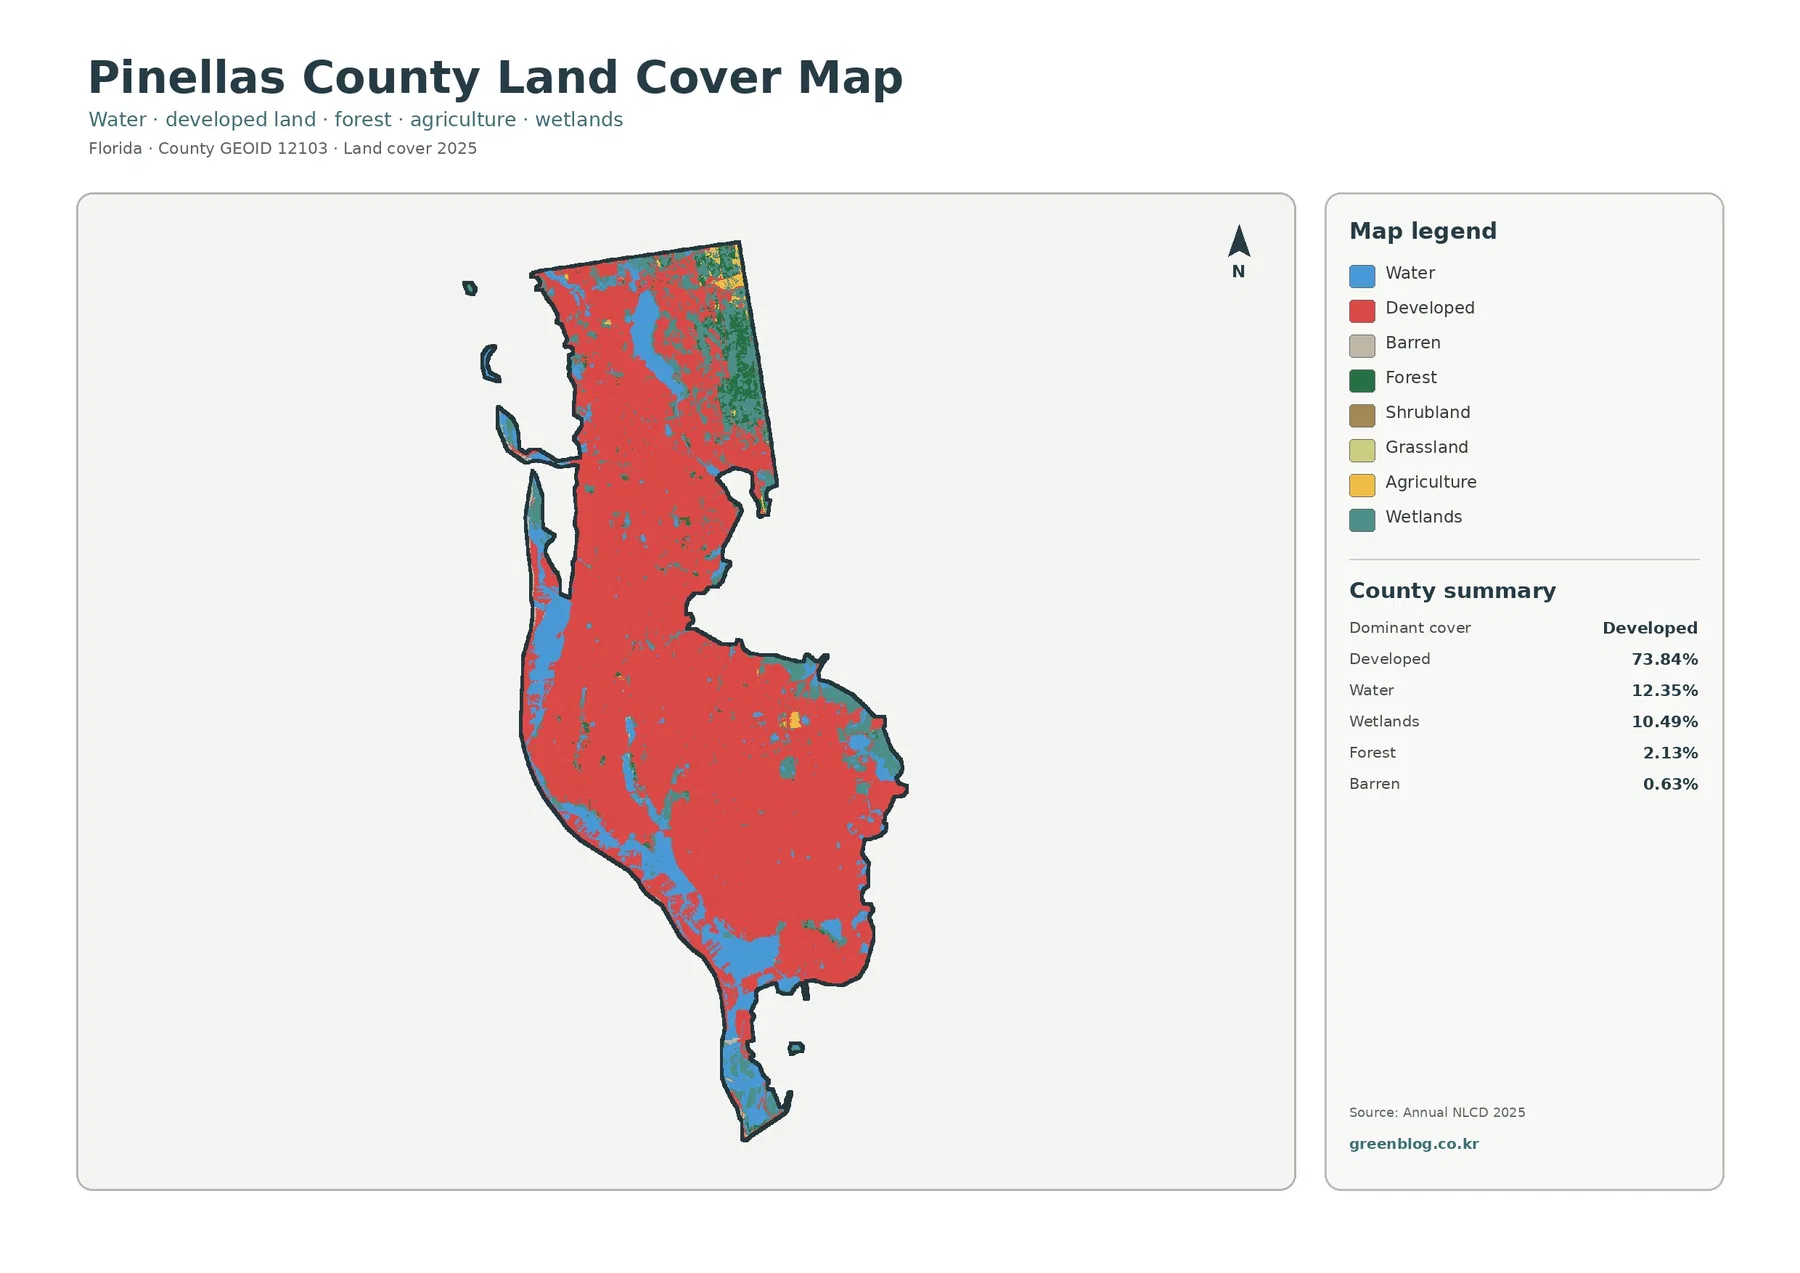
The 2025 Pinellas County land-cover summary is dominated by one category: developed land covers 73.84% of the mapped county area.
Pinellas County Florida Land Cover Map: An Urban Peninsula with 73.84% Developed Cover Read More »
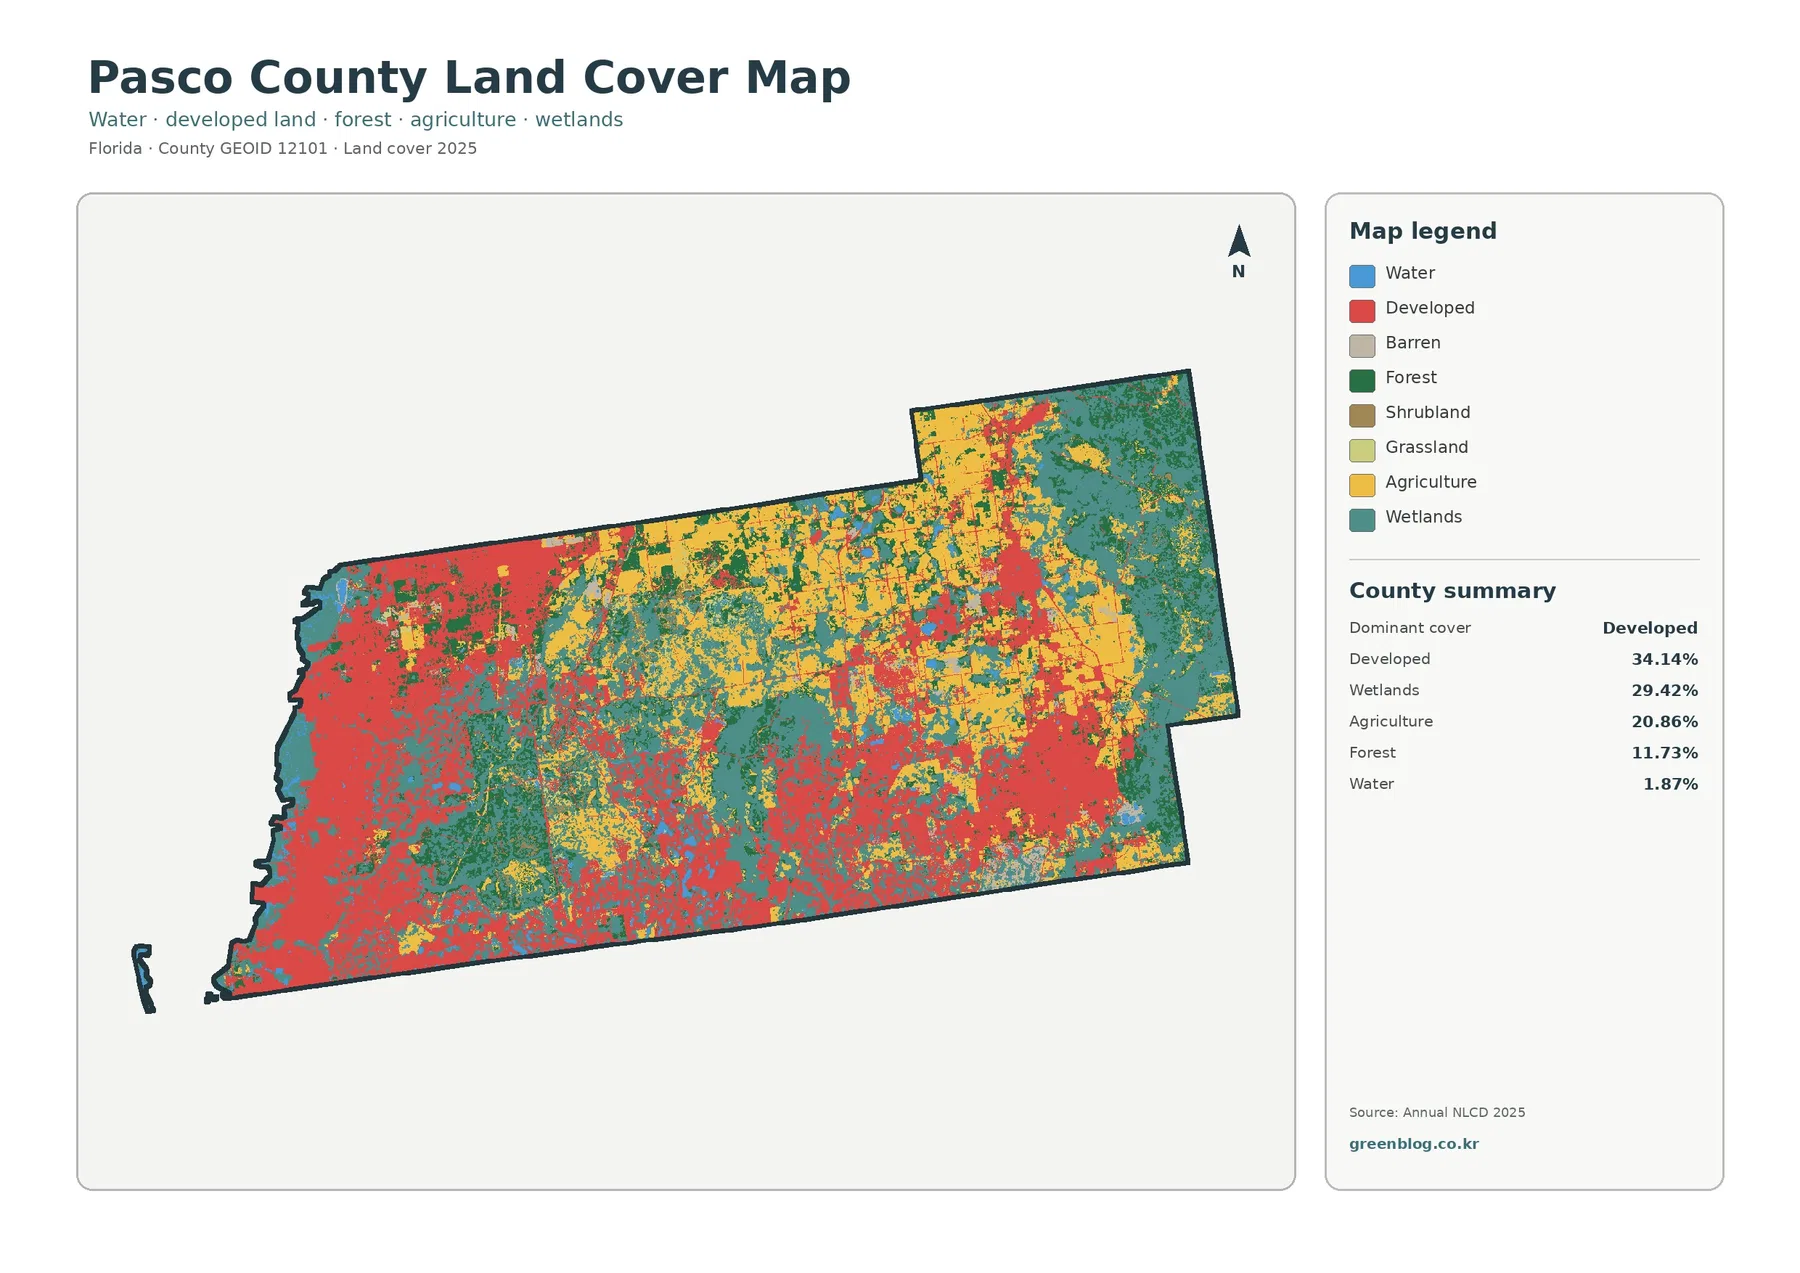
Pasco County’s 2025 land-cover pattern is defined by three large classes rather than one overwhelming category. Developed land leads at