The share of primary-school teachers who meet their country’s minimum teacher-training requirement varies widely across the world. The World Bank indicator SE.PRM.TCAQ.ZS measures trained teachers in primary education as a percentage of all teachers at that level. “Trained” does not mean a single global credential. It refers to the minimum organized teacher-training requirement, before service or during service, that is recognized by the relevant national policy or law.
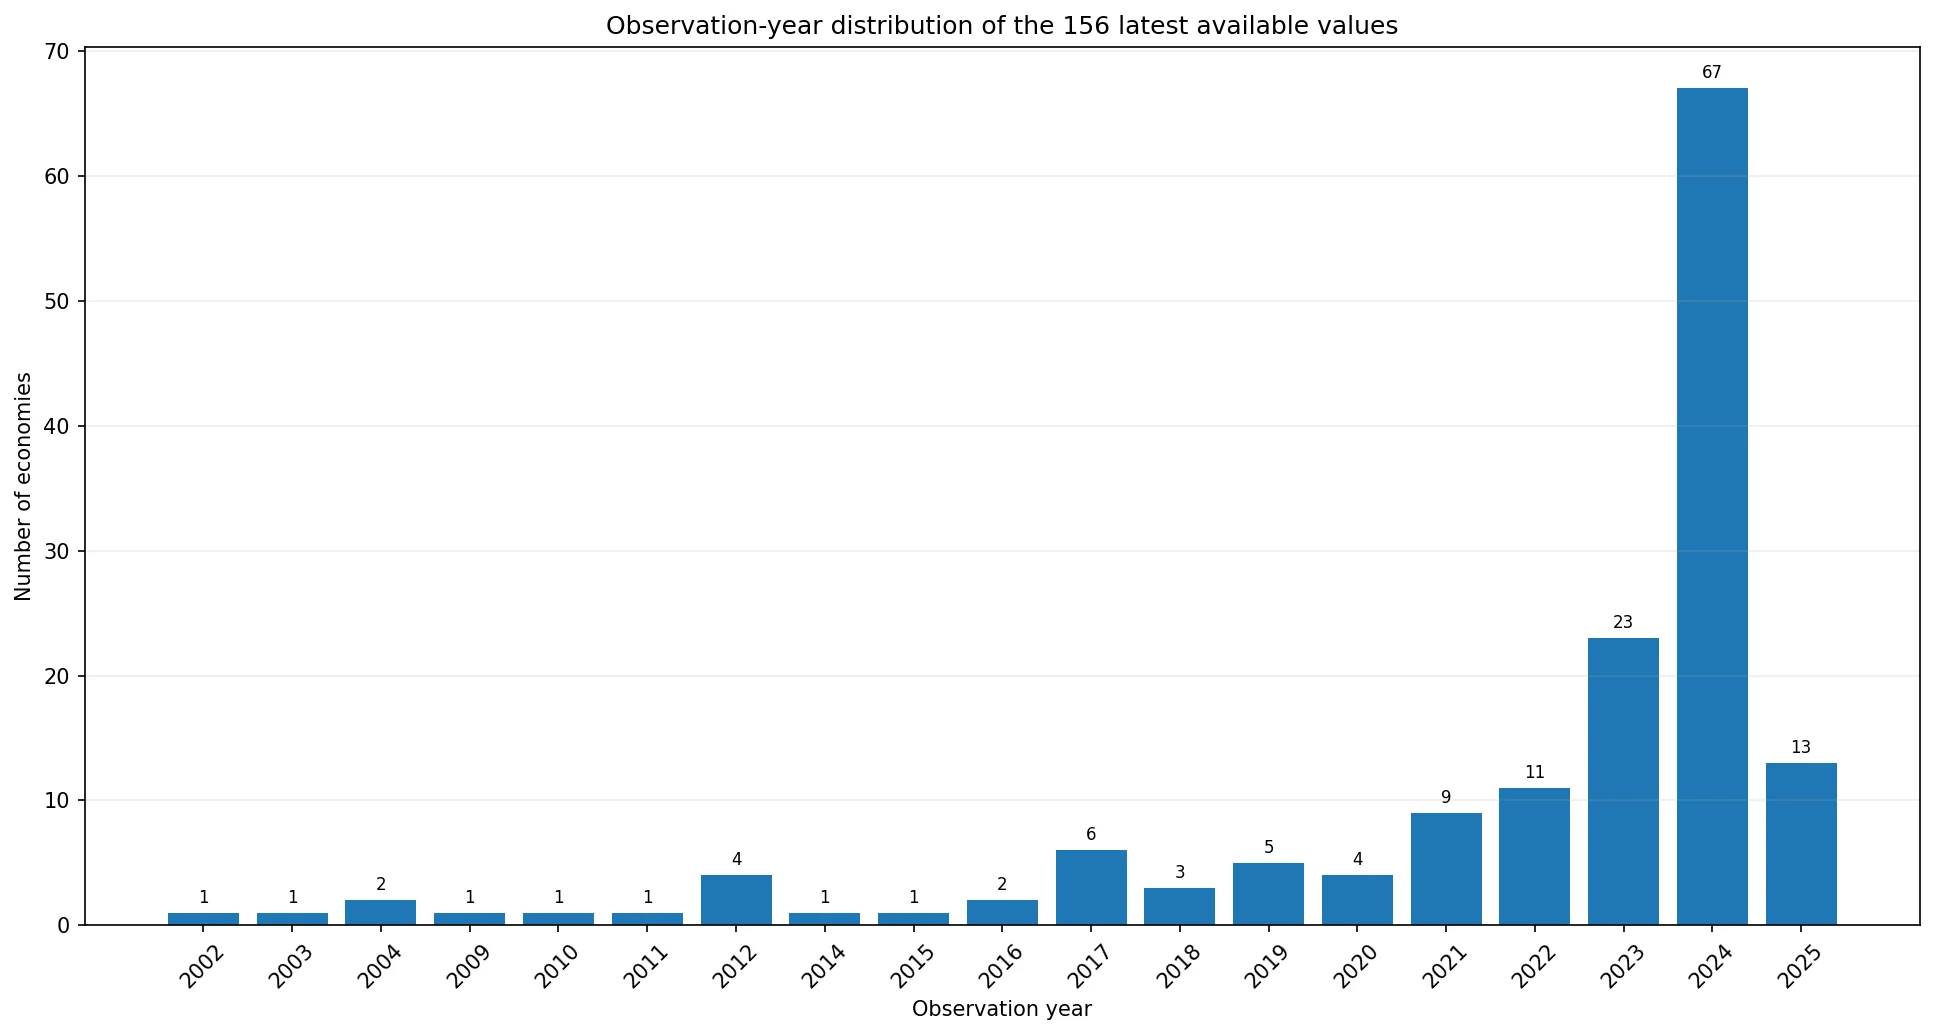
The latest non-empty observations cover 156 economies, but they do not describe one common year. The earliest latest observation is from 2002 and the newest is from 2025. The largest group is 2024 with 67 economies. The map is therefore a latest-available comparison, not a uniform 2025 world ranking.
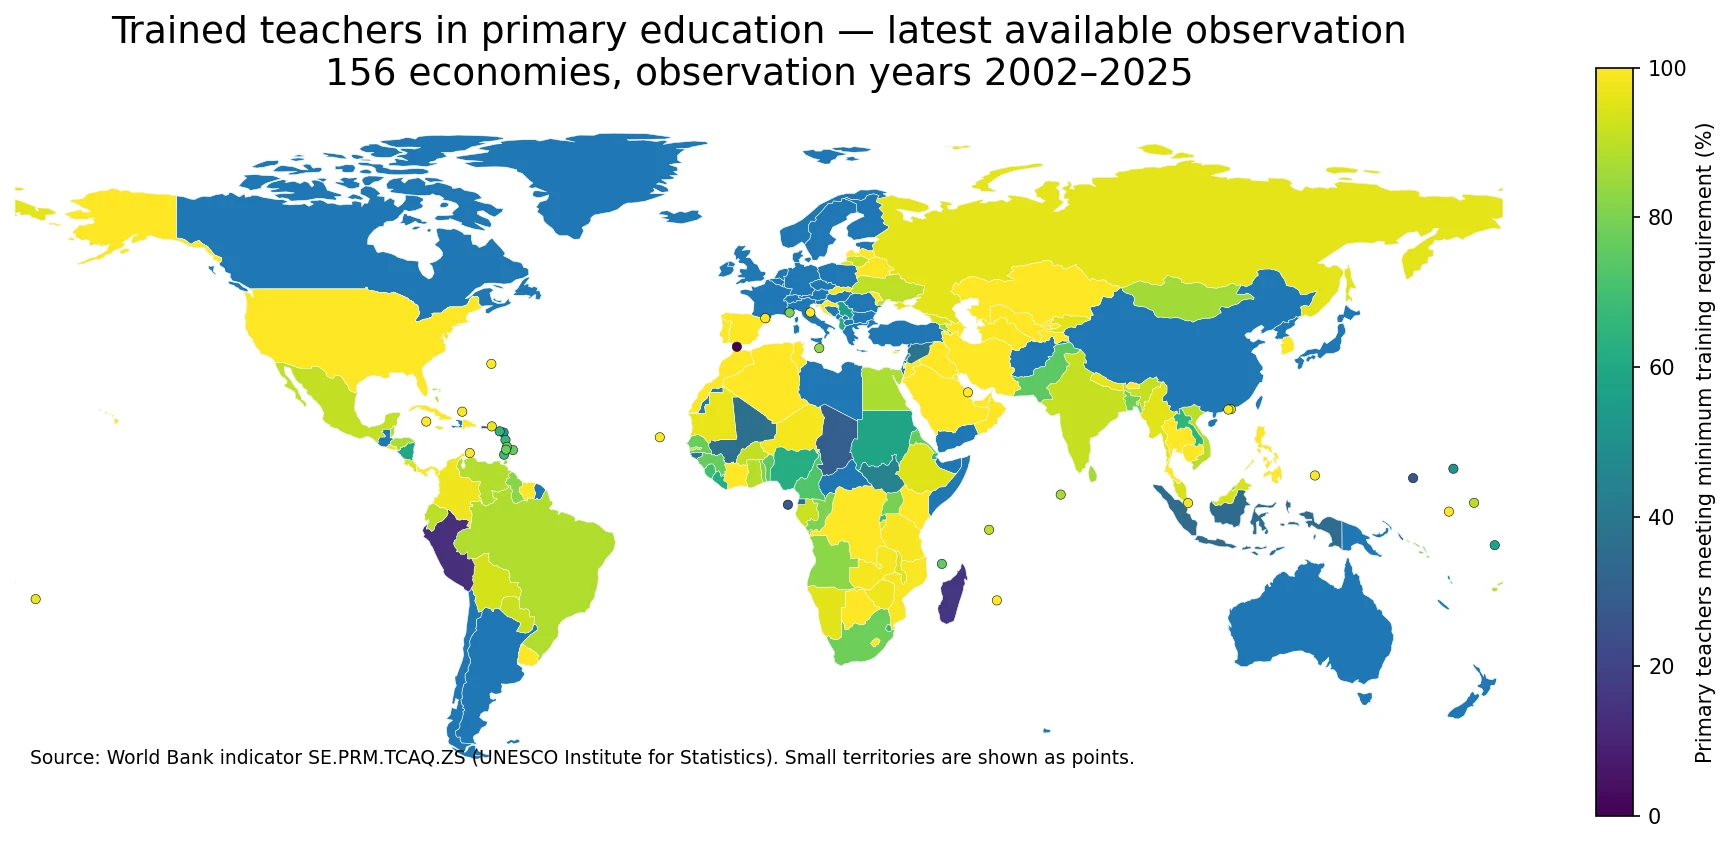
Table of Contents
What counts as a trained primary teacher
UNESCO Institute for Statistics defines a trained teacher as someone who has fulfilled at least the minimum organized teacher-training requirements needed to teach a specific level of education under the relevant national policy or law. Those requirements can be met through pre-service or in-service training. They normally concern pedagogical and professional preparation, but the exact national standard can differ.
That definition is crucial for interpreting the percentage. A value of 100% means every primary teacher counted in that economy met the nationally defined minimum training requirement. It does not mean every teacher completed an identical international programme, and it does not directly measure teaching effectiveness, subject knowledge, classroom practice, student learning, teacher shortages, or the broader quality of the education system.
The latest observations span more than two decades
Of the 156 latest values, 67 are from 2024, 23 from 2023, and 13 from 2025. Together, those three years account for 103 observations. Another 11 are from 2022 and nine from 2021, while the remaining economies have their most recent available value somewhere between 2002 and 2020.
This uneven timing changes how the map should be read. A simple ranking of all 156 values would mix economies observed under different policy settings and in different years. It can still reveal the broad distribution of reported training coverage, but it is less suitable for claiming that one economy currently performs better than another. For a tighter cross-country comparison, a same-year subset is more defensible.
The overall distribution is high, but the lower tail is substantial
Across all 156 latest observations, the median is 92.82% and the mean is 84.00%. The first quartile is 76.88%, while the third quartile reaches 100%. This combination shows a distribution with many very high reported shares and a smaller set of much lower values that pull the average below the median.
Forty-two economies report exactly 100% in their latest observation, and 84 are at or above 90%. At the other end, 34 are below 75% and 13 are below 50%. The lowest latest values include Gibraltar at 0.0% in 2024, Peru at 13.09% in 2023, Madagascar at 15.27% in 2019, Puerto Rico (US) at 25.02% in 2024, and Micronesia, Fed. Sts. at 27.00% in 2023. The years attached to those examples are as important as the percentages themselves.
The 2024 subset gives a cleaner same-year comparison
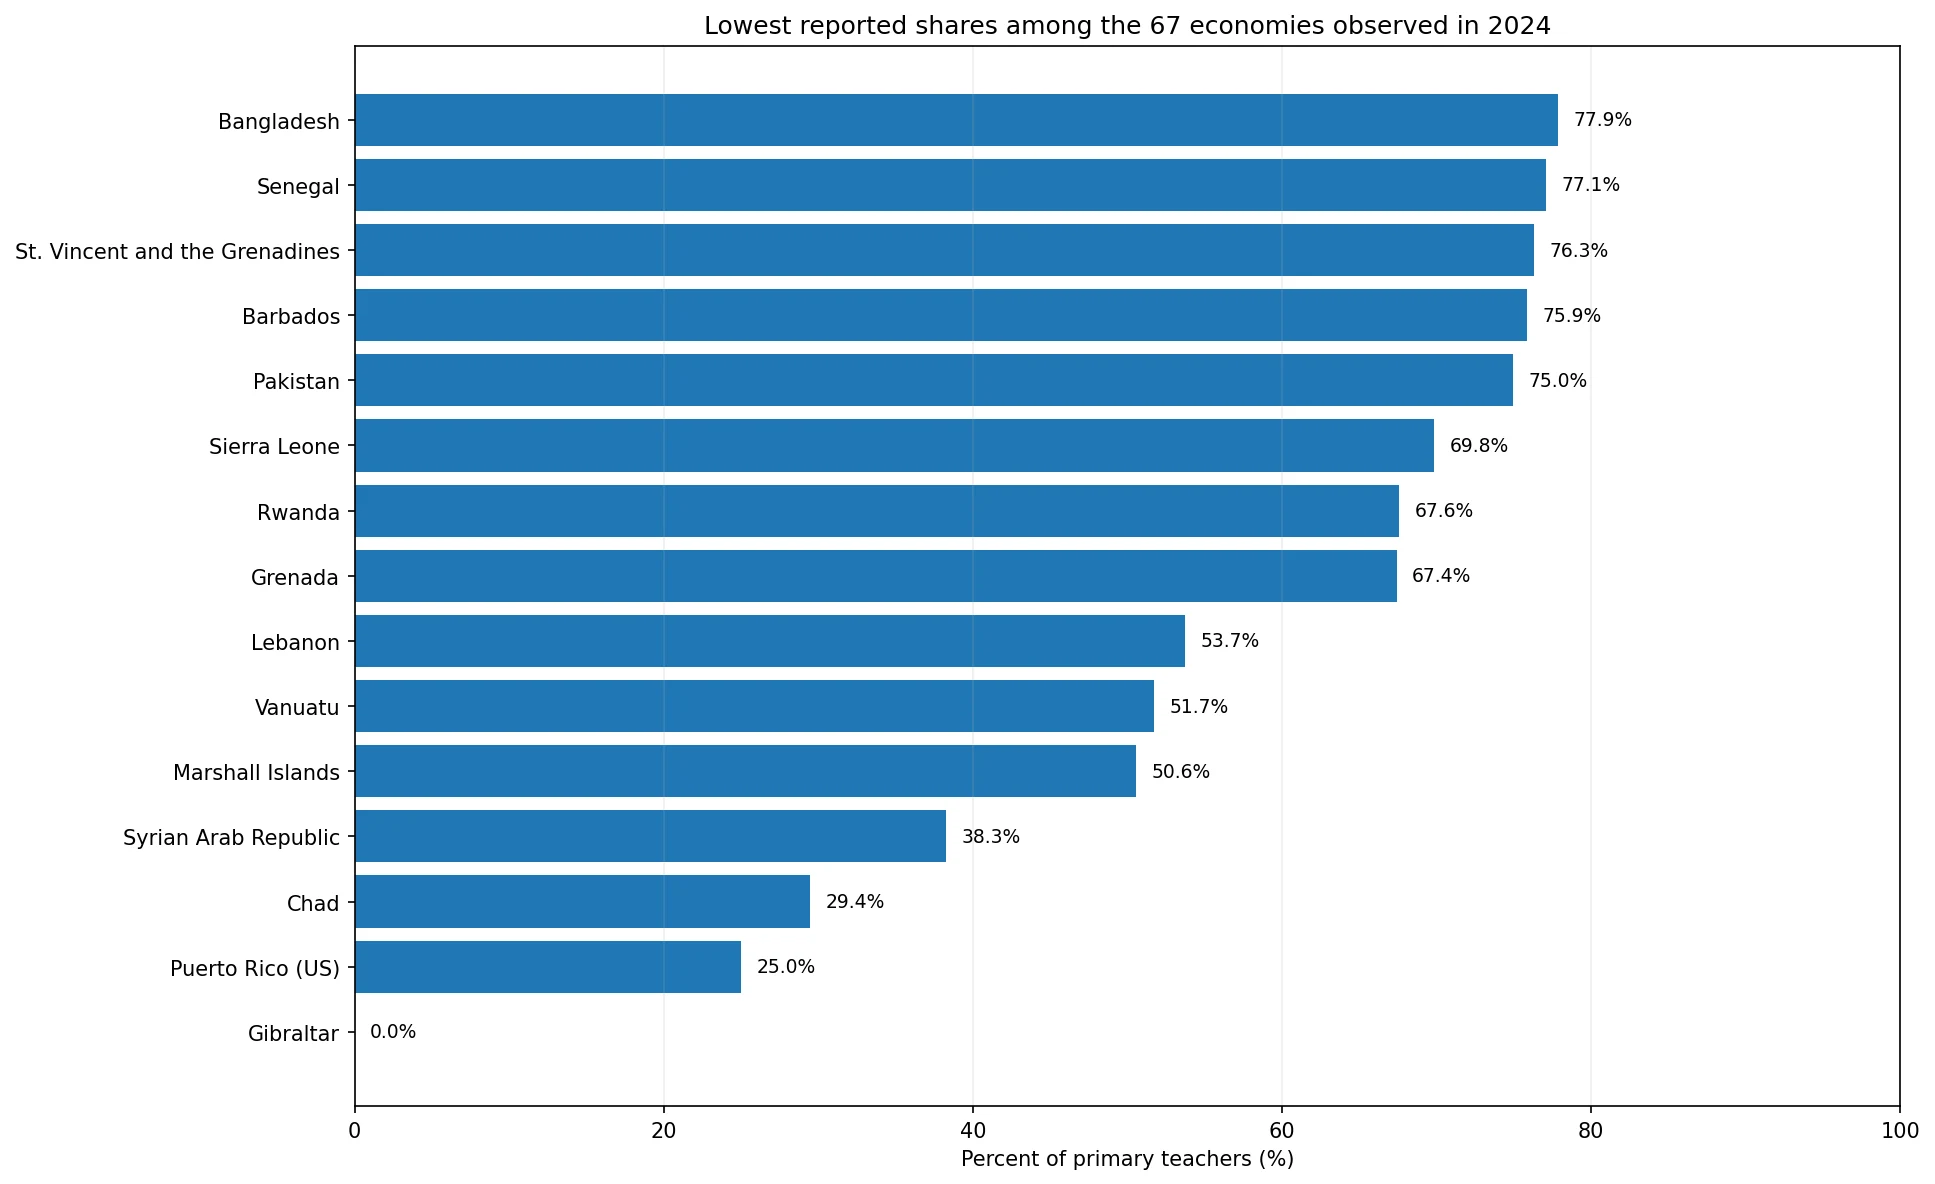
Restricting the view to the 67 economies observed in 2024 removes much of the timing problem. The median for that subset is 90.98% and the mean is 85.74%. Seventeen economies report 100%, another 17 fall from 90% to just under 100%, 22 are between 75% and 89.9%, seven are between 50% and 74.9%, and four are below 50%.
Within that same-year group, the lowest reported values are Gibraltar at 0.0%, Puerto Rico (US) at 25.02%, Chad at 29.44%, Syrian Arab Republic at 38.28%, and Marshall Islands at 50.57%. Vanuatu follows at 51.74%, Lebanon at 53.75%, Grenada at 67.42%, Rwanda at 67.57%, and Sierra Leone at 69.84%. These figures show that the gap remains wide even after observation year is held constant.
Why a 100% value is not a universal quality score
A complete 100% reported share can be an important sign that the entire primary-teacher workforce counted in the statistic met the country’s minimum training rule. Yet the indicator stops there. It does not compare the duration of training, the difficulty of certification, the quality of teacher-education institutions, continuing professional development, classroom conditions, or student outcomes.
National definitions also matter. UNESCO documentation notes that countries apply different standards when defining trained and qualified teachers. The measure is therefore strongest as an indicator of coverage relative to each country’s own minimum requirement. Cross-country gaps should prompt a closer look at national teacher policy rather than be treated as a single league table of teacher competence.
How to use the map without overreading it
The map is most useful for identifying where reported training coverage is high, where it is lower, and which economies merit a closer look. It also makes it easier to see that high shares are common in many regions rather than confined to one part of the world. But similar colours can represent observations from different years, so the map should always be read together with the year field.
Small islands and territories are difficult to see as polygons at world scale. Those observations are plotted as points so that all 156 rows remain represented. Missing values were not converted to zero. A displayed zero is a reported numeric observation in the underlying World Bank series, not a substitute for missing data.
Source and comparison rules
The data come from the World Bank World Development Indicators series Trained teachers in primary education (% of total teachers), indicator code SE.PRM.TCAQ.ZS. The World Bank identifies the UNESCO Institute for Statistics as the underlying data source. The measure is reported as a percentage of total primary teachers.
Three checks make the comparison more reliable. First, verify the observation year before comparing two economies. Second, remember that national minimum training requirements can differ. Third, do not turn the percentage into a direct claim about teacher effectiveness or education-system quality. Used within those limits, the indicator is a useful view of how completely primary-teacher workforces meet nationally defined training requirements.
Frequently Asked Questions
What does the trained primary teachers indicator measure?
It measures the percentage of primary teachers who meet at least the minimum organized teacher-training requirement recognized by the relevant national policy or law.
Are all 156 observations from 2025?
No. The latest available years range from 2002 to 2025. The largest group is 2024 with 67 economies, followed by 2023 with 23 and 2025 with 13.
Does 100% mean teachers are better trained than in a country below 100%?
Not necessarily. A 100% value means all teachers counted met that economy’s national minimum requirement. National standards differ, and the indicator does not directly measure teaching quality or student outcomes.
Related Articles
Green Map creates custom-edited map images using open geographic data sources such as geoBoundaries, Natural Earth, OpenStreetMap, and government open data. These maps are edited visual materials, not raw data files, and are provided for education, documents, presentations, and graphic reference.