World Bank indicator SN.ITK.SALT.ZS provides a latest non-empty estimate for 112 countries and economies of the share of households whose cooking salt tested positive for iodine. Observation years range from 2000 to 2020. The unweighted country mean is 75.82%, the median 84.4%, the first quartile 65.1%, and the third quartile 91.3%. Turkmenistan has the highest latest observation at 99.7%, while Djibouti, Somalia, and Haiti sit at the low end.
The indicator does not directly measure whether households consume an adequate amount of iodine. Its threshold is simply more than 0 parts per million of iodine in salt used for cooking. A salt sample can therefore count as positive even when the iodine concentration is below the level that would be considered adequately iodized under a separate quality standard.
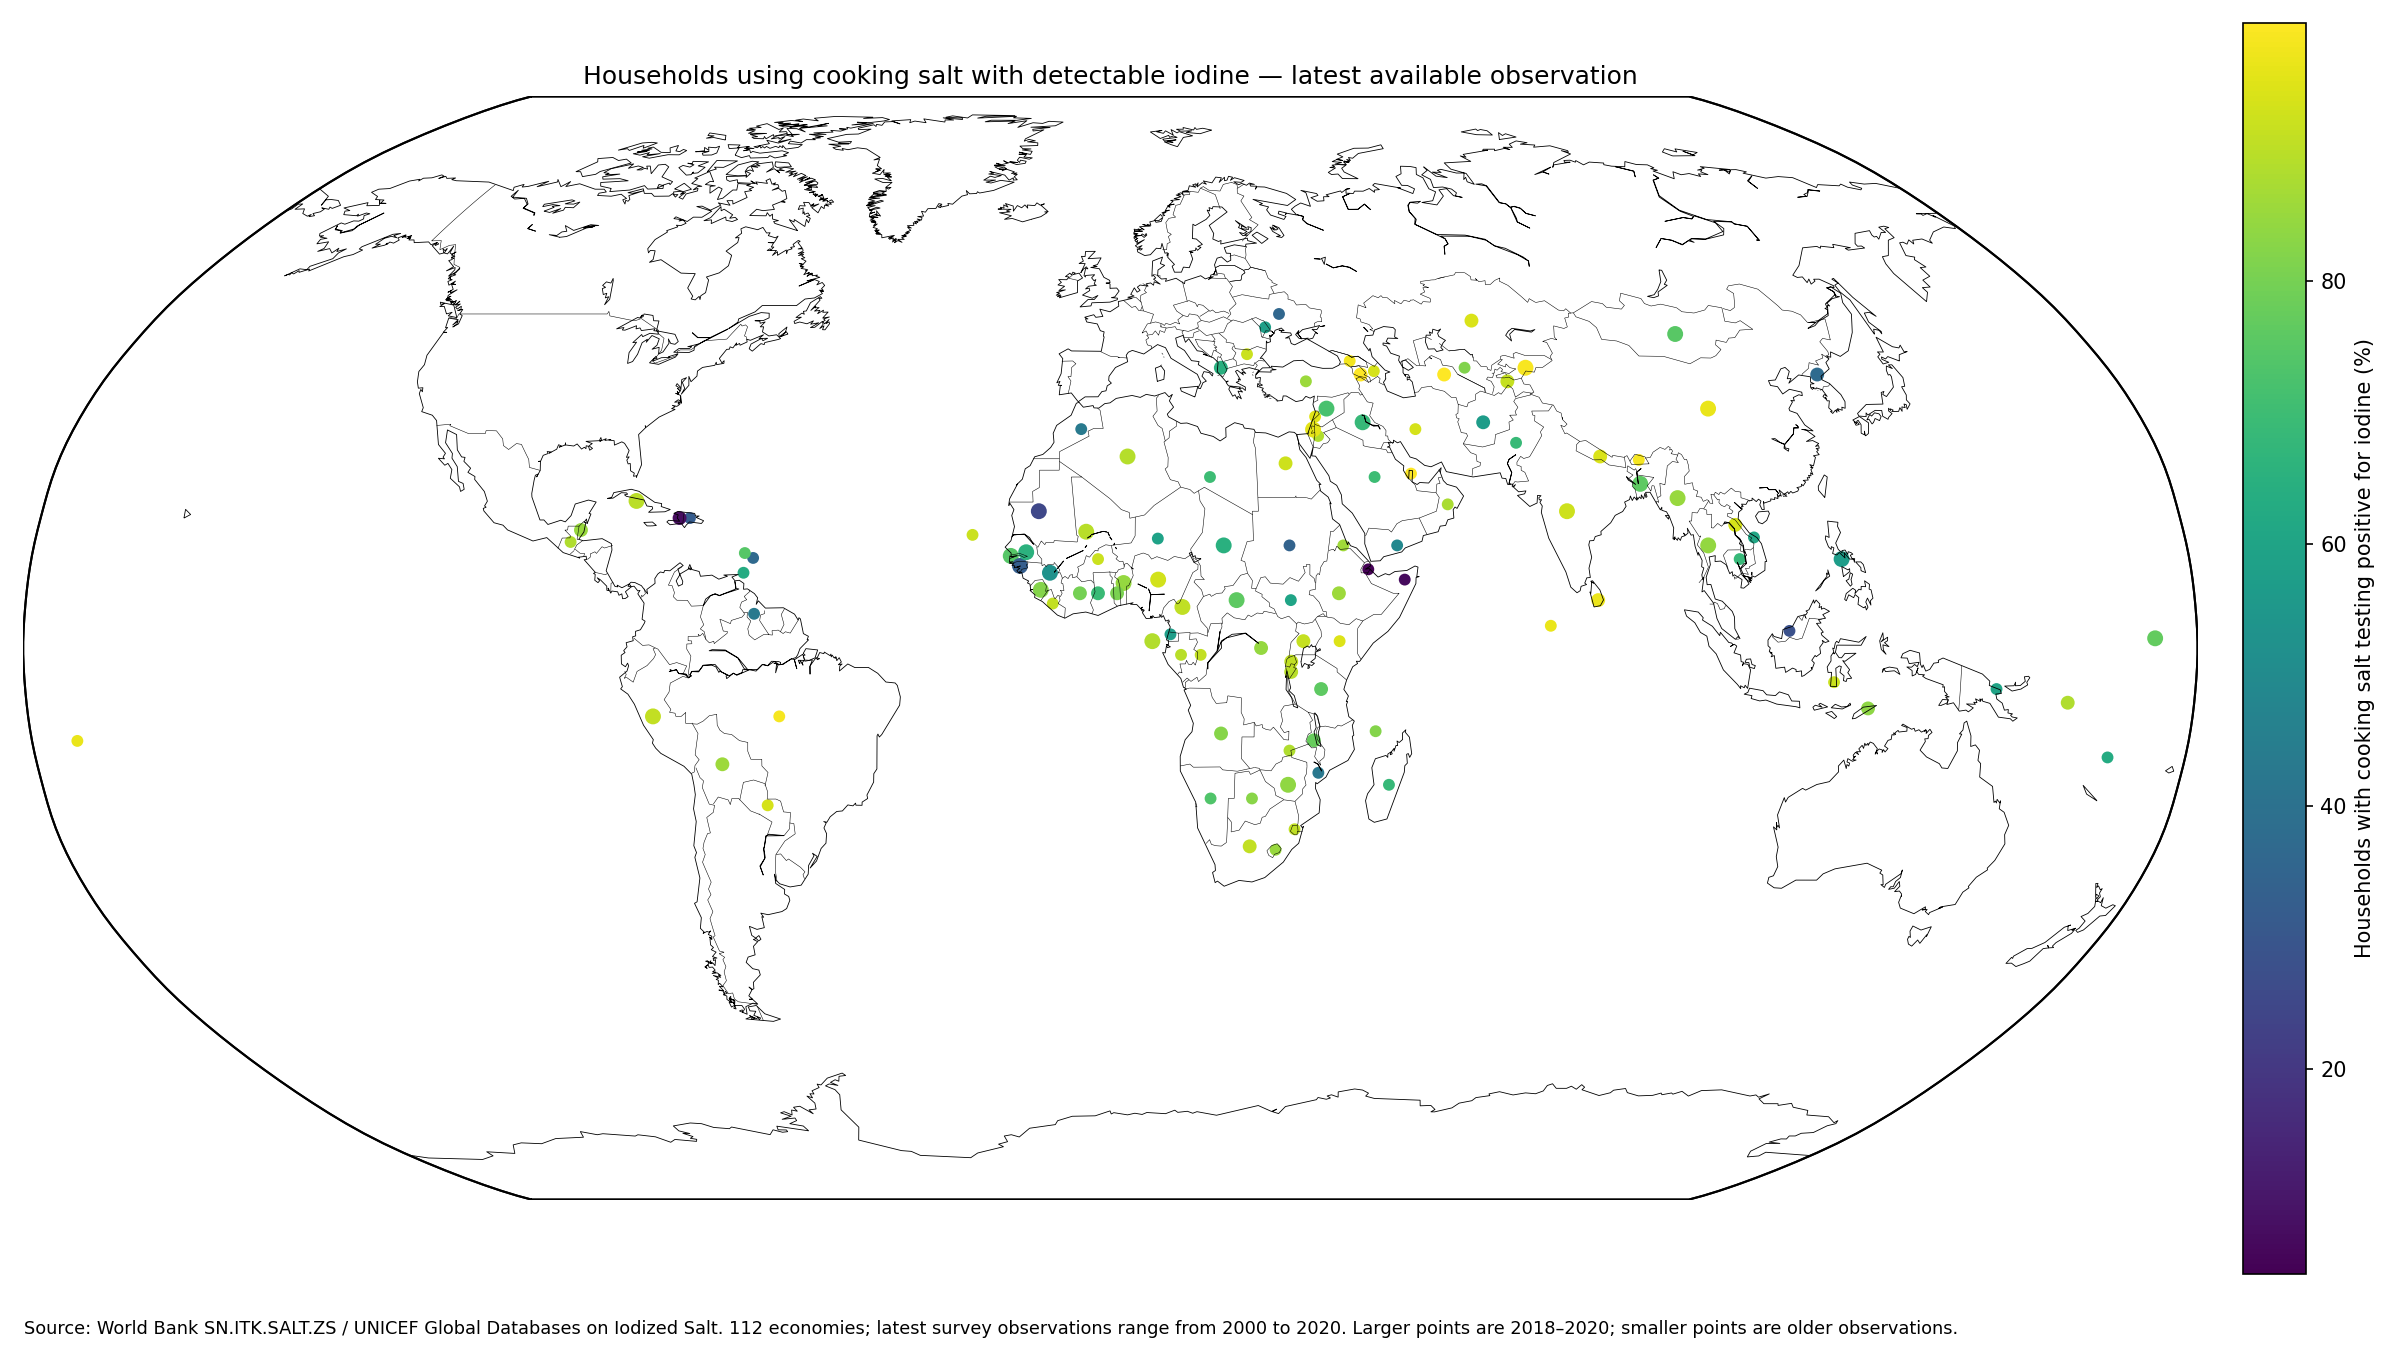
Table of Contents
What the iodized-salt household indicator measures
The World Bank definition is the percentage of households whose salt used for cooking tested positive for the presence of iodine at more than 0 ppm. The numerator is therefore households with a positive iodine test on cooking salt, while the denominator is surveyed households.
The World Bank metadata glossary identifies UNICEF Global Databases on Iodized Salt as the source and notes that most observations come from household surveys. The World Bank data page provides the series.
Detectable iodine is not the same as adequate iodization
The >0 ppm threshold is intentionally broad. A household can be counted as using iodized salt when the sample contains detectable iodine even if the amount is below an adequate household-level concentration.
UNICEF iodine data documentation explicitly distinguishes salt with any iodine from salt containing an adequate amount. UNICEF notes that household salt programs often target a range such as 15–40 ppm, while the precise target can depend on national conditions.
The median latest observation is 84.4%
Across the 112 latest observations, the median is 84.4%. The middle half lies between 65.1% and 91.3%. The simple mean of 75.82% is lower than the median because a small number of very low observations create a long lower tail.
3 observations are below 25%, 12 are from 25% to under 50%, 25 from 50% to under 75%, 36 from 75% to under 90%, and 36 are at least 90%. The two upper bands each contain 36 economies.
| Latest household share | Economies | Share of 112 observations |
|---|---|---|
| Below 25% | 3 | 2.7% |
| 25% to under 50% | 12 | 10.7% |
| 50% to under 75% | 25 | 22.3% |
| 75% to under 90% | 36 | 32.1% |
| 90% or more | 36 | 32.1% |
The highest observations approach universal household coverage
The highest latest observations include Turkmenistan at 99.7%, Armenia 99.4%, Qatar 99.4%, the Kyrgyz Republic 98.7%, Brazil 98.4%, Bhutan 98.4%, Georgia 98.1%, Sri Lanka 96.9%, Maldives 96.7%, and China 96.6%.
Values near 100% mean iodine was detected in the cooking salt of almost every surveyed household. They do not establish that every sample contained an optimal iodine concentration or that every resident had adequate iodine status.
| Rank | Country or economy | Observation year | Households with iodine-positive cooking salt |
|---|---|---|---|
| 1 | Turkmenistan | 2015 | 99.7% |
| 2 | Armenia | 2016 | 99.4% |
| 3 | Qatar | 2012 | 99.4% |
| 4 | Kyrgyz Republic | 2018 | 98.7% |
| 5 | Brazil | 2007 | 98.4% |
| 6 | Bhutan | 2008 | 98.4% |
| 7 | Georgia | 2009 | 98.1% |
| 8 | Sri Lanka | 2016 | 96.9% |
| 9 | Maldives | 2008 | 96.7% |
| 10 | China | 2018 | 96.6% |
| 11 | Samoa | 2014 | 96.4% |
| 12 | West Bank and Gaza | 2020 | 95.7% |
| 13 | Lebanon | 2004 | 95.3% |
| 14 | Kenya | 2014 | 94.6% |
| 15 | Kazakhstan | 2015 | 94.4% |
The low end shows substantial gaps in household coverage
The lowest latest observations include Djibouti at 4.4%, Somalia 6.9%, Haiti 7.5%, Mauritania 25.2%, Malaysia 28.2%, the Dominican Republic 31.9%, Guinea-Bissau 32.6%, Sudan 34.4%, Ukraine 35.9%, and Barbados 36.8%.
These figures indicate that a large share of sampled households did not have cooking salt that tested positive for iodine at the time of the survey. They should not be presented as current conditions when the observation itself is old.
| Low-end rank | Country or economy | Observation year | Households with iodine-positive cooking salt |
|---|---|---|---|
| 1 | Djibouti | 2006 | 4.4% |
| 2 | Somalia, Fed. Rep. | 2009 | 6.9% |
| 3 | Haiti | 2017 | 7.5% |
| 4 | Mauritania | 2018 | 25.2% |
| 5 | Malaysia | 2008 | 28.2% |
| 6 | Dominican Republic | 2006 | 31.9% |
| 7 | Guinea-Bissau | 2019 | 32.6% |
| 8 | Sudan | 2014 | 34.4% |
| 9 | Ukraine | 2012 | 35.9% |
| 10 | Barbados | 2012 | 36.8% |
| 12 | Mozambique | 2011 | 42.5% |
| 13 | Guyana | 2014 | 42.8% |
| 14 | Morocco | 2006 | 43.3% |
| 15 | Yemen, Rep. | 2013 | 48.7% |
| 16 | Guinea | 2018 | 52.6% |
Observation-year differences are the largest comparability issue
The 112 latest values span two decades, from 2000 through 2020. Only 29 observations are from 2018–2020, and 57 are from 2015–2020. Another 19 latest observations are earlier than 2010.
This is therefore not a synchronized world ranking for one year. It is a latest-available coverage view assembled from each country’s most recent non-empty World Bank observation. Salt-iodization programs can change substantially over a decade, making year labels essential.
| Observation year | Economies |
|---|---|
| 2020 | 1 |
| 2019 | 12 |
| 2018 | 16 |
| 2017 | 9 |
| 2016 | 10 |
| 2015 | 9 |
| 2014 | 11 |
| 2013 | 7 |
| 2012 | 9 |
| 2011 | 4 |
| 2010 | 5 |
| 2009 | 4 |
| 2008 | 4 |
| 2007 | 2 |
| 2006 | 4 |
| 2005 | 1 |
| 2004 | 1 |
| 2000 | 3 |
Only one observation is from 2020
West Bank and Gaza is the only 2020 observation in this dataset, at 95.7%. Twelve observations are from 2019 and sixteen from 2018. Describing the entire table as 2020 global coverage would misstate the data.
The World Bank reference period for the indicator extends to 2020, but country-level survey years differ. This article retains the individual observation year beside every ranked value.
Most observations are derived from household surveys
World Bank metadata says most iodized-salt consumption data come from household surveys, and for survey-based observations the year refers to the survey year. The metric is therefore tied to a field survey rather than a continuously measured administrative register.
Survey sampling allows a national estimate without testing every household, but it also means the value carries the usual survey-design and sampling considerations. Cross-country comparisons should not imply impossible precision.
Rapid test kits are mainly evidence of iodine presence
UNICEF explains that rapid test kits have historically been used for many household salt observations. They are useful for detecting whether iodine is present but are less suitable for accurately quantifying the exact iodine concentration.
For precise concentration, quantitative laboratory or titration methods are more appropriate. That methodological distinction is another reason not to equate this >0 ppm indicator with the share of households using adequately iodized salt.
Household salt coverage is not the same as population iodine status
Having iodized salt in the home is an important process indicator for iodine-deficiency prevention, but individual iodine status also depends on the salt concentration, intake, storage and cooking practices, processed foods, and other dietary sources.
UNICEF notes that urinary iodine concentration is an important outcome indicator for assessing population iodine status. Household salt coverage and biological iodine status should therefore be interpreted as complementary rather than interchangeable measures.
A high household share is not a complete health-outcome score
A value above 90% shows wide household reach of salt with detectable iodine. It does not directly measure thyroid disorders, pregnancy outcomes, child development, excessive iodine intake, or the quality of salt-fortification control.
A full public-health assessment requires evidence on iodine concentration, urinary iodine, vulnerable groups, production quality, retail supply, and program monitoring. This article limits conclusions to what the household salt indicator can support.
Country differences can reflect many program and market factors
Household access to iodized salt may be shaped by regulation, domestic salt production, imports, quality assurance, distribution, retail availability, and household purchasing patterns. None of those explanatory variables is included in the five-column country dataset.
The observed cross-country gaps should therefore not be attributed to one cause without country-specific evidence. Survey reports and UNICEF or health-ministry program documentation are needed for causal explanation.
The simple country mean is not a household-weighted global average
The 75.82% simple mean gives each of the 112 economies equal weight. A country with millions of households and a small island economy each count once.
A global household-weighted coverage estimate would require household counts or the appropriate survey and population weights. The mean and median used here summarize the cross-country distribution only.
Source and calculation notes
The source is World Bank World Development Indicators series SN.ITK.SALT.ZS, based on UNICEF Global Databases on Iodized Salt. The analysis uses 112 latest non-empty country observations and calculates the mean, median, quartiles, distribution bands, and rankings directly from those values. Official definitions are available from the World Bank data page and UNICEF iodine data page.
All 112 country codes are joined to geographic centroids for the map, producing a 100% match. Point size distinguishes more recent from older surveys, and no missing value is converted to zero.
Frequently Asked Questions
Does this indicator measure adequately iodized salt?
No. It measures households whose cooking salt tested positive for any iodine above 0 ppm, which is different from meeting an adequate concentration standard.
Does high household coverage prove adequate iodine status?
No. Population iodine status also depends on concentration, intake, diet, and other factors and is assessed with additional indicators such as urinary iodine.
Are all 112 observations from 2020?
No. Latest survey years range from 2000 to 2020, and only one observation is from 2020.
Related Articles
Green Map creates custom-edited map images using open geographic data sources such as geoBoundaries, Natural Earth, OpenStreetMap, and government open data. These maps are edited visual materials, not raw data files, and are provided for education, documents, presentations, and graphic reference.