World Bank indicator GC.REV.SOCL.ZS provides a latest non-empty social-contribution share of government revenue for 121 countries and economies. Only 67 observations are from 2024; the rest are last-available values from 1979–2023. The unweighted country mean is 15.73% and the median 13.89%. Germany has the highest latest observation at 55.66%, followed by China at 43.85% and Czechia at 42.09%.
Social contributions are not simply taxes. The World Bank defines them as actual or imputed contributions payable to social insurance schemes so that social benefits can be provided. The denominator is revenue broadly defined in government finance statistics, not tax revenue alone.
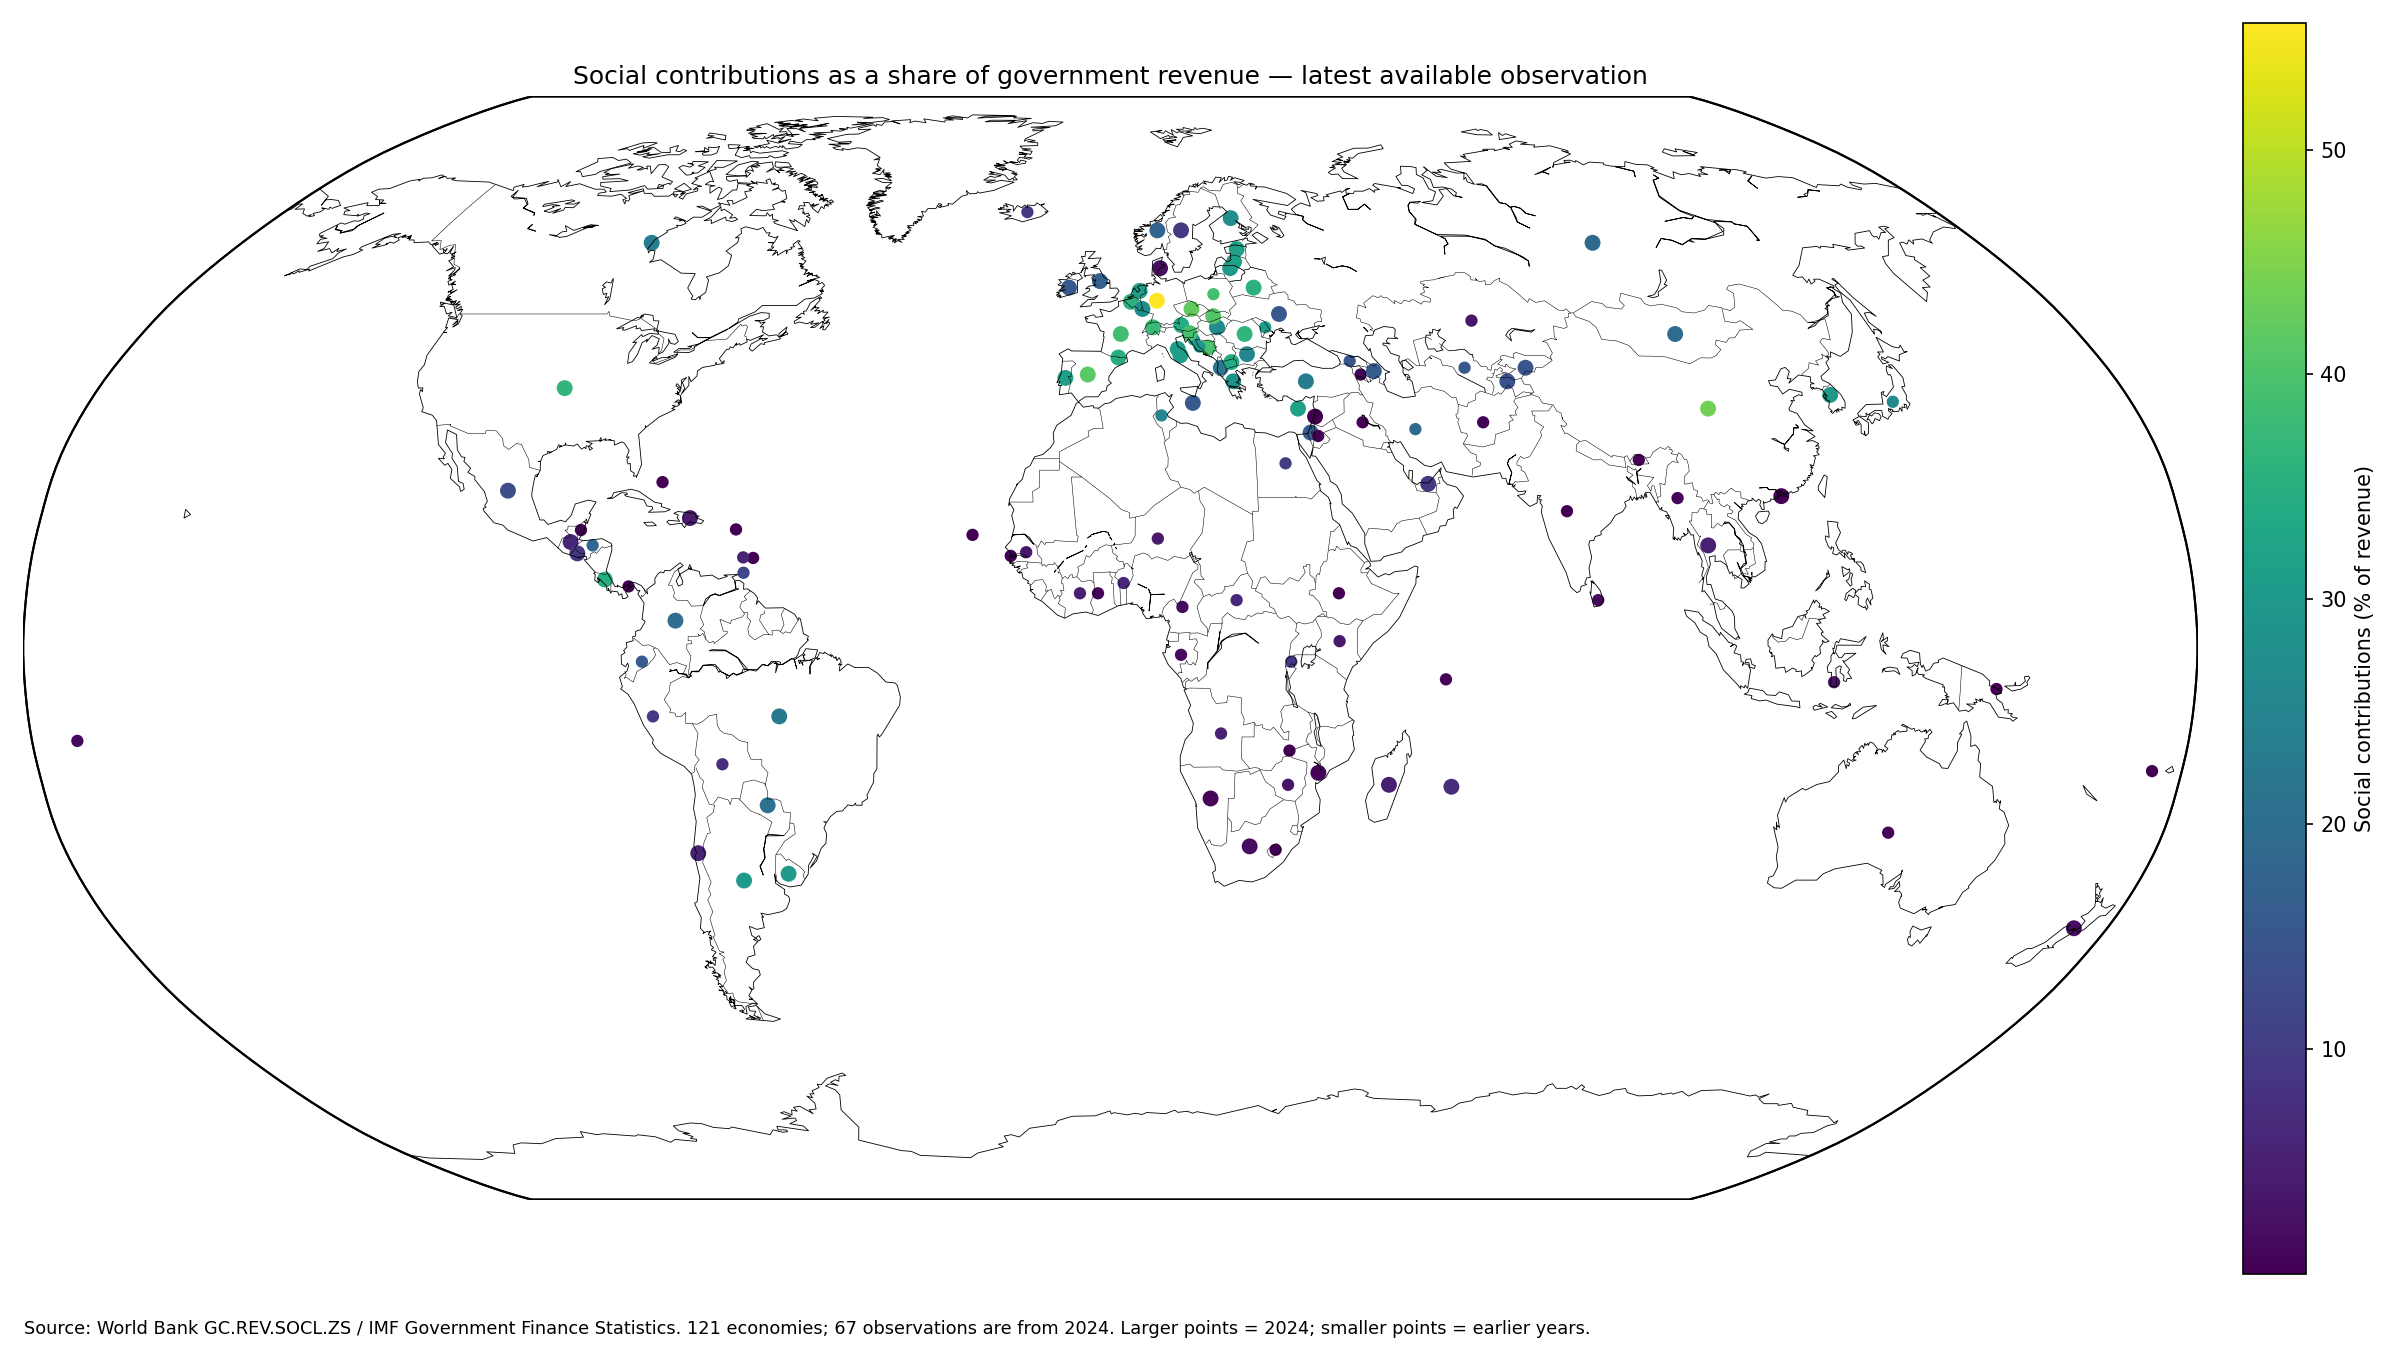
Table of Contents
What social contributions as a share of revenue measures
The indicator measures the share of government revenue represented by actual or imputed contributions payable to social insurance schemes. These contributions are intended to make provision for social benefits.
The World Bank metadata glossary identifies the IMF Government Finance Statistics Yearbook and data files as the source. The World Bank API provides the latest non-empty observations used here.
The denominator is total revenue, not tax revenue
World Bank metadata defines revenue as transactions that increase the economic value of a government unit or sector. Taxes are an important component, but revenue can also include non-tax items and other inflows classified within government finance statistics.
A value of 30% therefore does not mean that 30% of taxes are social-insurance contributions. It means social contributions equal 30% of the revenue denominator used in the government finance dataset.
The synchronized 2024 subset covers 67 economies
Among the 67 economies with 2024 observations, Germany records 55.66%, China 43.85%, Czechia 42.09%, Spain 41.41%, the Slovak Republic 40.76%, and Bosnia and Herzegovina 39.82%.
| 2024 rank | Country or economy | Social contributions / revenue |
|---|---|---|
| 1 | Germany | 55.66% |
| 2 | China | 43.85% |
| 3 | Czechia | 42.09% |
| 4 | Spain | 41.41% |
| 5 | Slovak Republic | 40.76% |
| 6 | Bosnia and Herzegovina | 39.82% |
| 7 | Slovenia | 39.20% |
| 8 | France | 38.92% |
| 9 | Switzerland | 37.72% |
| 10 | United States | 36.52% |
| 11 | Romania | 36.49% |
| 12 | Belgium | 35.60% |
| 13 | Belarus | 35.54% |
| 14 | Costa Rica | 34.59% |
| 15 | Andorra | 34.55% |
The 2024 subset has an unweighted mean of 22.76% and a median of 23.41%. The first quartile is 13.49% and the third quartile 32.73%. 9 economies are below 5%, 10 are from 5% to under 15%, 15 from 15% to under 25%, 20 from 25% to under 35%, and 13 are at least 35%.
The 2024 distribution spans near zero to more than half of revenue
Germany’s 55.66% indicates that social contributions account for more than half of the revenue measure in the reported government-finance framework. At the opposite end, Lebanon is below 0.01%, while Macao SAR, Mozambique, and Namibia are also below 1%.
The gap should not automatically be described as a difference in welfare generosity. Countries can finance social insurance through different combinations of contributions, taxes, transfers, and other revenue, and reported government coverage can also vary.
The full latest-value table mixes very different years
Across the 121 latest observations, Germany records 55.66%, China 43.85%, Czechia 42.09%, Spain 41.41%, and the Slovak Republic 40.76%. Poland, however, is a 2023 observation, Japan is from 1993, and Tunisia from 2012.
The full table is therefore a latest-available coverage view, not a synchronized 2024 ranking. Same-year comparisons are cleaner within the 67-economy 2024 subset.
| Latest-observation rank | Country or economy | Observation year | Social contributions / revenue |
|---|---|---|---|
| 1 | Germany | 2024 | 55.66% |
| 2 | China | 2024 | 43.85% |
| 3 | Czechia | 2024 | 42.09% |
| 4 | Spain | 2024 | 41.41% |
| 5 | Slovak Republic | 2024 | 40.76% |
| 6 | Bosnia and Herzegovina | 2024 | 39.82% |
| 7 | Slovenia | 2024 | 39.20% |
| 8 | Poland | 2023 | 39.08% |
| 9 | France | 2024 | 38.92% |
| 10 | Switzerland | 2024 | 37.72% |
| 11 | United States | 2024 | 36.52% |
| 12 | Romania | 2024 | 36.49% |
| 13 | Belgium | 2024 | 35.60% |
| 14 | Belarus | 2024 | 35.54% |
| 15 | Costa Rica | 2024 | 34.59% |
Some last-available values are decades old
Benin’s latest observation is from 1979, Niger’s from 1980, The Gambia’s from 1990, Fiji and Japan from 1993, and St. Kitts and Nevis from 1994. Several other economies last report during the 1990s, 2000s, or 2010s.
The most-recent-non-empty method improves geographic coverage but does not turn old observations into current ones. Observation year must remain part of the interpretation.
| Country or economy | Latest observation year | Social contributions / revenue |
|---|---|---|
| Benin | 1979 | 5.70% |
| Niger | 1980 | 3.98% |
| Gambia, The | 1990 | 0.24% |
| Fiji | 1993 | 0.00% |
| Japan | 1993 | 26.18% |
| St. Kitts and Nevis | 1994 | 0.01% |
| Cote d’Ivoire | 1995 | 4.59% |
| Egypt, Arab Rep. | 1995 | 9.81% |
| Australia | 1998 | 0.64% |
| Bahamas, The | 1999 | 0.05% |
| Ethiopia | 1999 | 0.00% |
| St. Vincent and the Grenadines | 1999 | 5.67% |
| Papua New Guinea | 2002 | 0.17% |
| Zambia | 2002 | 0.00% |
| Lesotho | 2003 | 0.00% |
| Central African Republic | 2004 | 6.39% |
| Indonesia | 2004 | 2.75% |
| Bolivia | 2007 | 7.02% |
| Georgia | 2007 | 14.91% |
| Seychelles | 2008 | 0.47% |
| Iran, Islamic Rep. | 2009 | 18.69% |
| Ghana | 2011 | 0.61% |
| Tunisia | 2012 | 25.46% |
| Armenia | 2015 | 0.73% |
| Barbados | 2016 | 0.01% |
| Belize | 2016 | 0.06% |
| Afghanistan | 2017 | 0.60% |
| Angola | 2017 | 5.00% |
| Kazakhstan | 2018 | 3.26% |
| Panama | 2018 | 0.02% |
| Zimbabwe | 2018 | 2.84% |
| Iraq | 2019 | 0.00% |
| Myanmar | 2019 | 0.78% |
| Trinidad and Tobago | 2019 | 12.22% |
| Bhutan | 2020 | 0.52% |
| Cabo Verde | 2020 | 0.18% |
| Honduras | 2020 | 18.37% |
| Cameroon | 2021 | 1.56% |
| Gabon | 2021 | 1.59% |
| Peru | 2021 | 9.69% |
| Ecuador | 2022 | 16.05% |
| India | 2022 | 0.10% |
| Serbia | 2022 | 29.63% |
| Croatia | 2023 | 27.86% |
| Iceland | 2023 | 9.52% |
| Jordan | 2023 | 0.06% |
| Kenya | 2023 | 3.85% |
| Moldova | 2023 | 30.74% |
| Poland | 2023 | 39.08% |
| Rwanda | 2023 | 8.79% |
| Samoa | 2023 | 1.34% |
| Senegal | 2023 | 3.64% |
| Sri Lanka | 2023 | 1.18% |
| Uzbekistan | 2023 | 15.36% |
The overall median is 13.89%
The median across all 121 latest observations is 13.89%, with a first quartile of 1.74% and third quartile of 29.63%. 42 observations are below 5%, 21 from 5% to under 15%, 19 from 15% to under 25%, 25 from 25% to under 35%, and 14 are at least 35%.
The simple mean of 15.73% is above the median because a group of observations in the 35–55% range pulls up the average. The broad spread means the median and distribution bands provide useful context.
Very low shares do not prove the absence of social insurance
The lowest latest observations include Zambia at 0.0002%, Iraq 0.0005%, Ethiopia 0.0021%, Lesotho 0.0027%, Fiji 0.0031%, St. Kitts and Nevis 0.0065%, and Lebanon 0.0077%.
Such small values should not be interpreted as proof that a country has no social-insurance system. Contributions may be recorded outside the government unit covered by the dataset, financing may rely more on taxes, or social security funds may not be fully included.
| Low-end rank | Country or economy | Observation year | Social contributions / revenue |
|---|---|---|---|
| 1 | Zambia | 2002 | 0.000% |
| 2 | Iraq | 2019 | 0.000% |
| 3 | Ethiopia | 1999 | 0.002% |
| 4 | Lesotho | 2003 | 0.003% |
| 5 | Fiji | 1993 | 0.003% |
| 6 | St. Kitts and Nevis | 1994 | 0.006% |
| 7 | Lebanon | 2024 | 0.008% |
| 8 | Barbados | 2016 | 0.008% |
| 9 | Panama | 2018 | 0.020% |
| 10 | Bahamas, The | 1999 | 0.046% |
| 11 | Belize | 2016 | 0.057% |
| 12 | Jordan | 2023 | 0.058% |
| 13 | India | 2022 | 0.099% |
| 14 | Papua New Guinea | 2002 | 0.167% |
| 15 | Cabo Verde | 2020 | 0.178% |
Government coverage is a major cross-country limitation
World Bank metadata notes that most countries consolidate central-government finance into one account, but some report only budgetary central government. Budgetary accounts can omit other central-government units such as social security funds.
In federal states, central-government accounts can also provide an incomplete view of total public finance. A difference between two reported ratios can therefore reflect both genuine institutional differences and differences in statistical coverage.
Social contributions and taxes are distinct government-finance categories
Taxes are generally compulsory, unrequited payments to government, whereas social contributions are linked to social-insurance arrangements and future social benefits. Both can contribute to government revenue but they are not identical fiscal categories.
A revenue-structure analysis should therefore inspect tax revenue and social contributions separately. Two governments with similar total revenue can rely on very different mixes of taxes and social-insurance financing.
A high share does not mean social-protection spending is high
This indicator is about revenue coming in, not social benefits paid out. A government can collect substantial social contributions while its benefit structure, reserves, subsidies, and spending patterns differ from another country.
Comparing welfare effort requires expenditure indicators such as social-protection spending, pension spending, health spending, or social benefits. Revenue composition and expenditure composition answer different questions.
The share is not the statutory contribution rate
A social-contribution share of revenue is not the same as the payroll contribution rate faced by workers or employers. The observed share also depends on employment, wages, participation in formal insurance schemes, compliance, the informal economy, and the size of other revenue sources.
Statutory employee and employer contribution rates require a different dataset. This indicator summarizes the role of contributions within recorded government revenue.
The indicator is not scaled to GDP
The denominator is government revenue rather than GDP. If social contributions remain unchanged but other government revenue rises, the share can fall. If other revenue shrinks, the share can rise even without an increase in contribution collections.
Questions about the macroeconomic size of social contributions require an amount-to-GDP measure. This series is better suited to examining how government revenue is composed.
A common 2024 year does not remove coverage differences
Restricting analysis to 2024 removes much of the timing problem but not differences in institutional coverage. One economy may report consolidated central government while another may report only budgetary central government.
World Bank metadata also warns that government-finance statistics can be incomplete, untimely, and not fully comparable. Detailed country comparison should therefore check IMF Government Finance Statistics metadata when coverage matters.
The country mean is not a world revenue-weighted share
The 15.73% simple mean gives each of the 121 economies equal weight. A government with very large revenue and a small government each count once.
A global revenue-weighted share would require underlying social-contribution and total-revenue amounts or an official aggregate. The mean and median here summarize the distribution of country ratios only.
Source and calculation notes
The source is World Bank World Development Indicators series GC.REV.SOCL.ZS, based on IMF Government Finance Statistics Yearbook and data files. The analysis uses 121 latest non-empty observations and separately reviews the 67 observations from 2024. The official World Bank API provides the series.
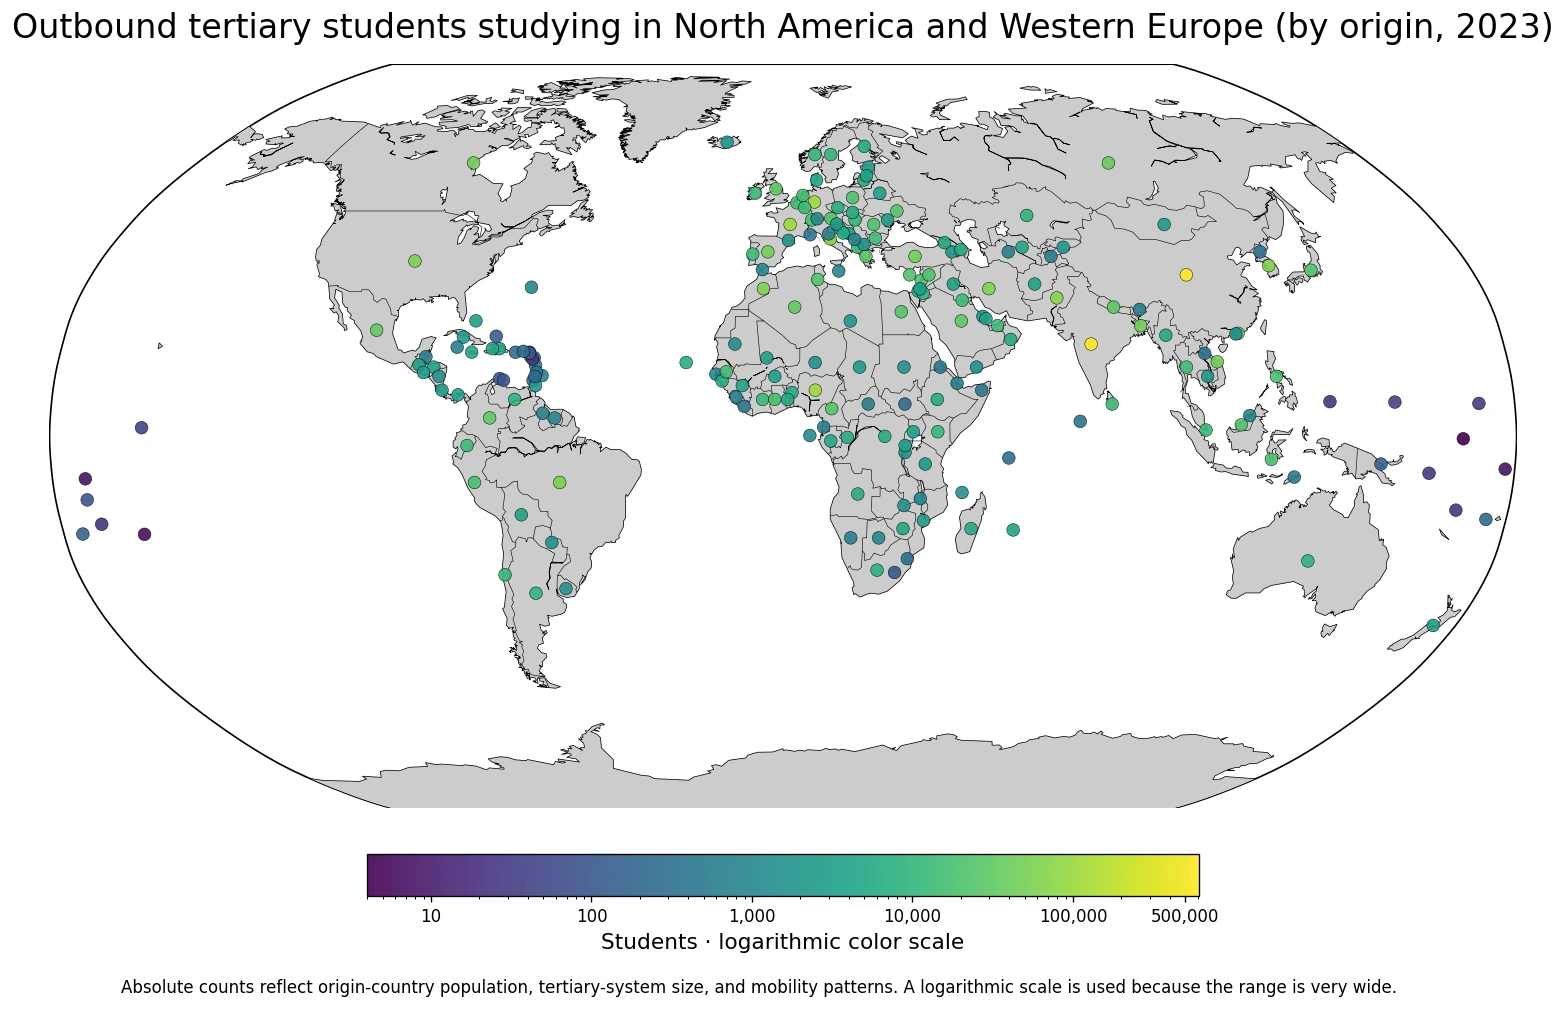
All 121 reported country codes are joined to geographic centroids for the map, producing a 100% match. Larger points mark 2024 observations and smaller points earlier years; missing values are not zero-filled.
Frequently Asked Questions
Are social contributions a share of tax revenue?
No. The denominator is total revenue in government finance statistics, while the numerator is actual or imputed contributions payable to social insurance schemes.
Does a high share mean social-protection spending is high?
Not necessarily. The indicator describes the revenue side and does not directly measure benefits or social-protection expenditure.
Are all 121 observations from 2024?
No. 67 are from 2024 and the rest are latest available observations from 1979–2023.
Related Articles
Green Map creates custom-edited map images using open geographic data sources such as geoBoundaries, Natural Earth, OpenStreetMap, and government open data. These maps are edited visual materials, not raw data files, and are provided for education, documents, presentations, and graphic reference.