World Bank indicator GC.NFN.TOTL.GD.ZS provides a latest non-empty observation for government net investment in nonfinancial assets as a share of GDP in 159 countries and territories. 88 observations are from 2024, while the complete set spans 1978–2024. The unweighted mean is 3.58% and the median 2.83%. Liberia has the highest latest value at 13.93%, but that observation is from 1978.
This is a government-finance indicator, not a measure of all private and public investment in the economy. World Bank metadata states that government nonfinancial assets include fixed assets, inventories, valuables, and nonproduced assets. Expressing net investment as a share of GDP shows the scale of government nonfinancial-asset investment relative to the size of domestic production.
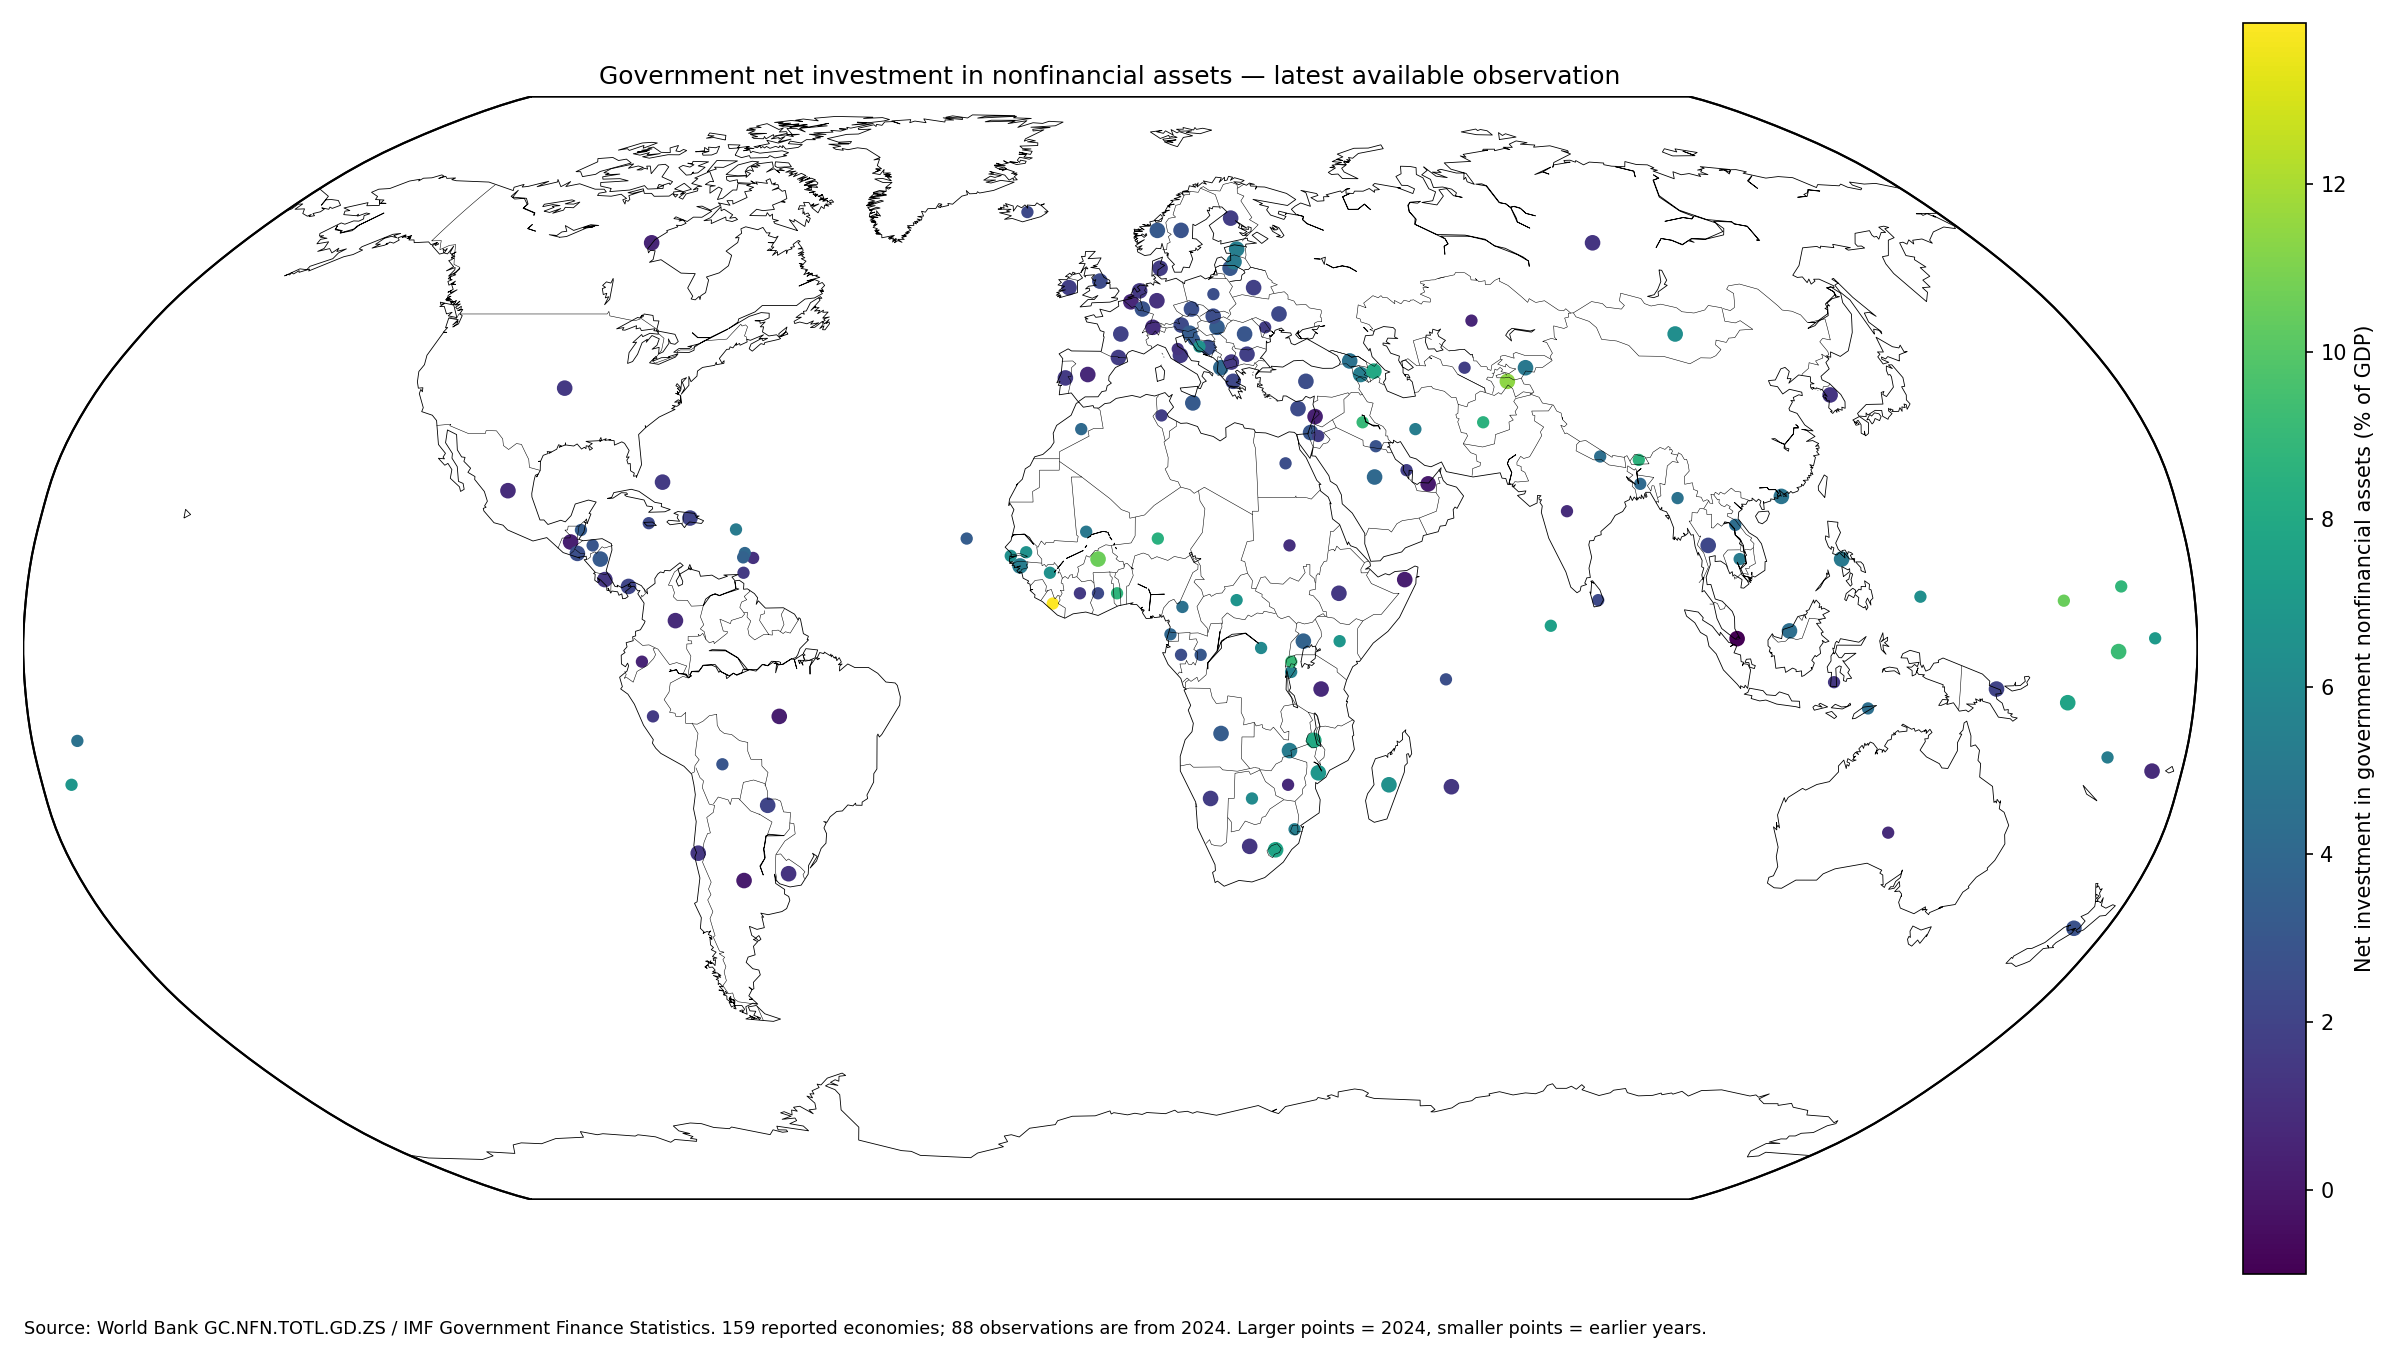
Table of Contents
What government nonfinancial-asset investment includes
The official definition covers fixed assets, inventories, valuables, and nonproduced assets. These assets can provide services in government production or economic benefits such as property income and holding gains. The source framework is the IMF Government Finance Statistics Yearbook and related data files.
The World Bank metadata glossary provides the definition, and the World Bank API provides country observations. The indicator belongs to government finance and should not be relabeled as economy-wide capital formation.
The full latest-value ranking mixes very different years
Liberia records 13.93%, Tajikistan 11.39%, Burkina Faso 10.56%, and Micronesia 10.52%. Naoero, Rwanda, Iraq, and the Marshall Islands are also near or above 9%. Yet Liberia is a 1978 observation, Micronesia is 2020, Rwanda 2023, and Tajikistan and Burkina Faso 2024.
That timing gap makes the 159-economy table unsuitable as a simple current ranking. A high latest value may be old. The observation year should remain visible beside every percentage.
| Rank | Country or territory | Observation year | Net investment/GDP |
|---|---|---|---|
| 1 | Liberia | 1978 | 13.93% |
| 2 | Tajikistan | 2024 | 11.39% |
| 3 | Burkina Faso | 2024 | 10.56% |
| 4 | Micronesia, Fed. Sts. | 2020 | 10.52% |
| 5 | Naoero | 2024 | 9.16% |
| 6 | Rwanda | 2023 | 9.04% |
| 7 | Iraq | 2019 | 8.99% |
| 8 | Marshall Islands | 2020 | 8.83% |
| 9 | Togo | 2023 | 8.72% |
| 10 | Bhutan | 2020 | 8.56% |
| 11 | Afghanistan | 2017 | 8.55% |
| 12 | Niger | 1980 | 8.46% |
| 13 | Malawi | 2024 | 8.02% |
| 14 | Azerbaijan | 2024 | 7.94% |
| 15 | Lesotho | 2024 | 7.69% |
The 2024 subset covers 88 economies
Restricting the dataset to 2024 leaves 88 economies. Tajikistan leads at 11.39%, followed by Burkina Faso at 10.56%, Naoero at 9.16%, Malawi at 8.02%, and Azerbaijan at 7.94%.
| 2024 rank | Country or territory | Net investment/GDP |
|---|---|---|
| 1 | Tajikistan | 11.39% |
| 2 | Burkina Faso | 10.56% |
| 3 | Naoero | 9.16% |
| 4 | Malawi | 8.02% |
| 5 | Azerbaijan | 7.94% |
| 6 | Lesotho | 7.69% |
| 7 | Solomon Islands | 7.66% |
| 8 | Mozambique | 6.85% |
| 9 | Madagascar | 6.48% |
| 10 | Mongolia | 6.30% |
| 11 | Estonia | 5.34% |
| 12 | Armenia | 5.31% |
| 13 | Guinea-Bissau | 5.29% |
| 14 | Zambia | 5.21% |
| 15 | Latvia | 5.08% |
The 2024 subset has an unweighted mean of 2.93% and a median of 2.28%. It improves time comparability but omits 71 economies that only have earlier latest observations.
The median is 2.83%
Across all 159 latest observations, the median is 2.83%, with a first quartile of 1.60% and third quartile of 5.16%. 55 observations are from zero to under 2%, 60 from 2% to under 5%, 39 from 5% to under 10%, and 4 at 10% or more.
The mean of 3.58% is above the median because the upper tail contains several values around 9–14%. Distribution bands and same-year comparisons are therefore more informative than the simple mean alone.
Singapore is the only negative observation
Singapore is the only negative value in the 159-economy set, at -1.00% in 2024. Because the indicator is a net concept, a negative value can occur when disposals or reductions exceed acquisitions under the accounting framework.
A negative value does not mean the overall government budget is necessarily in deficit. Net investment in nonfinancial assets is only one government-finance component and should be distinguished from fiscal balance, net lending or borrowing, and government debt.
| Low-end rank | Country or territory | Observation year | Net investment/GDP |
|---|---|---|---|
| 1 | Singapore | 2024 | -1.00% |
| 2 | United Arab Emirates | 2024 | 0.07% |
| 3 | Argentina | 2024 | 0.13% |
| 4 | Somalia, Fed. Rep. | 2024 | 0.24% |
| 5 | Brazil | 2024 | 0.25% |
| 6 | Guatemala | 2024 | 0.33% |
| 7 | Lebanon | 2024 | 0.35% |
| 8 | Ecuador | 2022 | 0.54% |
| 9 | Canada | 2024 | 0.57% |
| 10 | Kazakhstan | 2023 | 0.60% |
| 11 | Spain | 2024 | 0.72% |
| 12 | Belgium | 2024 | 0.73% |
| 13 | Zimbabwe | 2018 | 0.76% |
| 14 | Tanzania | 2024 | 0.80% |
| 15 | Colombia | 2024 | 0.84% |
This is not private investment or total capital formation
Business equipment spending, residential construction, and private fixed investment belong to broader economy-wide investment concepts. This series focuses specifically on government nonfinancial assets in fiscal accounts.
A high value should therefore not be described as evidence that private investment is strong, and a low value should not be treated as proof that an economy underinvests. It answers a narrower public-finance question.
The asset scope is broader than infrastructure
Nonfinancial assets are not limited to roads, schools, and government buildings. The official definition also includes inventories, valuables, and nonproduced assets. The series therefore will not match a narrowly defined public-infrastructure budget.
For transport, health, education, or other infrastructure spending, functional capital-expenditure data would provide a more specific view. This indicator is intentionally broader.
Net investment differs from gross acquisition
A net measure can be lower than gross asset purchases because disposals and capital-accounting adjustments matter. Large government acquisitions do not automatically produce a large net-investment ratio.
This distinction is especially important when comparing countries across decades, because the fiscal-accounting context and asset composition can differ even when the same World Bank series identity is preserved.
The GDP denominator changes the percentage
The same net-investment amount produces a higher ratio in a smaller-GDP economy and a lower ratio in a larger-GDP economy. The indicator is therefore not a ranking of absolute government investment amounts.
Absolute amounts require the current local-currency series or another monetary measure. The GDP ratio is more useful for comparing the relative scale of government nonfinancial-asset investment across differently sized economies.
Old latest observations are not current measurements
111 observations are from 2023–2024, while 21 are from 2019 or earlier. Liberia’s latest value is from 1978 and Niger’s from 1980. These observations remain the latest non-empty values in the source extract but should not be presented as current fiscal conditions.
For current-period policy comparisons, the 2024 subset is safer. The full latest-observation map is useful when broader country coverage matters and the year is explicitly displayed.
The country mean is not a GDP-weighted global ratio
The 3.58% simple mean gives each of the 159 economies equal weight. A very large economy and a very small economy each count once. It is not equal to total world government net investment divided by total world GDP.
A global weighted ratio would require GDP weights or aggregated investment and GDP amounts. The mean and median here summarize the distribution of country ratios only.
Source and calculation notes
The source is World Bank World Development Indicators series GC.NFN.TOTL.GD.ZS, sourced from IMF Government Finance Statistics. The analysis uses the latest non-empty observation for 159 economies and calculates distribution statistics and rankings directly from those values. The official World Bank API provides the series.
All 159 reported country codes are joined to geographic centroids. Larger points denote 2024 observations and smaller points earlier years. Missing economies are left as no data rather than converted to zero.
Frequently Asked Questions
Does this indicator include private business investment?
No. It covers government nonfinancial assets and is different from economy-wide gross fixed capital formation or private investment.
Does a negative value mean the entire government budget is in deficit?
No. It is a net nonfinancial-asset investment measure and is separate from overall fiscal balance, net lending or borrowing, and debt.
Are all 159 observations from 2024?
No. Only 88 are from 2024; latest observation years across the full dataset span 1978–2024.
Related Articles
Green Map creates custom-edited map images using open geographic data sources such as geoBoundaries, Natural Earth, OpenStreetMap, and government open data. These maps are edited visual materials, not raw data files, and are provided for education, documents, presentations, and graphic reference.