World Bank indicator SH.ALC.PCAP.LI provides the latest total alcohol-consumption estimate for 187 countries and territories. 185 observations are from 2020, while Montenegro and Serbia are from 2019. The unweighted mean is 5.07 litres of pure alcohol per person aged 15+, and the median is 4.30 litres. Romania has the highest observation at 16.80 litres, while 4 economies have a reported value of exactly zero.
The unit is litres of pure alcohol, not litres of beer, wine, or spirits. The World Bank definition combines recorded and unrecorded alcohol consumption, expresses it per person aged 15 or older over a calendar year, and adjusts for tourist consumption. It is therefore a population-level modeled estimate rather than the average amount consumed by people who drink alcohol.
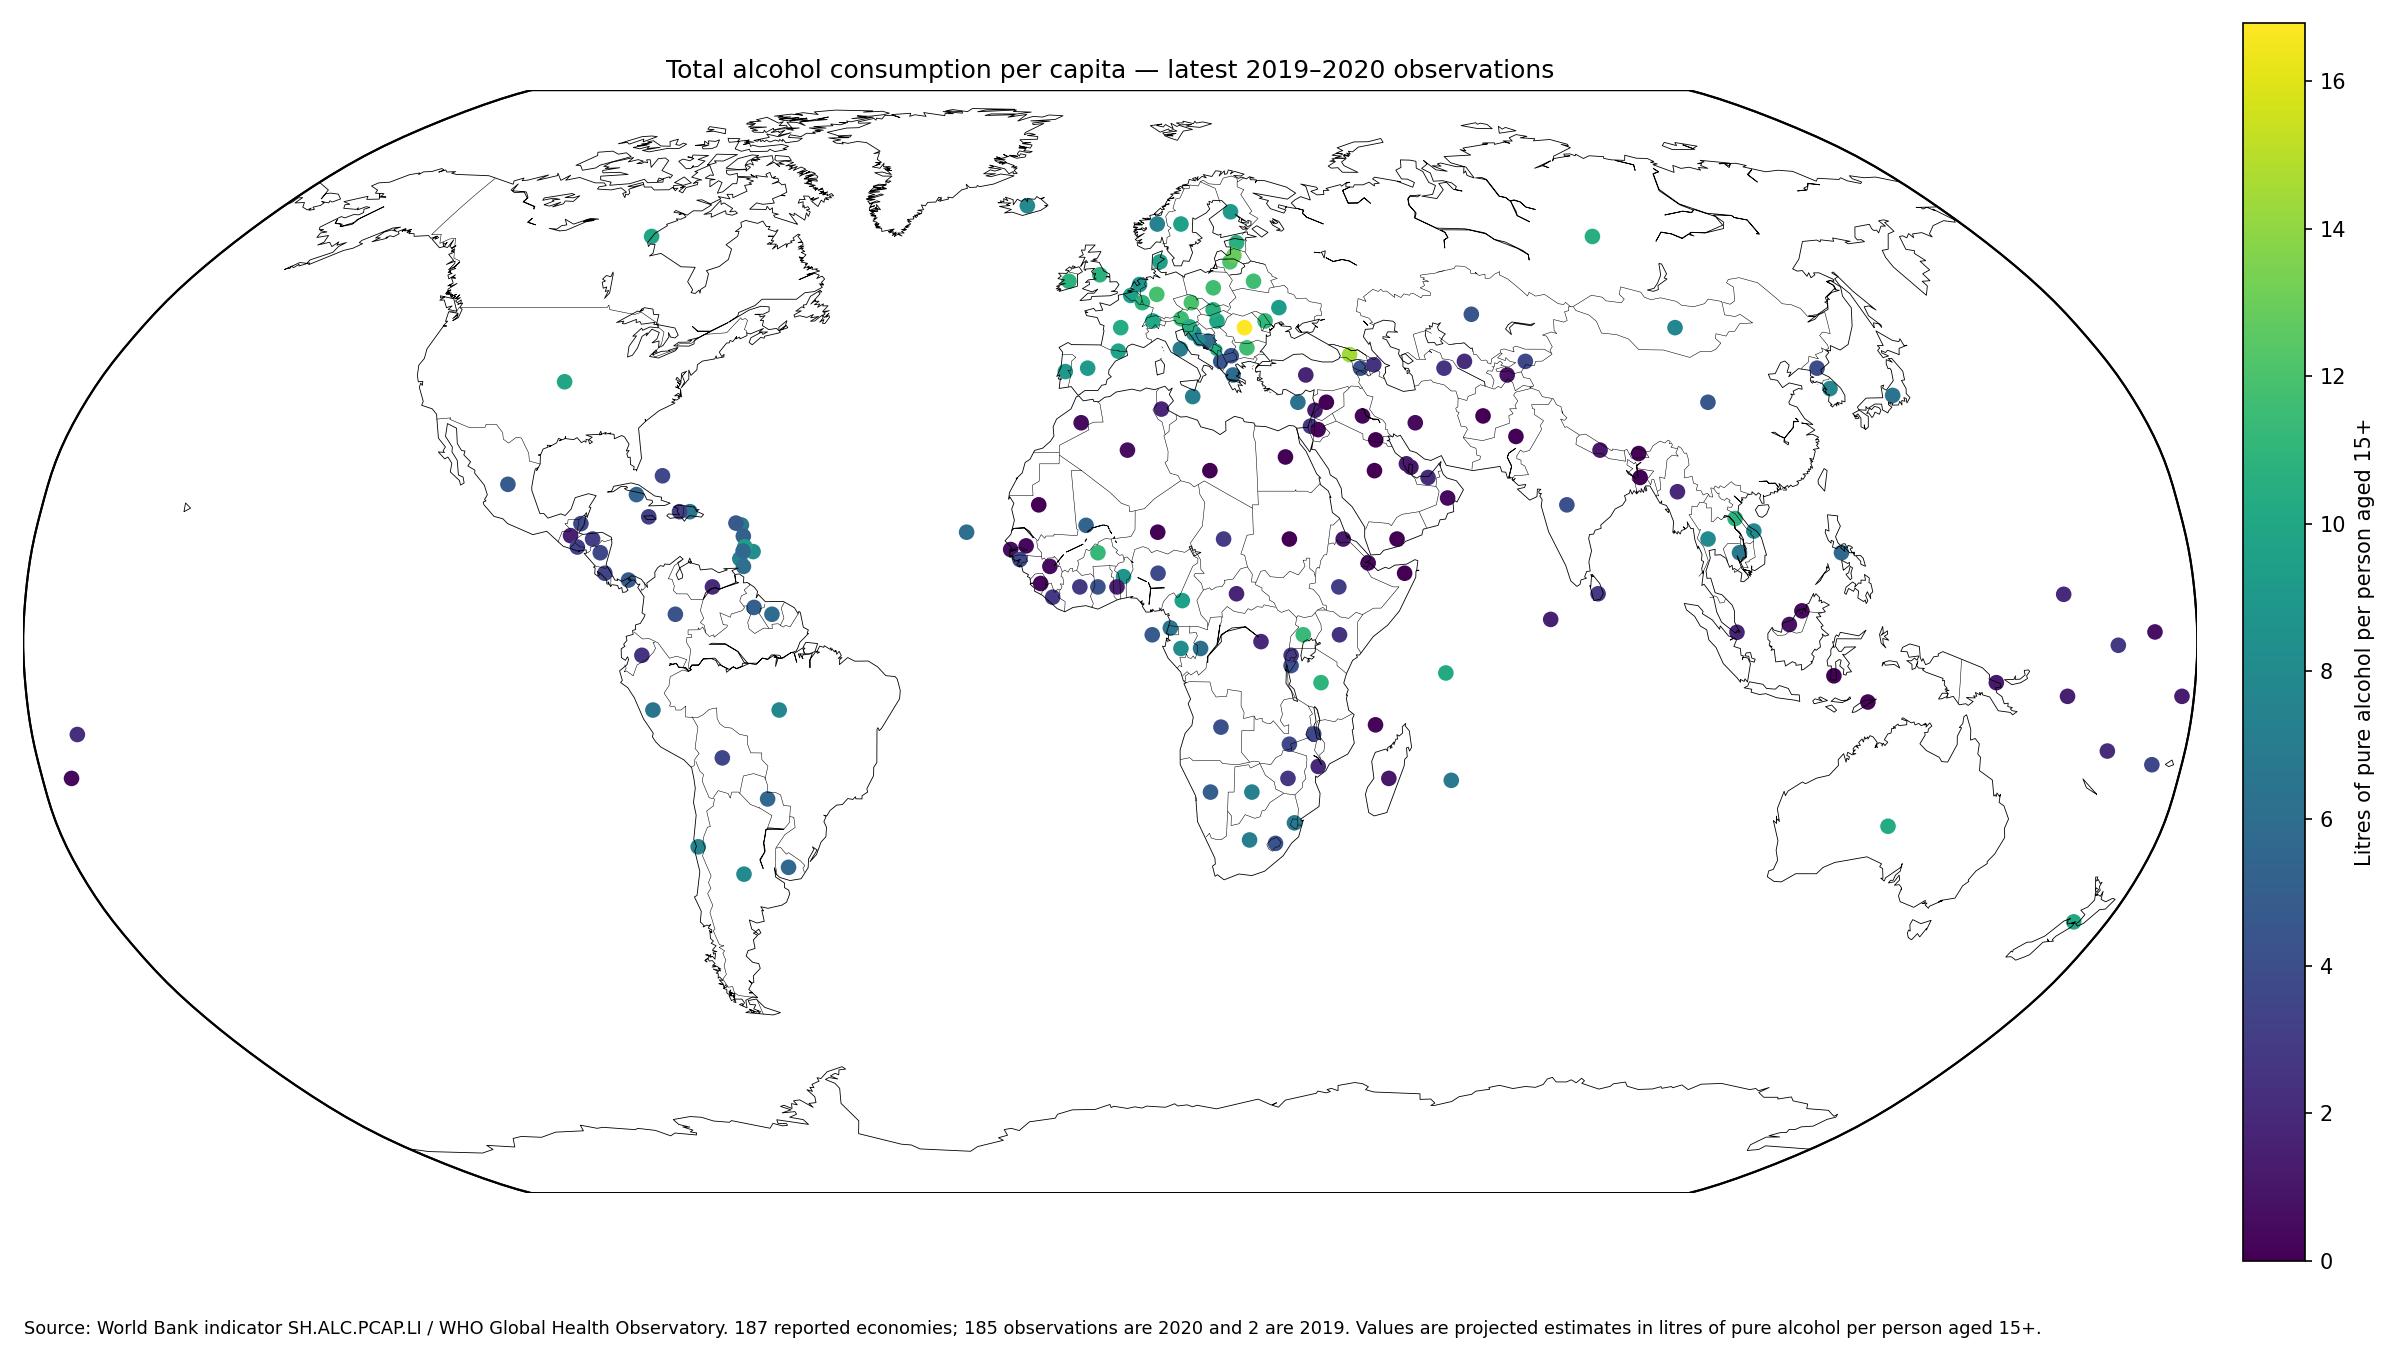
Table of Contents
Why the indicator uses litres of pure alcohol
Different alcoholic beverages contain very different concentrations of ethanol. Adding physical litres of beer, wine, and spirits would not create a comparable measure across countries. Converting beverages to pure-alcohol equivalents provides a common unit.
The World Bank metadata defines total consumption as recorded plus unrecorded alcohol, adjusted for tourism, for the population aged 15 and older. The World Bank API provides the country observations, with the WHO Global Health Observatory identified as the source.
Romania records the highest observation at 16.8 litres
Romania leads at 16.80 litres, followed by Georgia at 14.41, Latvia at 12.87, Lithuania at 12.10, and Czechia at 11.99. Germany, Poland, Belarus, Bulgaria, and Austria are also above 11 litres.
European countries are prominent in the upper part of the table, but the pattern is not exclusively European. Uganda records 11.30 litres, Burkina Faso 11.27, Tanzania 10.95, and Lao PDR 10.82. The map shows where high values occur, but this indicator alone does not identify why they occur.
| Rank | Country or territory | Observation year | Pure alcohol |
|---|---|---|---|
| 1 | Romania | 2020 | 16.80 L |
| 2 | Georgia | 2020 | 14.41 L |
| 3 | Latvia | 2020 | 12.87 L |
| 4 | Lithuania | 2020 | 12.10 L |
| 5 | Czechia | 2020 | 11.99 L |
| 6 | Germany | 2020 | 11.84 L |
| 7 | Poland | 2020 | 11.66 L |
| 8 | Belarus | 2020 | 11.63 L |
| 9 | Bulgaria | 2020 | 11.62 L |
| 10 | Austria | 2020 | 11.51 L |
| 11 | Uganda | 2020 | 11.30 L |
| 12 | Burkina Faso | 2020 | 11.27 L |
| 13 | Moldova | 2020 | 11.08 L |
| 14 | Tanzania | 2020 | 10.95 L |
| 15 | Lao PDR | 2020 | 10.82 L |
Zero and near-zero observations should remain distinct
Mauritania, Kuwait, Saudi Arabia, and Somalia have reported values of exactly zero. In total, 34 observations are below one litre. Sudan is 0.010 litres, Afghanistan 0.011, Libya 0.012, Yemen 0.044, and Indonesia 0.074.
Rounding very small positive estimates to zero would erase a distinction present in the source. At the same time, a modeled zero should not be expanded into a claim that absolutely no alcohol is consumed in the country. The series is an estimated national measure that includes modeled unrecorded consumption and therefore carries statistical uncertainty.
| Low-end rank | Country or territory | Observation year | Pure alcohol |
|---|---|---|---|
| 1 | Mauritania | 2020 | 0.000 L |
| 2 | Kuwait | 2020 | 0.000 L |
| 3 | Saudi Arabia | 2020 | 0.000 L |
| 4 | Somalia, Fed. Rep. | 2020 | 0.000 L |
| 5 | Sudan | 2020 | 0.010 L |
| 6 | Afghanistan | 2020 | 0.011 L |
| 7 | Libya | 2020 | 0.012 L |
| 8 | Yemen, Rep. | 2020 | 0.044 L |
| 9 | Indonesia | 2020 | 0.074 L |
| 10 | Pakistan | 2020 | 0.084 L |
| 11 | Syrian Arab Republic | 2020 | 0.092 L |
| 12 | Bangladesh | 2020 | 0.092 L |
| 13 | Egypt, Arab Rep. | 2020 | 0.130 L |
| 14 | Niger | 2020 | 0.130 L |
| 15 | Timor-Leste | 2020 | 0.170 L |
The median is 4.30 litres
The median is 4.30 litres, the first quartile 1.73, and the third quartile 8.02. The middle half of country observations therefore lies between roughly 1.73 and 8.02 litres. The simple mean of 5.07 litres is higher than the median because the upper tail contains 28 observations at 10 litres or more.
By broad bands, 34 observations are below 1 litre, 68 are from 1 to under 5 litres, 57 are from 5 to under 10 litres, and 28 are at least 10 litres. Only Romania is at or above 15 litres. These bands make the distribution easier to interpret than a single global country average.
The 2020 reference year deserves context
Almost the entire dataset refers to 2020, the year when the COVID-19 pandemic and many mobility and hospitality restrictions began. This cross-section does not show how much the pandemic changed alcohol consumption in any country. That question would require a consistent time series before and after 2020.
For cross-country comparison, however, the common reference year is a major advantage. Only Montenegro and Serbia use 2019 observations, so 185 of the 187 rows are directly aligned to 2020. That makes this dataset temporally cleaner than many latest-value World Bank series that mix a large range of years.
This is a population average, not a drinker-only average
The denominator is the entire population aged 15 and older, including people who do not drink alcohol. A national value of 8 litres does not mean that a person who drinks consumes 8 litres of pure alcohol on average. A drinker-only average requires a different denominator.
National averages also hide differences by sex, age, income, and region. This series cannot determine an individual’s drinking pattern or health risk. It is a population-level exposure indicator intended for country comparison.
Recorded and unrecorded consumption are combined
The ‘total’ in the indicator goes beyond alcohol captured in formal sales or tax systems. The official methodology combines recorded consumption with an estimate of unrecorded consumption, such as alcohol that may not appear fully in official commercial statistics.
World Bank metadata explains that the methodology uses a three-year average for recorded per-capita consumption and an estimate of unrecorded per-capita consumption for a calendar year. That approach improves cross-country comparability, but it also means the figures are estimates rather than a simple count of bottles sold.
Tourist consumption is adjusted
Tourism can distort apparent per-capita consumption when alcohol sold inside a country is consumed by visitors rather than residents. The official definition adjusts for tourists visiting the country and residents visiting other countries.
This adjustment is particularly relevant when comparing countries with very different tourism flows. It is one reason the indicator can differ from domestic retail or excise-sales statistics.
The data do not explain why countries differ
Prices, regulation, culture, religion, income, availability, tourism, and other factors can all be associated with alcohol consumption, but those variables are not contained in these 187 rows. The country ranking therefore should not be turned into a single-cause explanation.
Similarly, this indicator is not a direct measure of alcohol-related disease, injuries, or mortality. Population health analysis requires additional outcome data and controls for demographic and behavioral differences. The series is strongest as a standardized comparison of estimated national consumption levels.
The country mean is not a population-weighted world average
The 5.07-litre mean gives each of the 187 countries and territories equal weight. A very populous country and a small country each count as one observation. It should therefore not be described as the average alcohol consumption of the world’s population aged 15+.
A population-weighted global average would require the 15+ population of each country as weights. The median likewise represents the middle country observation, not the middle person in the world.
Source and calculation notes
The source series is World Bank World Development Indicators SH.ALC.PCAP.LI, sourced from the WHO Global Health Observatory. The analysis uses the latest non-empty observation for 187 countries and territories and calculates mean, median, quartiles, bands, and rankings directly from those values. The official World Bank API provides the same series.
The map joins all 187 country codes to country centroids, producing a 100% match for reported observations. Larger points denote 2020 data and smaller points denote the two 2019 observations. Missing economies are left as no data, and only source-reported zeros remain zero.
Frequently Asked Questions
Does 8 litres per capita mean eight litres of alcoholic drinks?
No. The measure converts different beverages into litres of pure alcohol rather than counting the physical volume of beer, wine, or spirits.
Is the indicator averaged only across people who drink alcohol?
No. The denominator is the entire population aged 15 and older, including people who do not drink.
Are all 187 observations from 2020?
No. 185 are from 2020, while Montenegro and Serbia use their latest 2019 observations.
Related Articles
Green Map creates custom-edited map images using open geographic data sources such as geoBoundaries, Natural Earth, OpenStreetMap, and government open data. These maps are edited visual materials, not raw data files, and are provided for education, documents, presentations, and graphic reference.